| Param | Original file | Final file |
|---|---|---|
| Filename | modeM0/AS1G05_106T01_9000000678_05353cztM0_level2.evt | modeM0/AS1G05_106T01_9000000678_05353cztM0_level2_quad_clean.evt |
| Size (bytes) | 423,794,880 | 74,445,120 |
| Size | 404.2 MB | 71.0 MB |
| Events in quadrant A | 2,981,060 | 463,807 |
| Events in quadrant B | 3,368,036 | 468,681 |
| Events in quadrant C | 2,875,961 | 458,987 |
| Events in quadrant D | 3,190,425 | 432,199 |
| Mode SS | |||
|---|---|---|---|
| Quadrant | BADHDUFLAG | Total packets | Discarded packets |
| A | 0 | 126 | 0 |
| B | 0 | 126 | 0 |
| C | 0 | 126 | 0 |
| D | 0 | 126 | 0 |
| Mode M0 | |||
|---|---|---|---|
| Quadrant | BADHDUFLAG | Total packets | Discarded packets |
| A | 0 | 13035 | 3 |
| B | 0 | 14103 | 2 |
| C | 0 | 12842 | 2 |
| D | 0 | 13844 | 2 |
| Mode M9 | |||
|---|---|---|---|
| Quadrant | BADHDUFLAG | Total packets | Discarded packets |
| A | 0 | 14 | 0 |
| B | 0 | 14 | 0 |
| C | 0 | 14 | 0 |
| D | 0 | 15 | 0 |
| Quadrant | Total seconds | Saturated seconds | Saturation percentage |
|---|---|---|---|
| A | 6164 | 72 | 1.168073% |
| B | 6164 | 95 | 1.541207% |
| C | 6164 | 26 | 0.421804% |
| D | 6164 | 83 | 1.346528% |
Noise dominated data is calculated using 1-second bins in cleaned event files. If a bin has >2000 counts, and if more than 50% of those come from <1% of pixels, then it is considered to be noise-dominated and hence unusable.
| Quadrant | # 1 sec bins | Bins with >0 counts | Bins with >2000 counts | High rate bins dominated by noise | Noise dominated (total time) | Noise dominated (detector-on time) | Marked lightcurve |
|---|---|---|---|---|---|---|---|
| A | 7399 | 6164 | 18 | 18 | 0.24% | 0.29% | 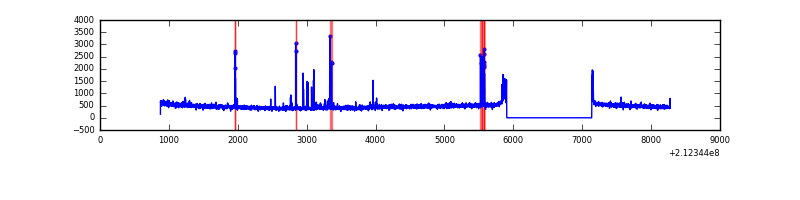 |
| B | 7399 | 6164 | 45 | 45 | 0.61% | 0.73% | 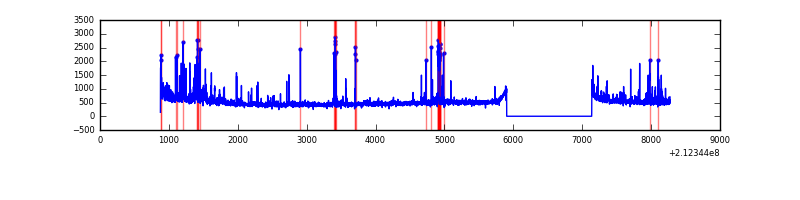 |
| C | 7399 | 6164 | 0 | 0 | 0.00% | 0.00% | 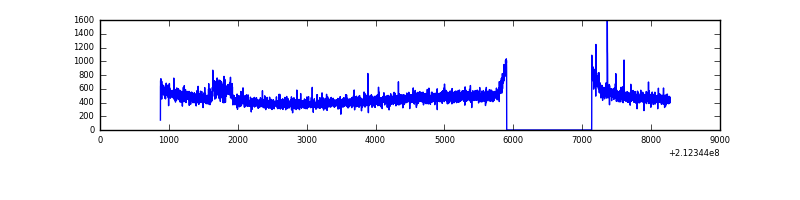 |
| D | 7399 | 6165 | 61 | 61 | 0.82% | 0.99% | 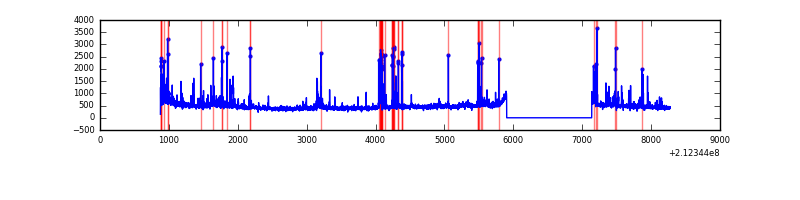 |
Top three noisy pixels from each quadrant. If the there are fewer than three noisy pixels in the level2.evt file, extra rows are filled as -1
| Pixel properties | Quadrant properties | ||||||
|---|---|---|---|---|---|---|---|
| Quadrant | DetID | PixID | Counts | Sigma | Mean | Median | Sigma |
| A | 0 | 50 | 156999 | 1040.61 | 731 | 715 | 150.2 |
| A | 15 | 174 | 11860 | 74.21 | 731 | 715 | 150.2 |
| A | 0 | 226 | 7285 | 43.75 | 731 | 715 | 150.2 |
| B | 10 | 16 | 211112 | 1492.59 | 740 | 722 | 141.0 |
| B | 4 | 81 | 111932 | 788.97 | 740 | 722 | 141.0 |
| B | 15 | 204 | 61490 | 431.11 | 740 | 722 | 141.0 |
| C | 1 | 16 | 103140 | 627.08 | 705 | 709 | 163.3 |
| C | 14 | 67 | 12176 | 70.2 | 705 | 709 | 163.3 |
| C | 15 | 1 | 9015 | 50.85 | 705 | 709 | 163.3 |
| D | 2 | 16 | 108663 | 626.84 | 695 | 670 | 172.3 |
| D | 4 | 95 | 102778 | 592.68 | 695 | 670 | 172.3 |
| D | 2 | 63 | 85597 | 492.95 | 695 | 670 | 172.3 |
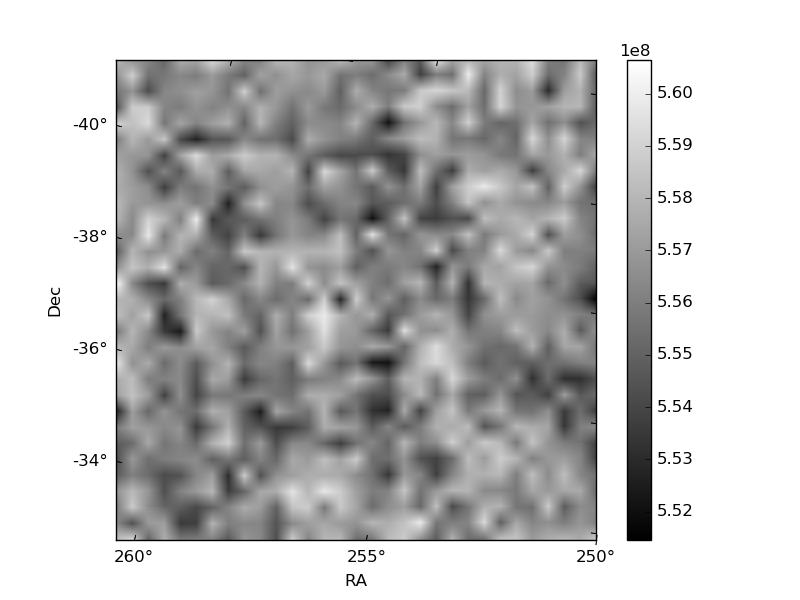
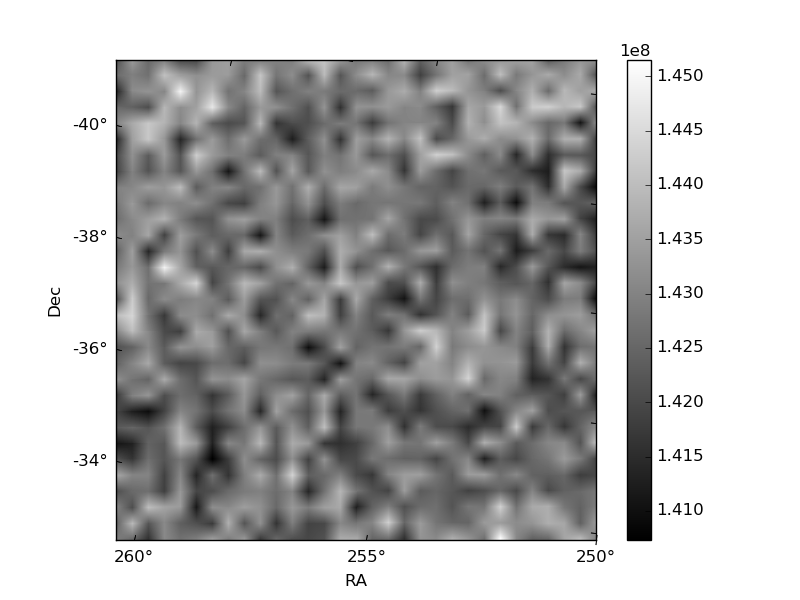
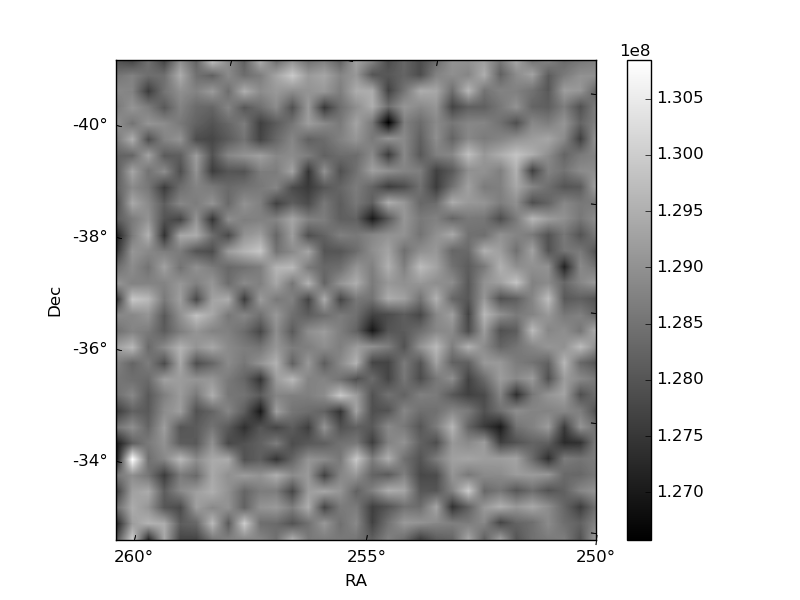
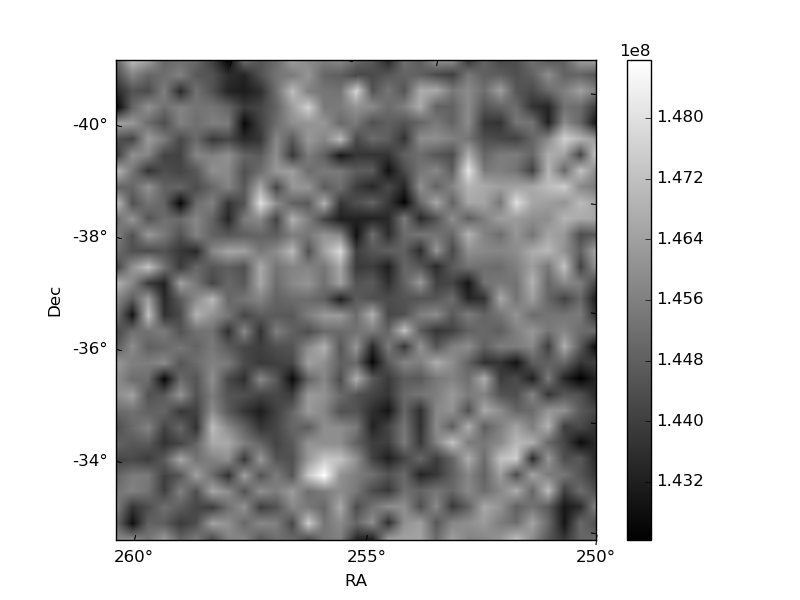
Histogram calculated using DETX and DETY for each event in the final _common_clean file
| Quadrant A | 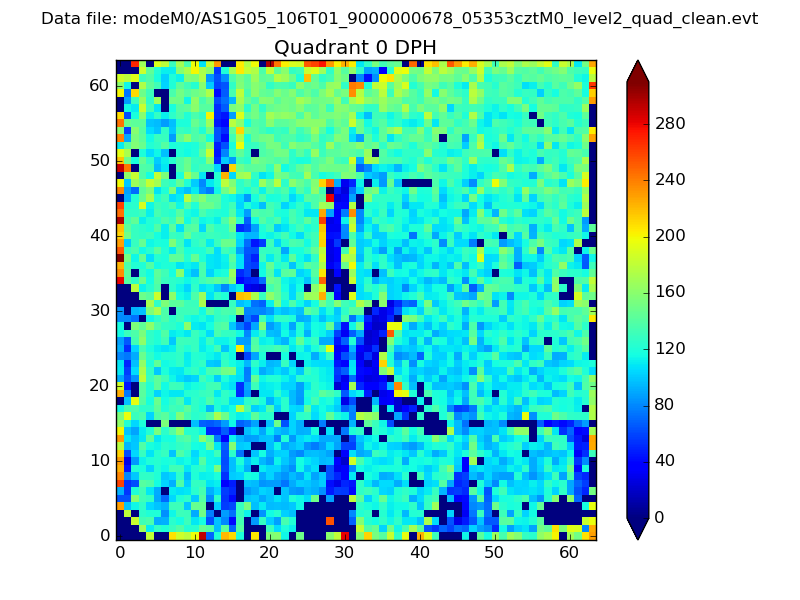 |
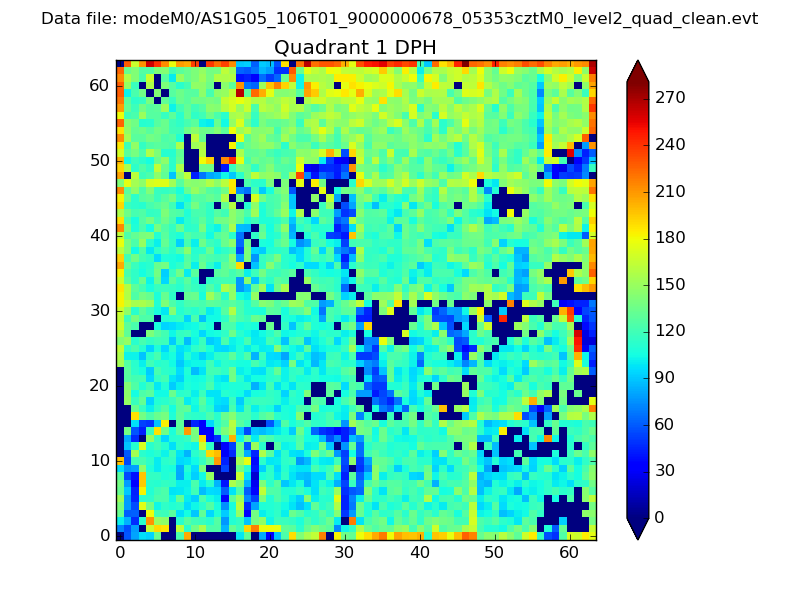 |
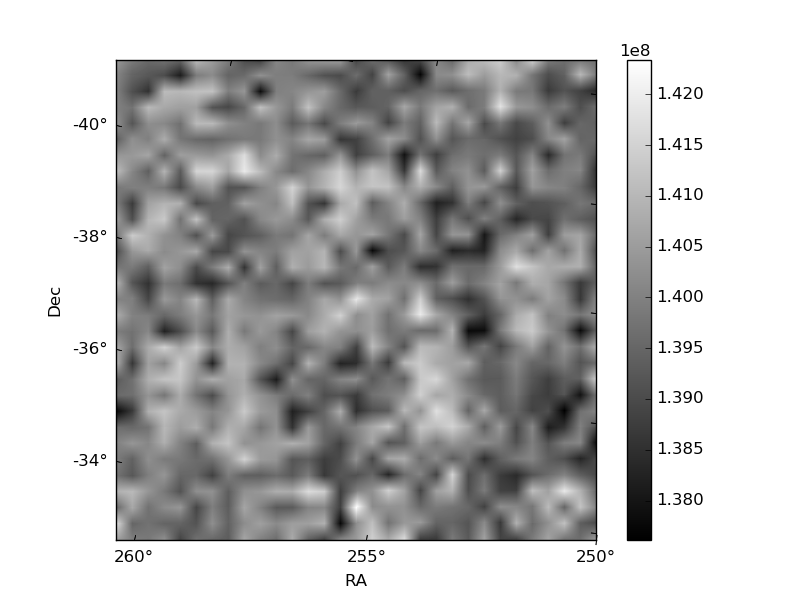
Quadrant B |
|---|---|---|---|
| Quadrant D | 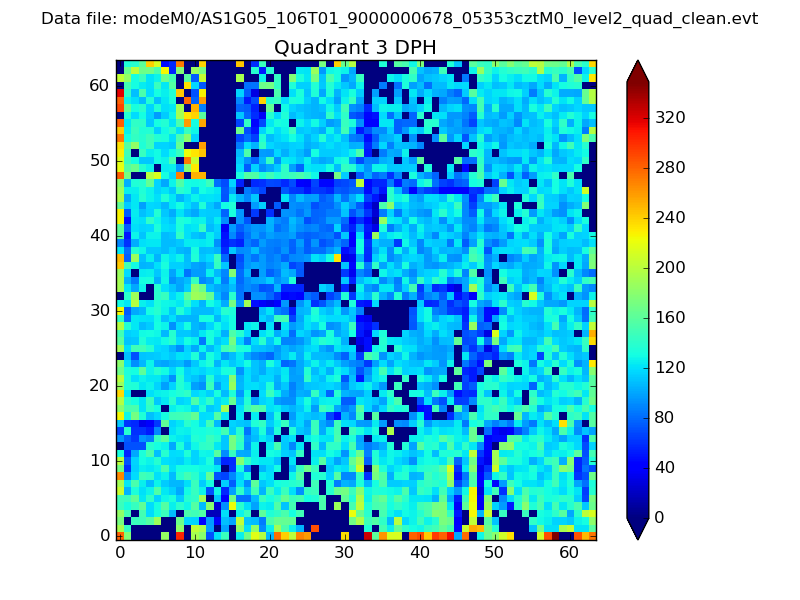 |
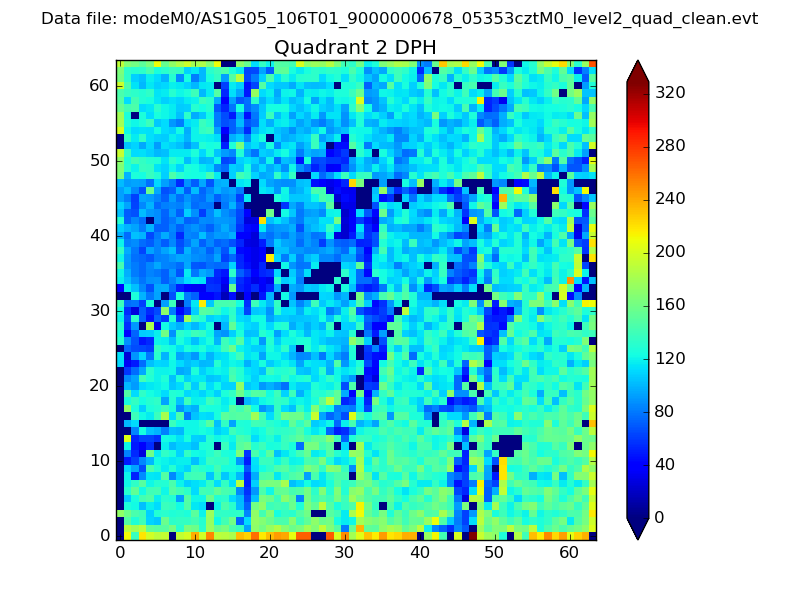 |
Quadrant C |
| Plot type | Count rate plots | Images |
|---|---|---|
| Comparison with Poisson distribution Blue bars denote a histogram of data divided into 1 sec bins. Red curve is a Poisson curve with rate = median count rate of data. |
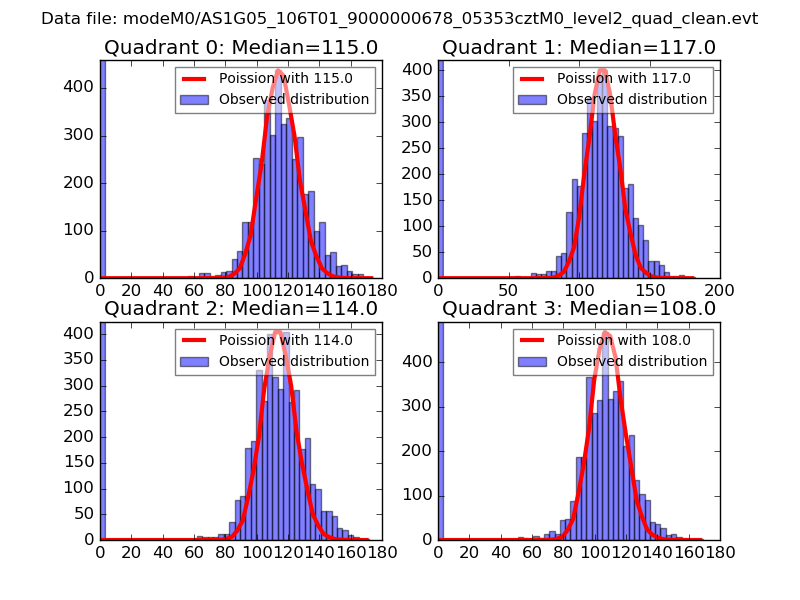 |
 |
| Quadrant-wise count rates Data is divided into 100 sec bins |
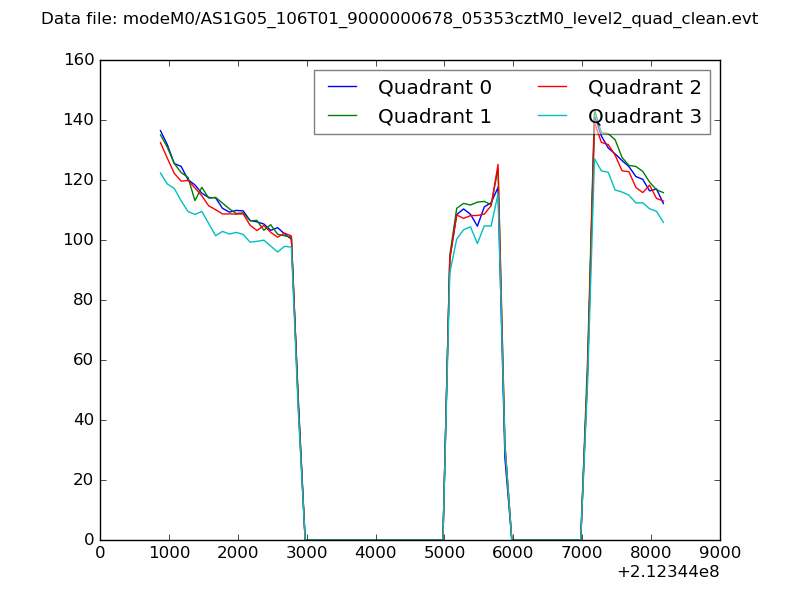 |
|
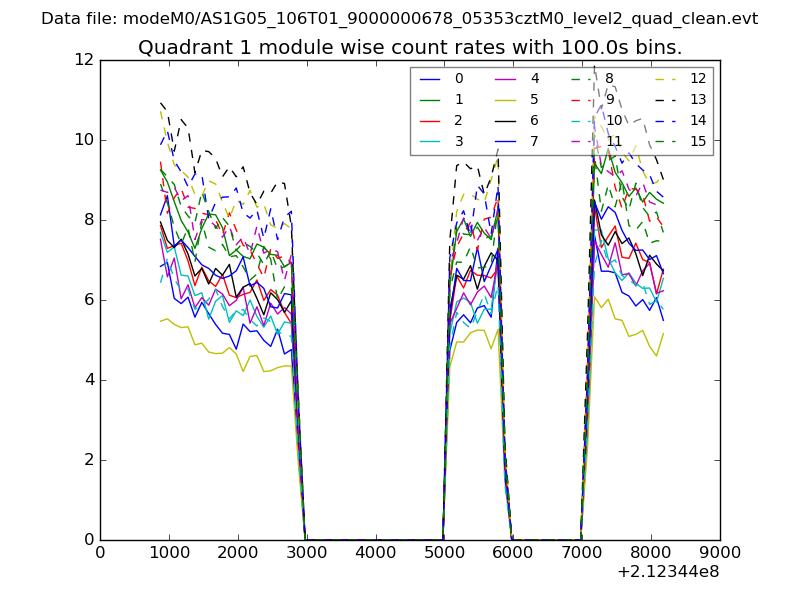
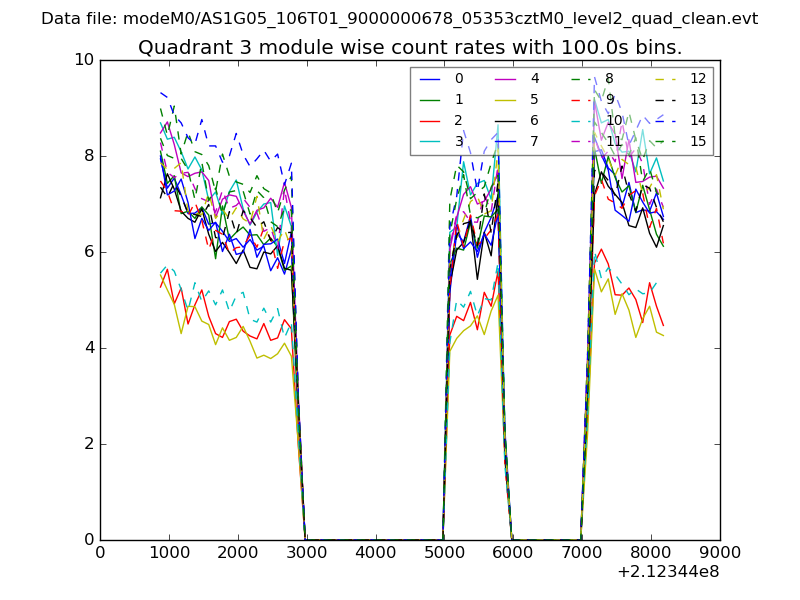
| Module-wise count rates for Quadrant A Data is divided into 100 sec bins |
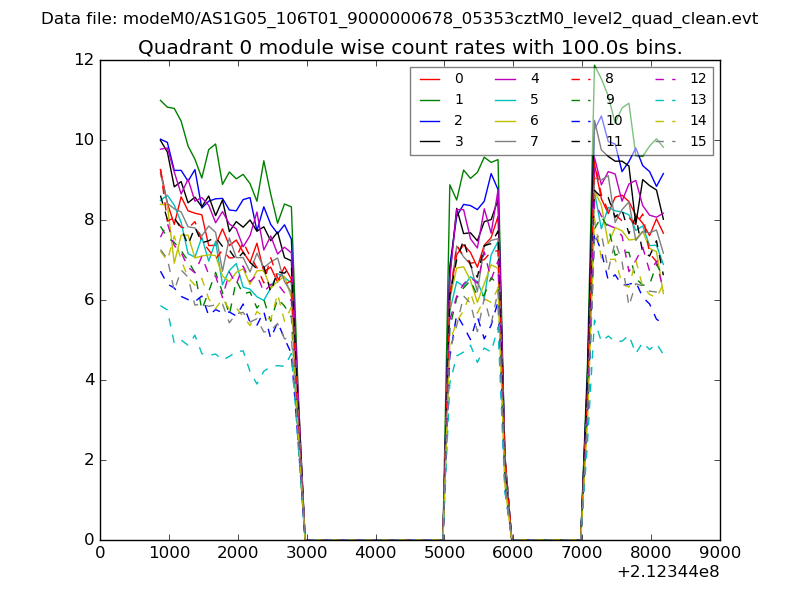 |
 |
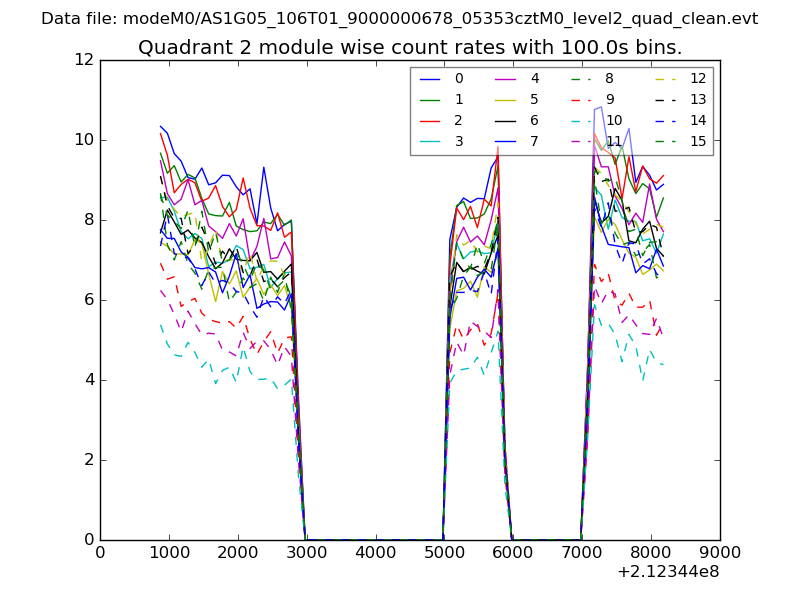
| Module-wise count rates for Quadrant B Data is divided into 100 sec bins |
 |
 |
| Module-wise count rates for Quadrant C Data is divided into 100 sec bins |
 |
 |
| Module-wise count rates for Quadrant D Data is divided into 100 sec bins |
 |
 |
| Parameter | Plot |
|---|---|
| CZT HV Monitor | 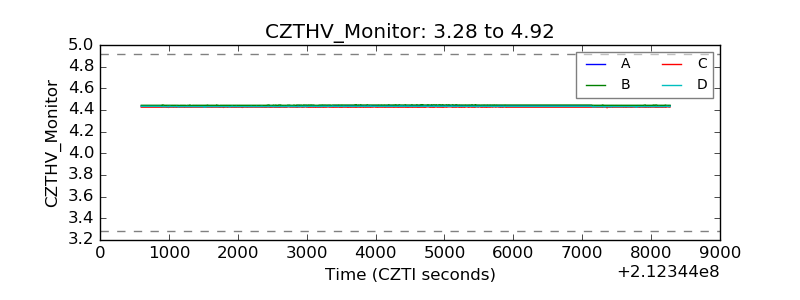 |
| D_VDD | 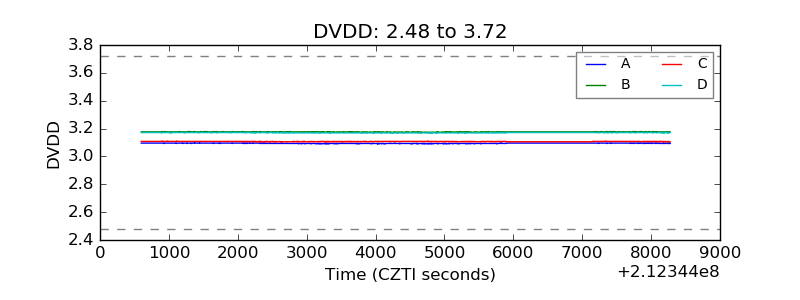 |
| Temperature 1 |  |
| Veto HV Monitor | 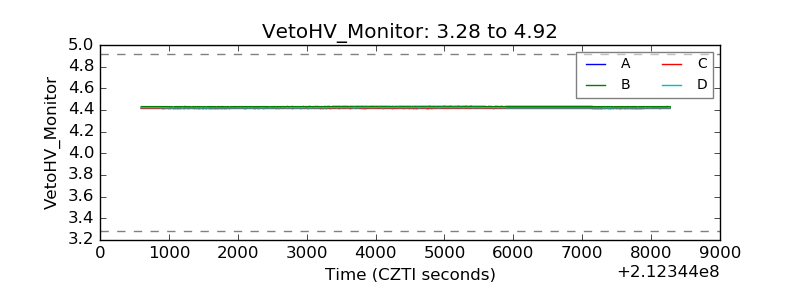 |
| Veto LLD | 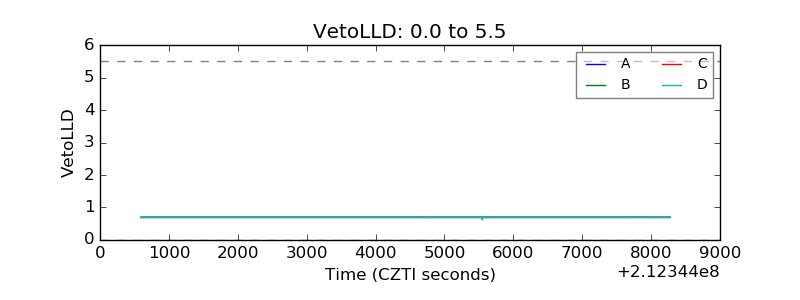 |
| Alpha Counter |  |
| _CPM_Rate |  |
| CZT Counter | 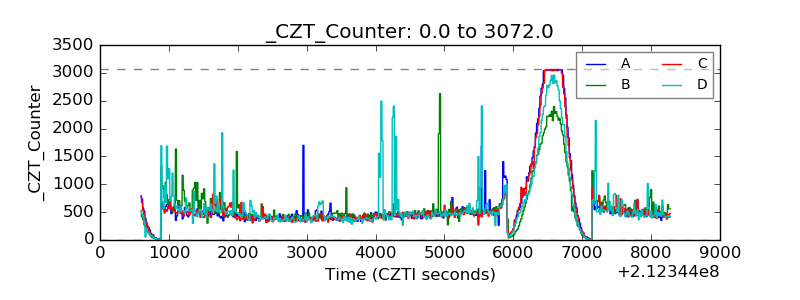 |
| +2.5 Volts monitor |  |
| +5 Volts monitor |  |
| _ROLL_ROT | 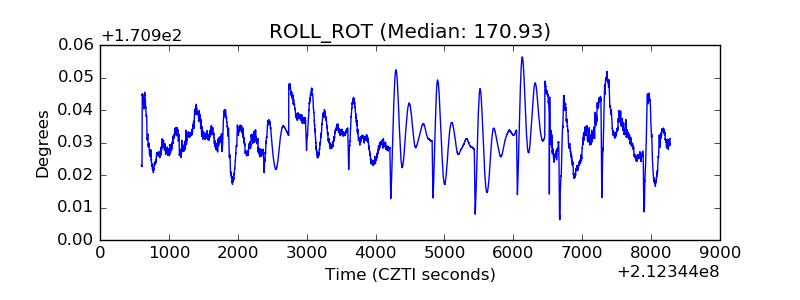 |
| _Roll_DEC | 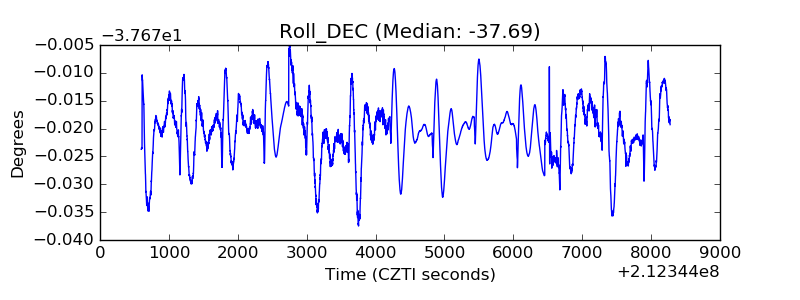 |
| _Roll_RA | 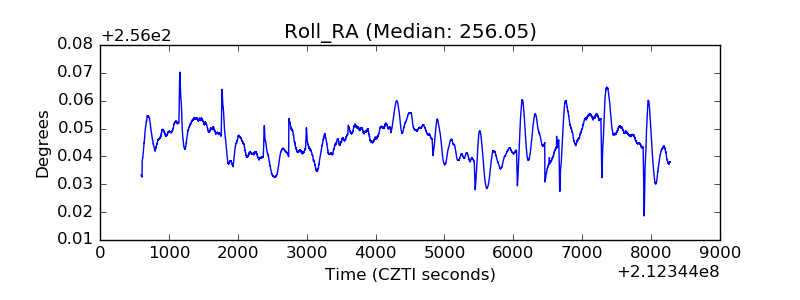 |
| Veto Counter | 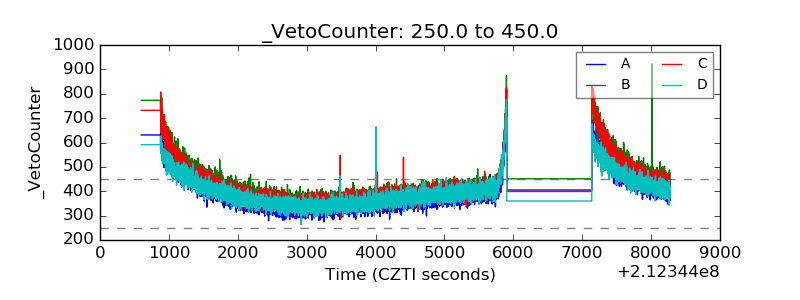 |