| Param | Original file | Final file |
|---|---|---|
| Filename | modeM0/AS1G05_106T01_9000000678_05355cztM0_level2.evt | modeM0/AS1G05_106T01_9000000678_05355cztM0_level2_quad_clean.evt |
| Size (bytes) | 451,071,360 | 70,799,040 |
| Size | 430.2 MB | 67.5 MB |
| Events in quadrant A | 3,267,981 | 430,163 |
| Events in quadrant B | 3,783,129 | 439,439 |
| Events in quadrant C | 3,096,976 | 435,604 |
| Events in quadrant D | 3,091,226 | 405,684 |
| Mode SS | |||
|---|---|---|---|
| Quadrant | BADHDUFLAG | Total packets | Discarded packets |
| A | 0 | 126 | 0 |
| B | 0 | 126 | 0 |
| C | 0 | 126 | 0 |
| D | 0 | 126 | 0 |
| Mode M0 | |||
|---|---|---|---|
| Quadrant | BADHDUFLAG | Total packets | Discarded packets |
| A | 0 | 13799 | 3 |
| B | 0 | 15200 | 2 |
| C | 0 | 13188 | 2 |
| D | 0 | 13555 | 2 |
| Mode M9 | |||
|---|---|---|---|
| Quadrant | BADHDUFLAG | Total packets | Discarded packets |
| A | 0 | 19 | 0 |
| B | 0 | 19 | 0 |
| C | 0 | 19 | 0 |
| D | 0 | 20 | 0 |
| Quadrant | Total seconds | Saturated seconds | Saturation percentage |
|---|---|---|---|
| A | 6200 | 137 | 2.209677% |
| B | 6200 | 125 | 2.016129% |
| C | 6200 | 33 | 0.532258% |
| D | 6200 | 55 | 0.887097% |
Noise dominated data is calculated using 1-second bins in cleaned event files. If a bin has >2000 counts, and if more than 50% of those come from <1% of pixels, then it is considered to be noise-dominated and hence unusable.
| Quadrant | # 1 sec bins | Bins with >0 counts | Bins with >2000 counts | High rate bins dominated by noise | Noise dominated (total time) | Noise dominated (detector-on time) | Marked lightcurve |
|---|---|---|---|---|---|---|---|
| A | 7540 | 6200 | 90 | 90 | 1.19% | 1.45% | 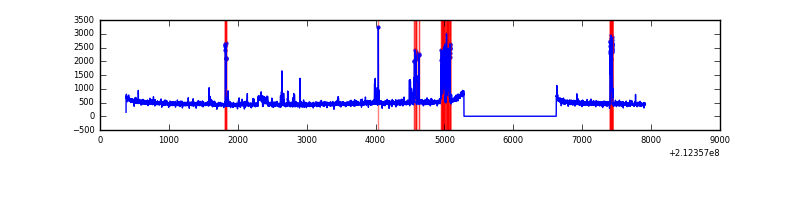 |
| B | 7540 | 6200 | 72 | 72 | 0.95% | 1.16% | 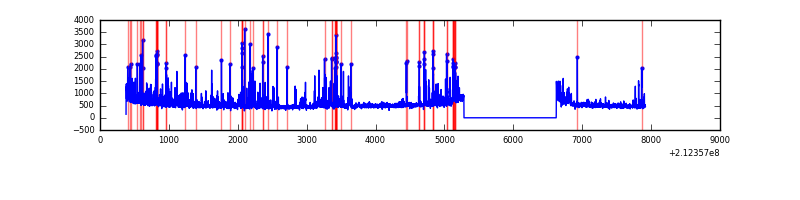 |
| C | 7540 | 6200 | 0 | 0 | 0.00% | 0.00% | 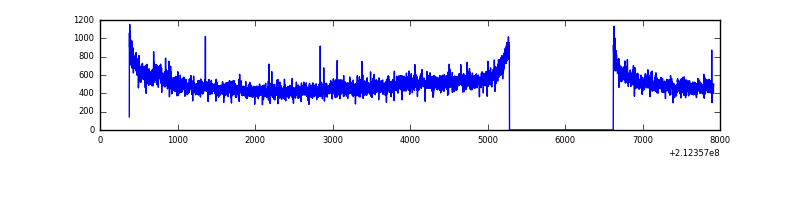 |
| D | 7540 | 6201 | 35 | 35 | 0.46% | 0.56% | 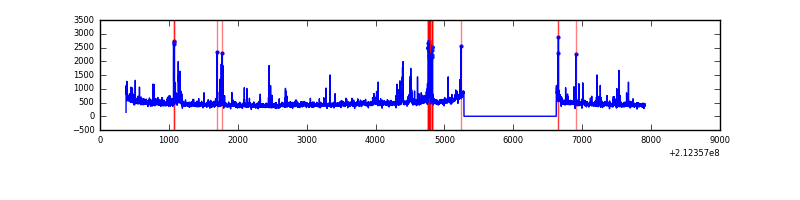 |
Top three noisy pixels from each quadrant. If the there are fewer than three noisy pixels in the level2.evt file, extra rows are filled as -1
| Pixel properties | Quadrant properties | ||||||
|---|---|---|---|---|---|---|---|
| Quadrant | DetID | PixID | Counts | Sigma | Mean | Median | Sigma |
| A | 0 | 50 | 264404 | 1737.34 | 749 | 734 | 151.8 |
| A | 15 | 174 | 120409 | 788.55 | 749 | 734 | 151.8 |
| A | 0 | 226 | 7350 | 43.59 | 749 | 734 | 151.8 |
| B | 10 | 16 | 512219 | 3536.79 | 766 | 753 | 144.6 |
| B | 4 | 80 | 135277 | 930.23 | 766 | 753 | 144.6 |
| B | 15 | 204 | 59971 | 409.49 | 766 | 753 | 144.6 |
| C | 1 | 16 | 207011 | 1215.38 | 735 | 741 | 169.7 |
| C | 14 | 67 | 20505 | 116.45 | 735 | 741 | 169.7 |
| C | 13 | 61 | 6119 | 31.69 | 735 | 741 | 169.7 |
| D | 4 | 95 | 108964 | 613.35 | 721 | 699 | 176.5 |
| D | 2 | 136 | 70264 | 394.11 | 721 | 699 | 176.5 |
| D | 12 | 233 | 47266 | 263.82 | 721 | 699 | 176.5 |
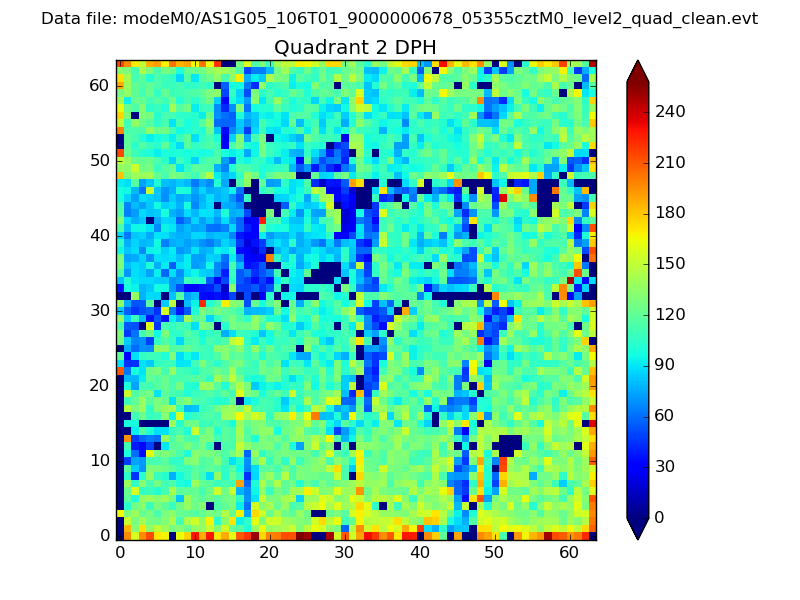
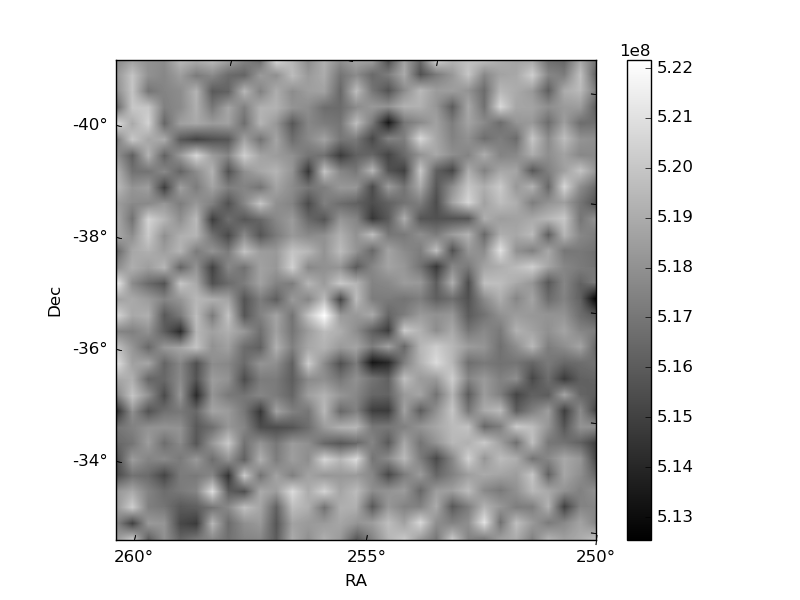
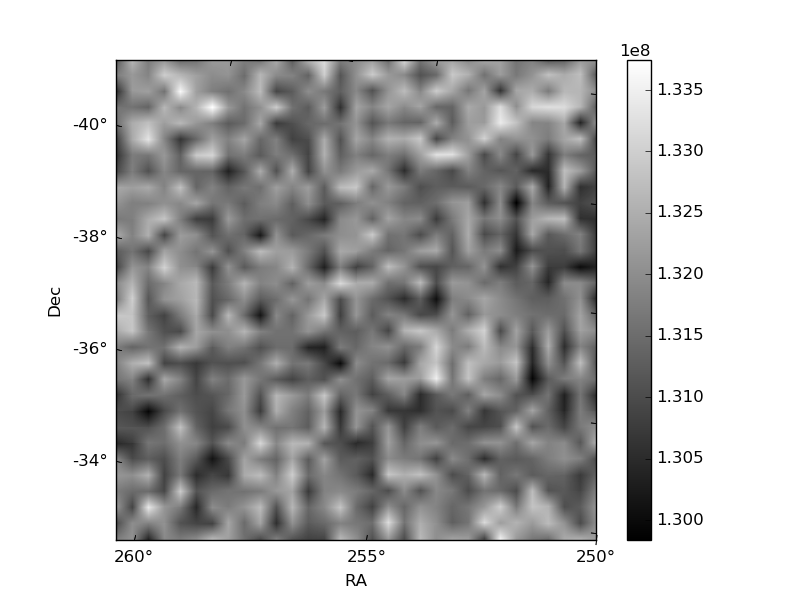
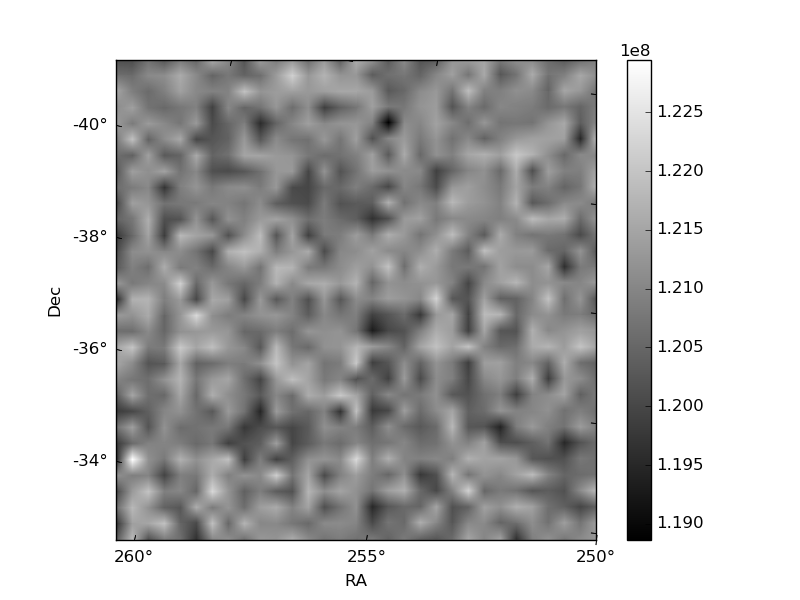
Histogram calculated using DETX and DETY for each event in the final _common_clean file
| Quadrant A | 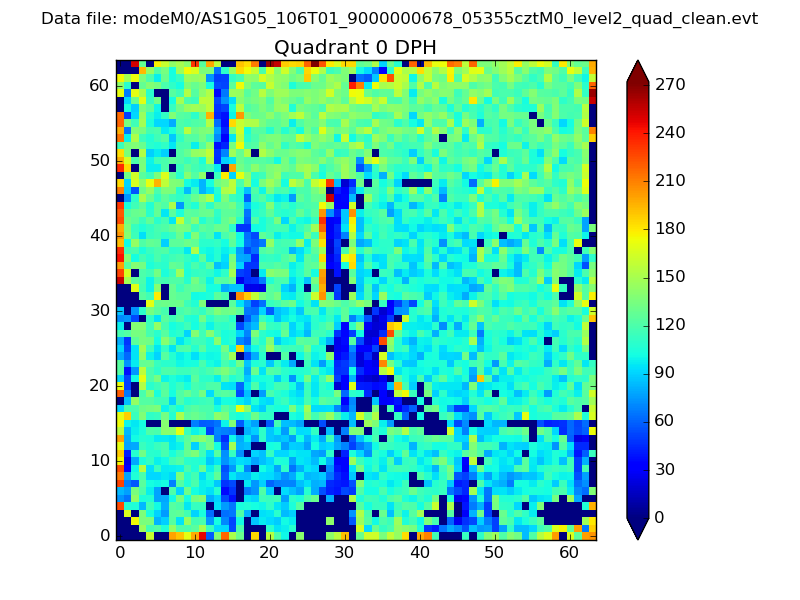 |
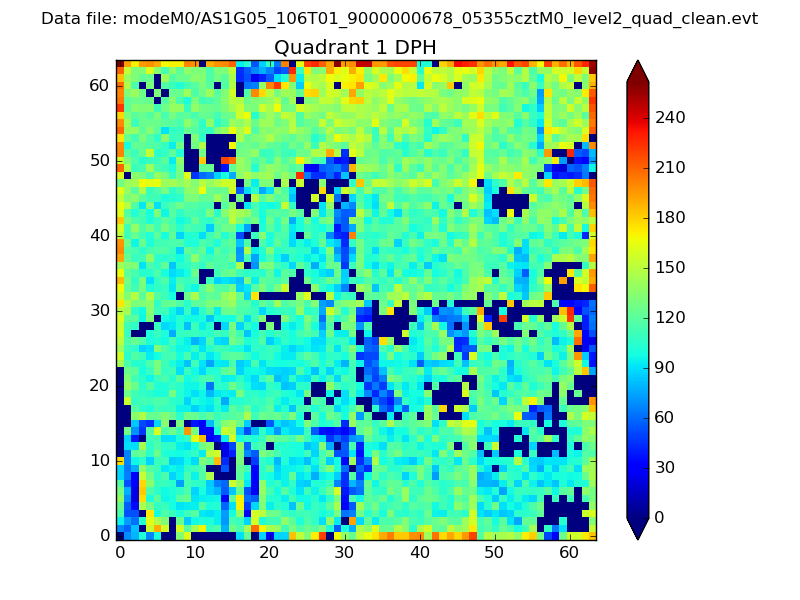 |
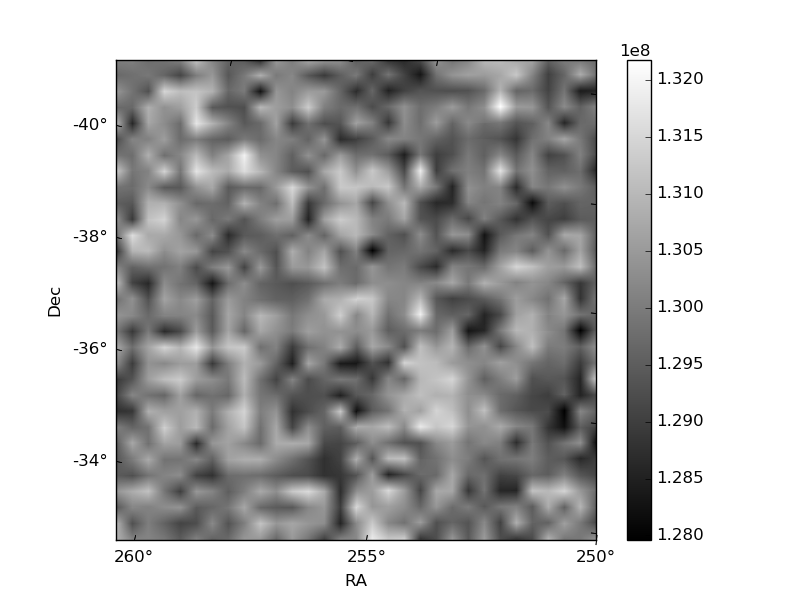
Quadrant B |
|---|---|---|---|
| Quadrant D | 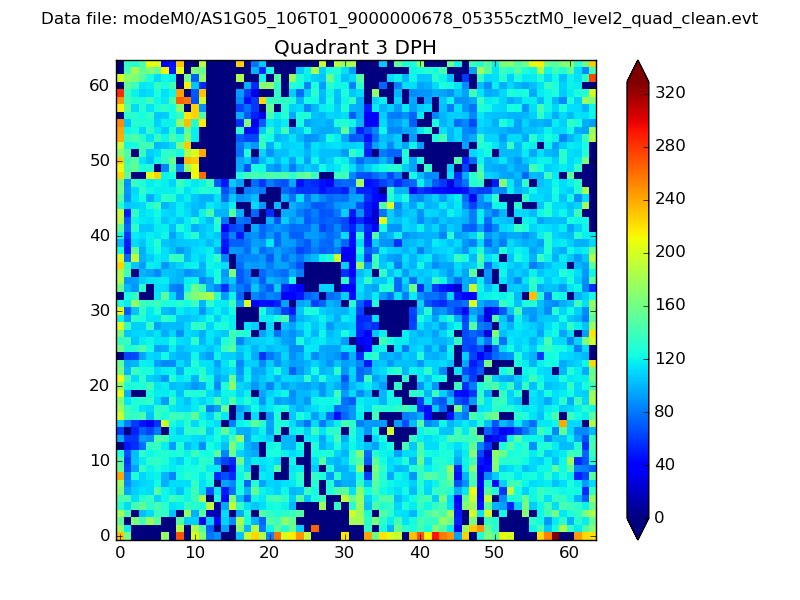 |
 |
Quadrant C |
| Plot type | Count rate plots | Images |
|---|---|---|
| Comparison with Poisson distribution Blue bars denote a histogram of data divided into 1 sec bins. Red curve is a Poisson curve with rate = median count rate of data. |
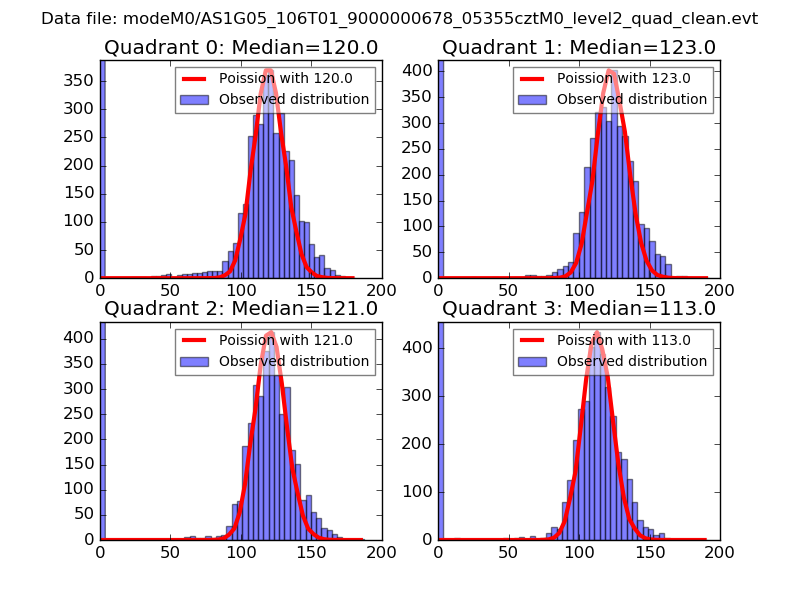 |
 |
| Quadrant-wise count rates Data is divided into 100 sec bins |
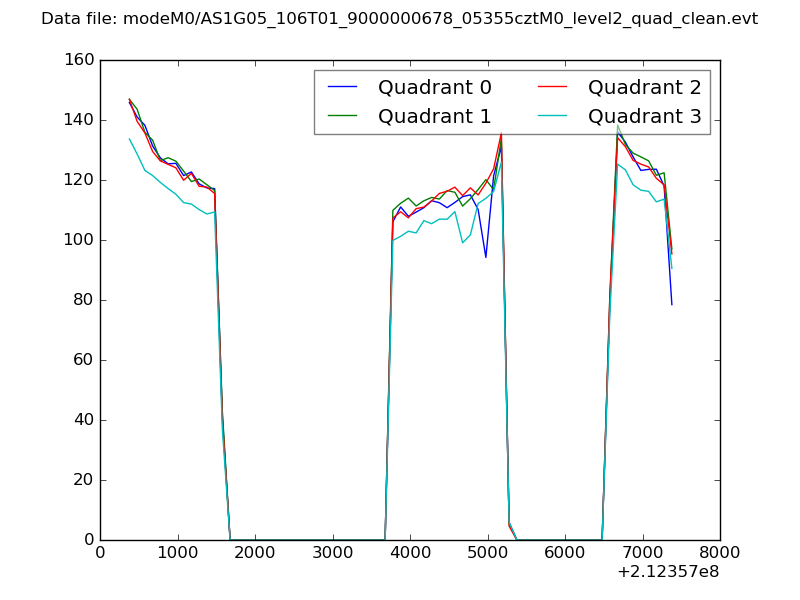 |
|
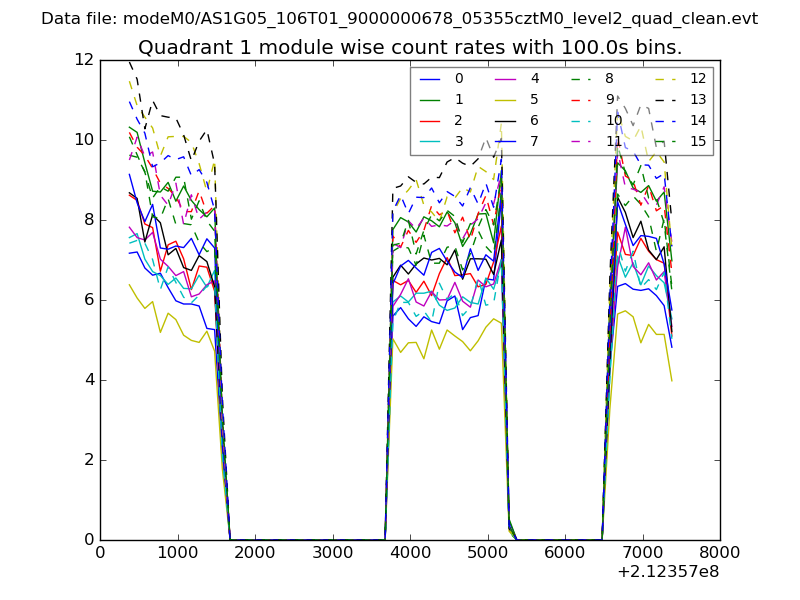
| Module-wise count rates for Quadrant A Data is divided into 100 sec bins |
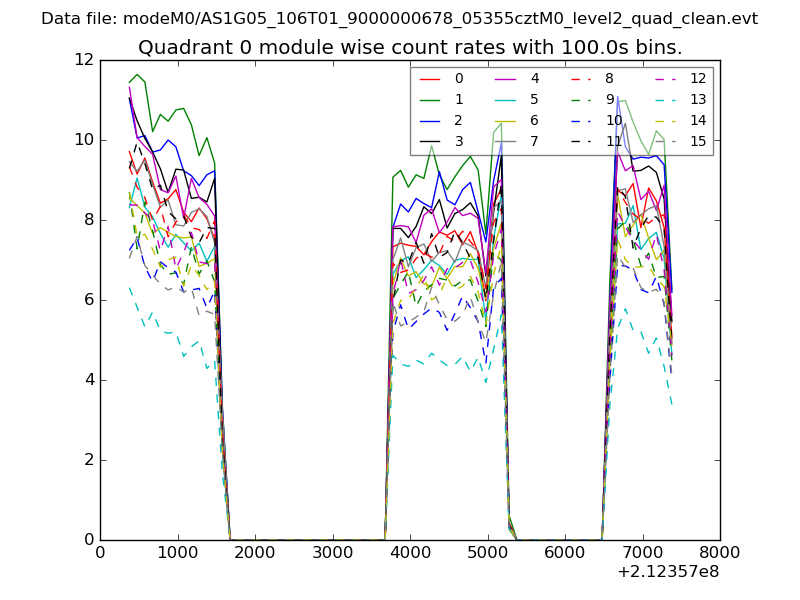 |
 |
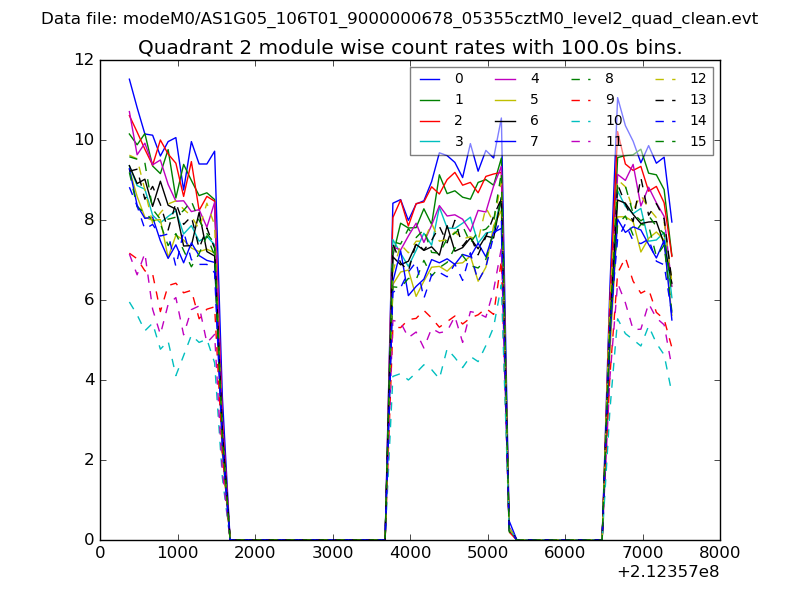
| Module-wise count rates for Quadrant B Data is divided into 100 sec bins |
 |
 |
| Module-wise count rates for Quadrant C Data is divided into 100 sec bins |
 |
 |
| Module-wise count rates for Quadrant D Data is divided into 100 sec bins |
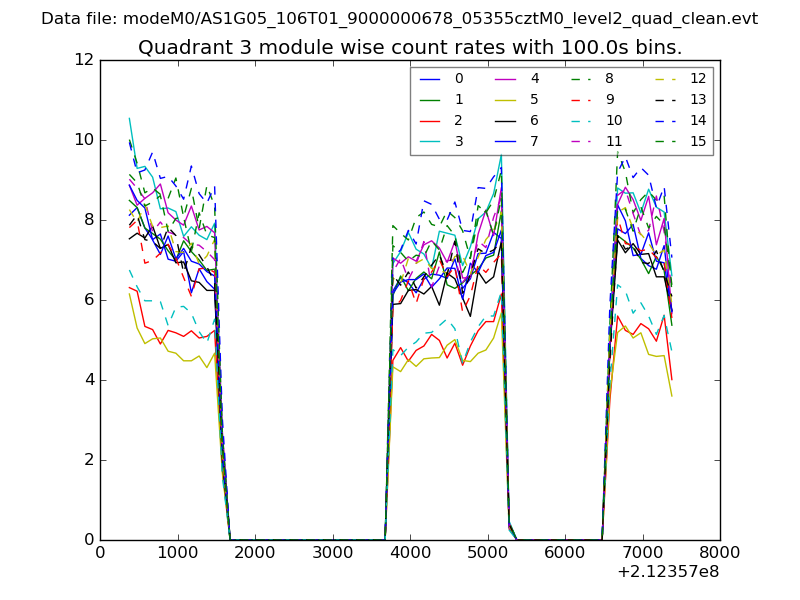 |
 |
| Parameter | Plot |
|---|---|
| CZT HV Monitor | 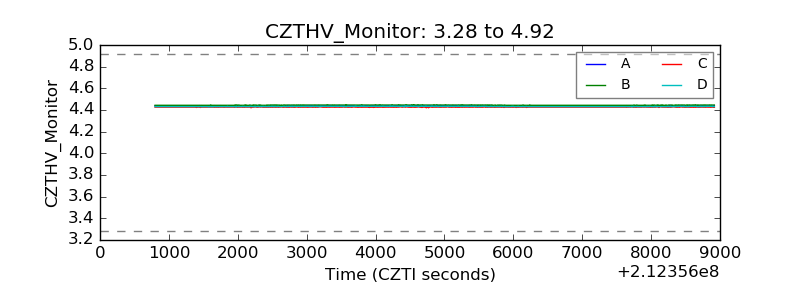 |
| D_VDD | 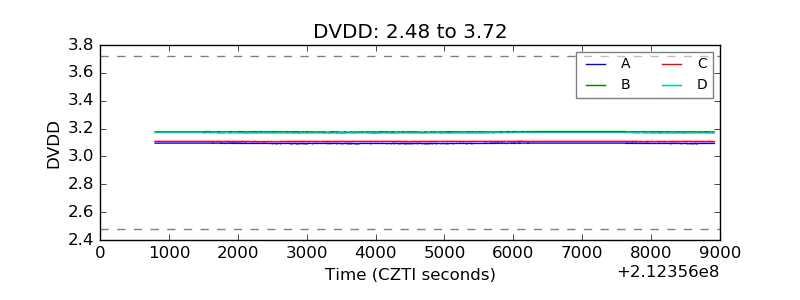 |
| Temperature 1 | 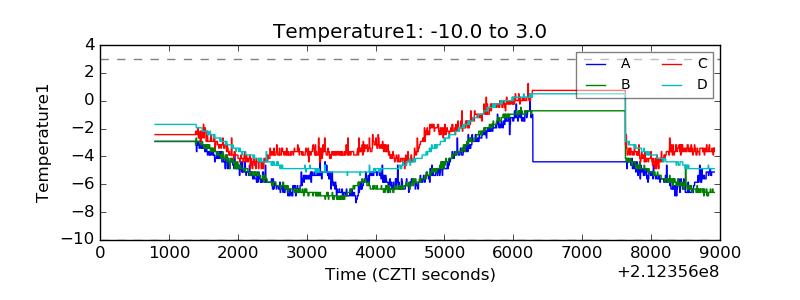 |
| Veto HV Monitor | 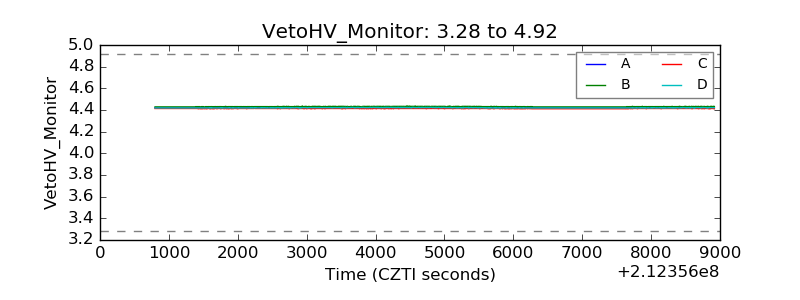 |
| Veto LLD | 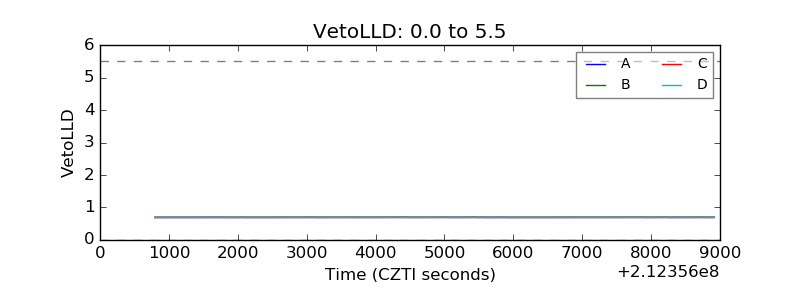 |
| Alpha Counter | 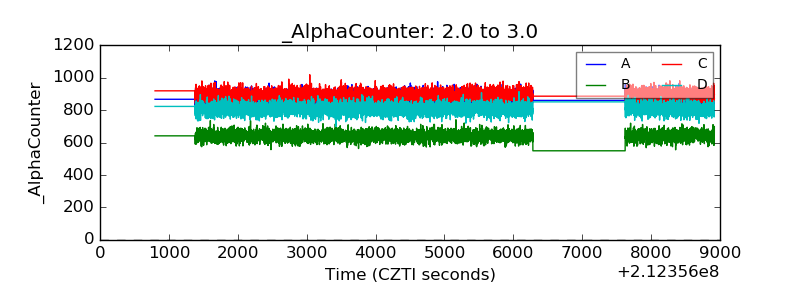 |
| _CPM_Rate | 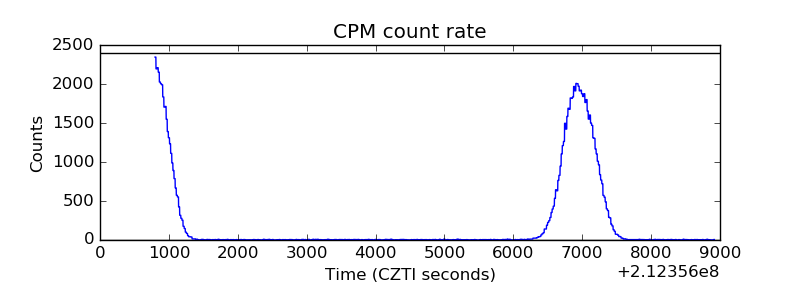 |
| CZT Counter | 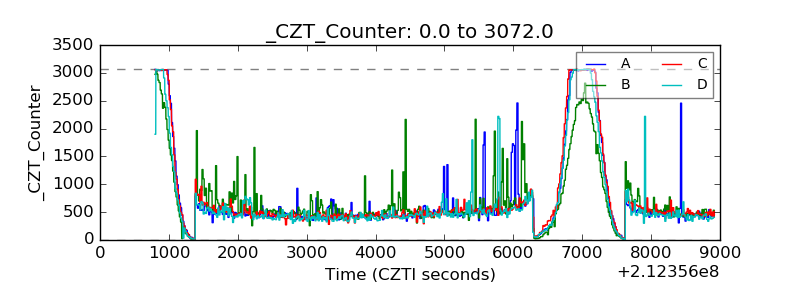 |
| +2.5 Volts monitor |  |
| +5 Volts monitor |  |
| _ROLL_ROT | 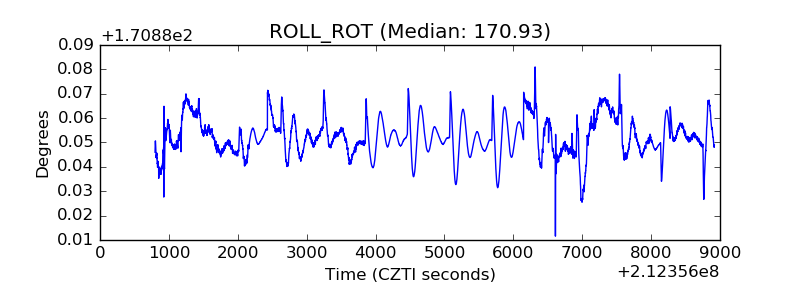 |
| _Roll_DEC | 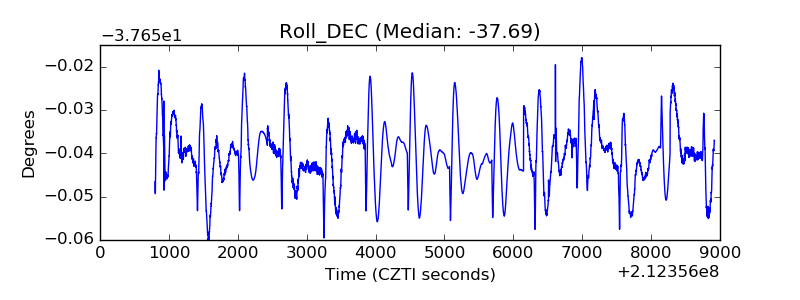 |
| _Roll_RA | 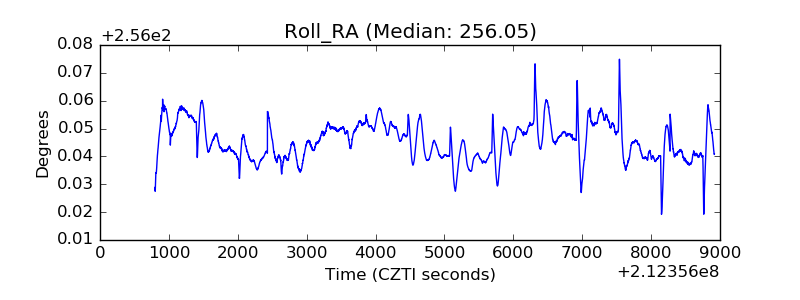 |
| Veto Counter | 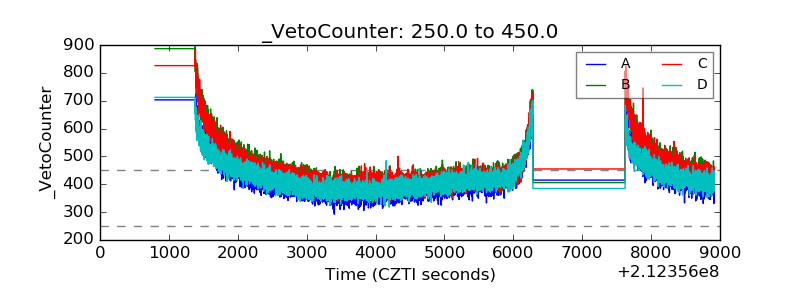 |