| Param | Original file | Final file |
|---|---|---|
| Filename | modeM0/AS1G05_106T01_9000000678_05356cztM0_level2.evt | modeM0/AS1G05_106T01_9000000678_05356cztM0_level2_quad_clean.evt |
| Size (bytes) | 483,356,160 | 63,308,160 |
| Size | 461.0 MB | 60.4 MB |
| Events in quadrant A | 3,370,759 | 379,242 |
| Events in quadrant B | 3,444,653 | 384,117 |
| Events in quadrant C | 3,126,668 | 381,840 |
| Events in quadrant D | 4,271,520 | 334,729 |
| Mode SS | |||
|---|---|---|---|
| Quadrant | BADHDUFLAG | Total packets | Discarded packets |
| A | 0 | 126 | 0 |
| B | 0 | 126 | 0 |
| C | 0 | 126 | 0 |
| D | 0 | 126 | 0 |
| Mode M0 | |||
|---|---|---|---|
| Quadrant | BADHDUFLAG | Total packets | Discarded packets |
| A | 0 | 14114 | 3 |
| B | 0 | 14272 | 2 |
| C | 0 | 13203 | 2 |
| D | 0 | 17084 | 2 |
| Mode M9 | |||
|---|---|---|---|
| Quadrant | BADHDUFLAG | Total packets | Discarded packets |
| A | 0 | 25 | 0 |
| B | 0 | 25 | 0 |
| C | 0 | 25 | 0 |
| D | 0 | 26 | 0 |
| Quadrant | Total seconds | Saturated seconds | Saturation percentage |
|---|---|---|---|
| A | 6260 | 179 | 2.859425% |
| B | 6260 | 65 | 1.038339% |
| C | 6260 | 19 | 0.303514% |
| D | 6260 | 471 | 7.523962% |
Noise dominated data is calculated using 1-second bins in cleaned event files. If a bin has >2000 counts, and if more than 50% of those come from <1% of pixels, then it is considered to be noise-dominated and hence unusable.
| Quadrant | # 1 sec bins | Bins with >0 counts | Bins with >2000 counts | High rate bins dominated by noise | Noise dominated (total time) | Noise dominated (detector-on time) | Marked lightcurve |
|---|---|---|---|---|---|---|---|
| A | 7555 | 6260 | 144 | 144 | 1.91% | 2.30% | 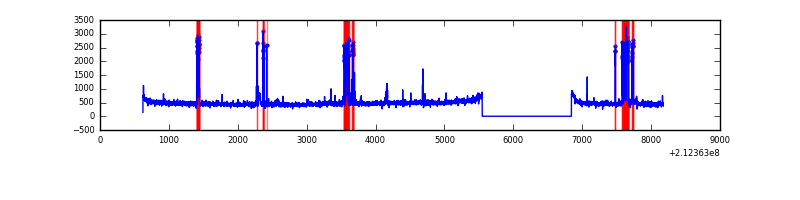 |
| B | 7555 | 6261 | 22 | 22 | 0.29% | 0.35% | 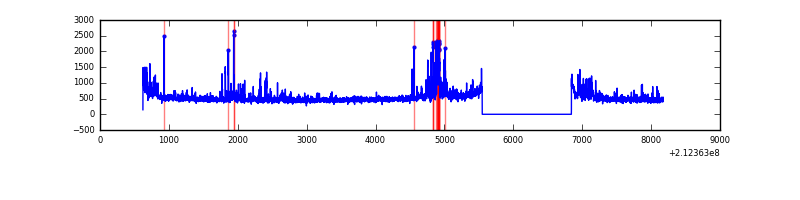 |
| C | 7555 | 6261 | 0 | 0 | 0.00% | 0.00% | 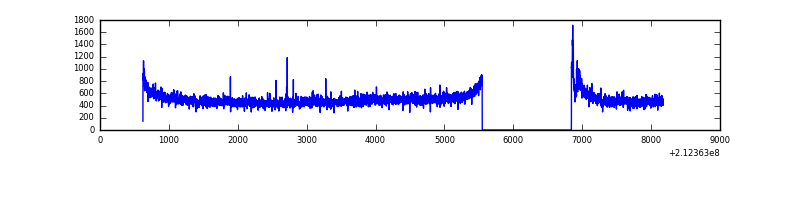 |
| D | 7555 | 6261 | 484 | 484 | 6.41% | 7.73% | 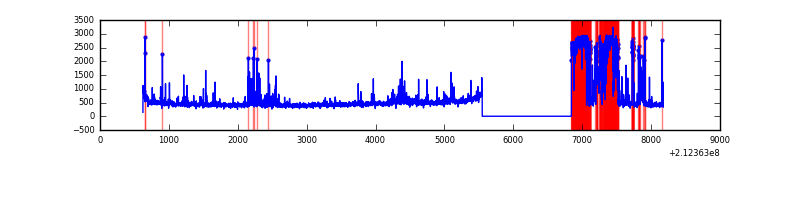 |
Top three noisy pixels from each quadrant. If the there are fewer than three noisy pixels in the level2.evt file, extra rows are filled as -1
| Pixel properties | Quadrant properties | ||||||
|---|---|---|---|---|---|---|---|
| Quadrant | DetID | PixID | Counts | Sigma | Mean | Median | Sigma |
| A | 15 | 174 | 403803 | 2652.81 | 747 | 732 | 151.9 |
| A | 0 | 50 | 90668 | 591.91 | 747 | 732 | 151.9 |
| A | 12 | 194 | 7573 | 45.02 | 747 | 732 | 151.9 |
| B | 4 | 80 | 135074 | 918.66 | 769 | 753 | 146.2 |
| B | 8 | 3 | 124443 | 845.96 | 769 | 753 | 146.2 |
| B | 4 | 81 | 69386 | 469.4 | 769 | 753 | 146.2 |
| C | 1 | 16 | 234338 | 1369.9 | 738 | 744 | 170.5 |
| C | 14 | 67 | 10503 | 57.23 | 738 | 744 | 170.5 |
| C | 13 | 61 | 6134 | 31.61 | 738 | 744 | 170.5 |
| D | 2 | 63 | 1394395 | 8209.14 | 691 | 669 | 169.8 |
| D | 12 | 233 | 98488 | 576.16 | 691 | 669 | 169.8 |
| D | 12 | 17 | 46230 | 268.36 | 691 | 669 | 169.8 |
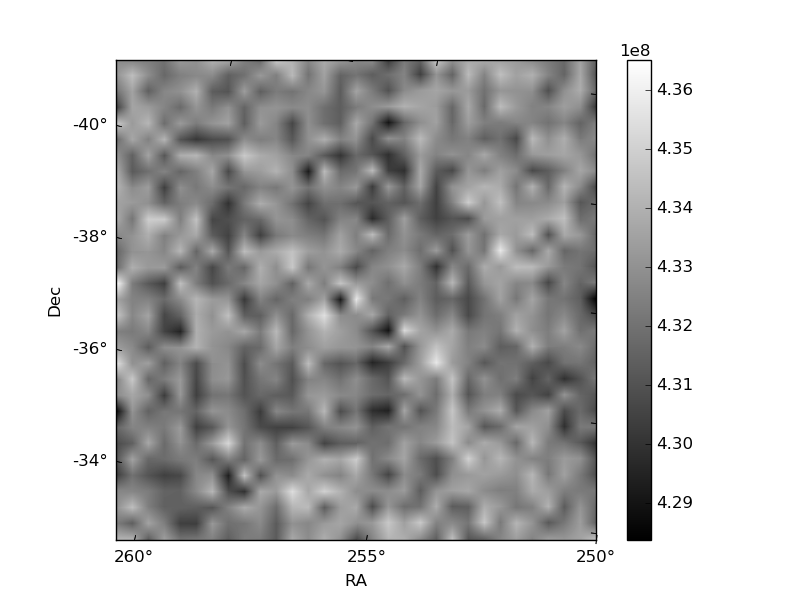
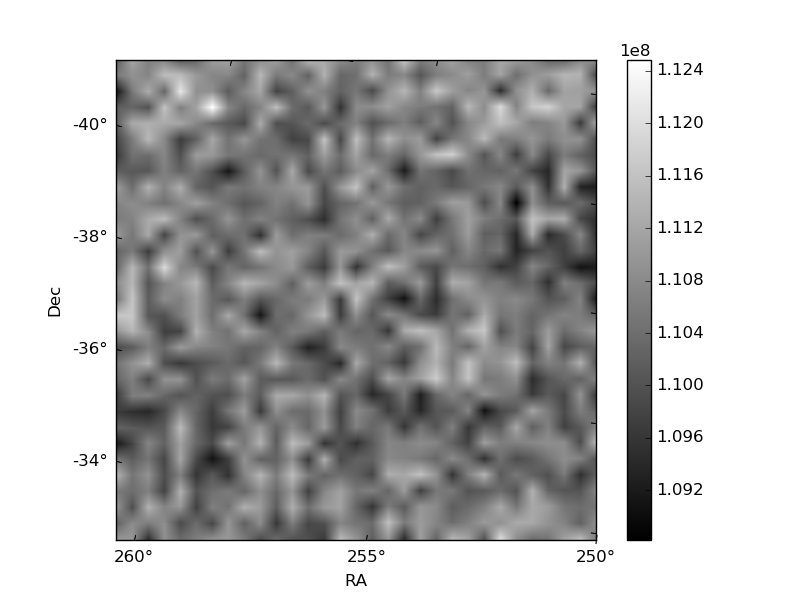
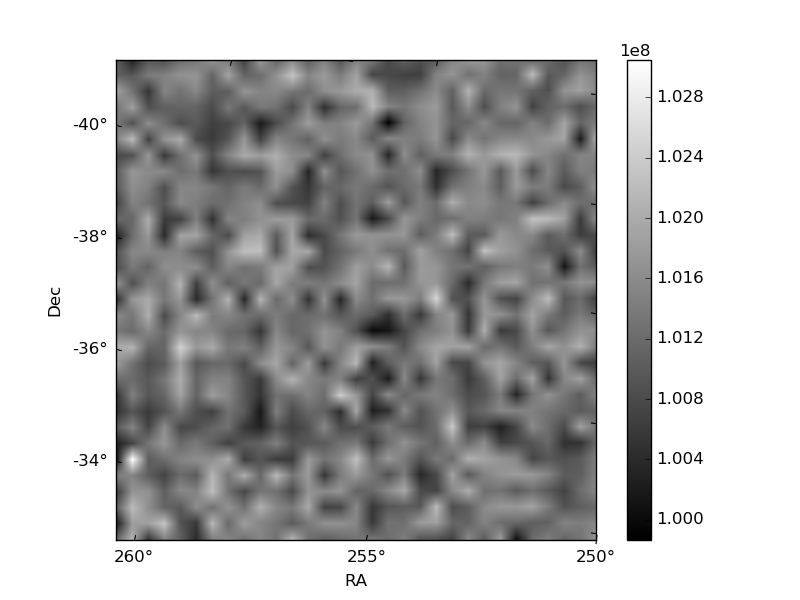
Histogram calculated using DETX and DETY for each event in the final _common_clean file
| Quadrant A | 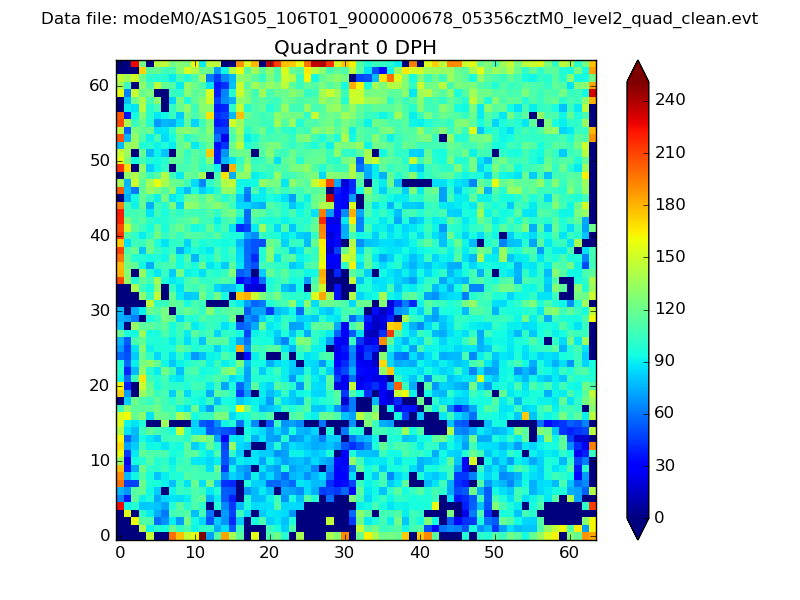 |
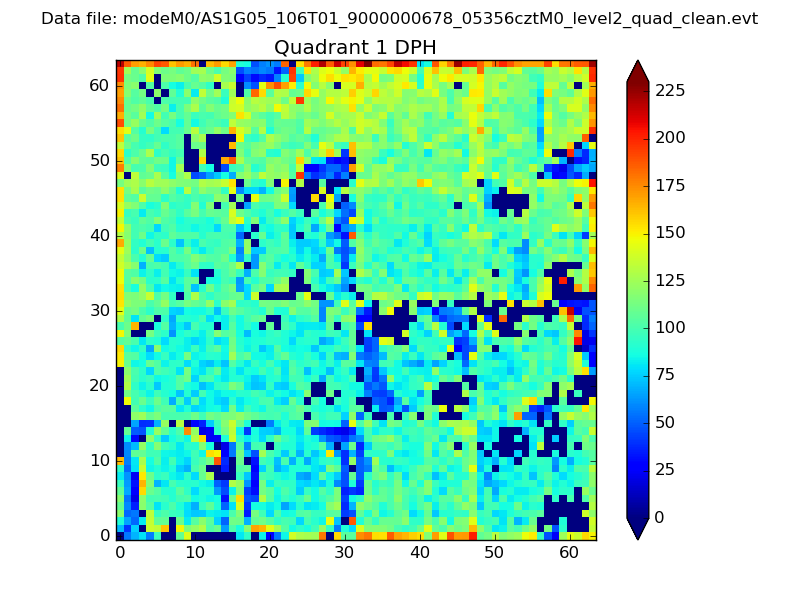 |
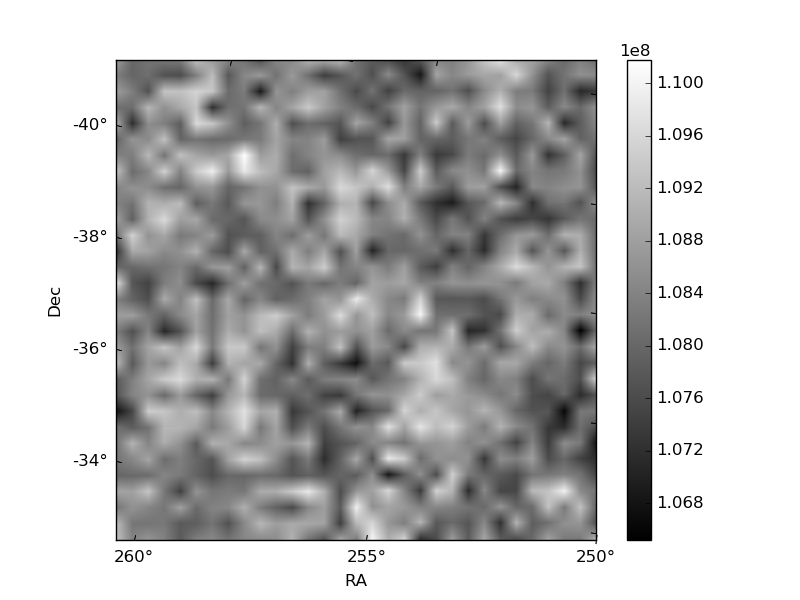
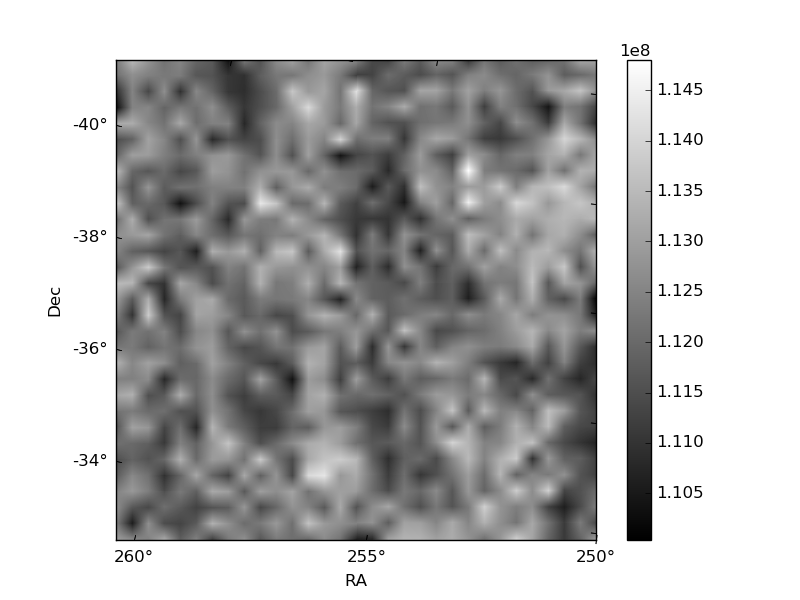
Quadrant B |
|---|---|---|---|
| Quadrant D | 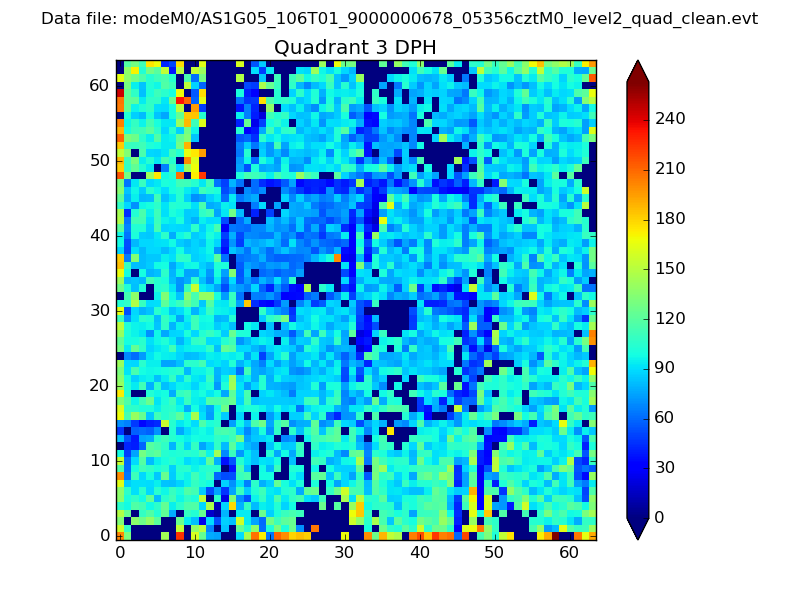 |
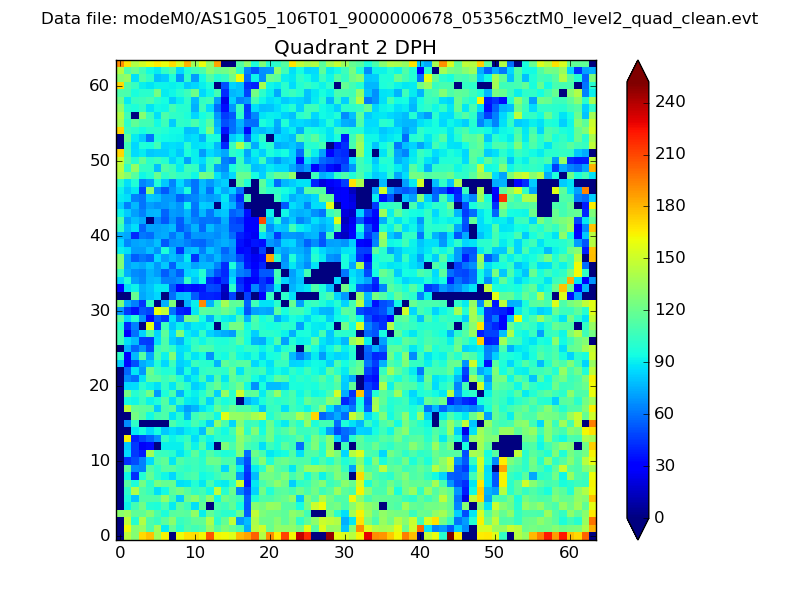 |
Quadrant C |
| Plot type | Count rate plots | Images |
|---|---|---|
| Comparison with Poisson distribution Blue bars denote a histogram of data divided into 1 sec bins. Red curve is a Poisson curve with rate = median count rate of data. |
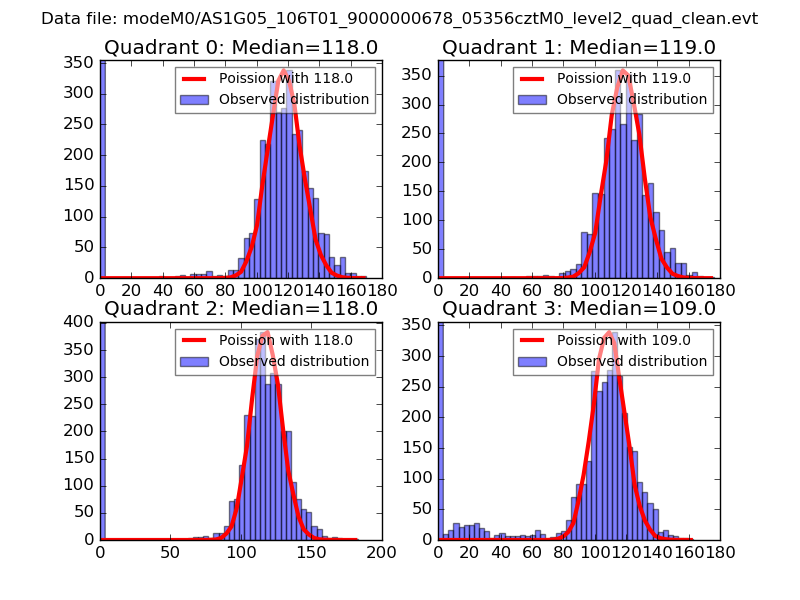 |
 |
| Quadrant-wise count rates Data is divided into 100 sec bins |
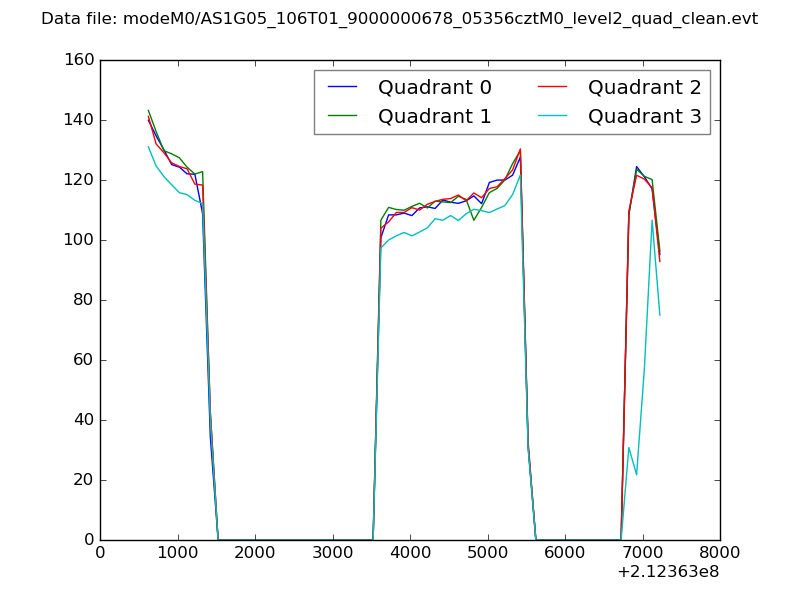 |
|
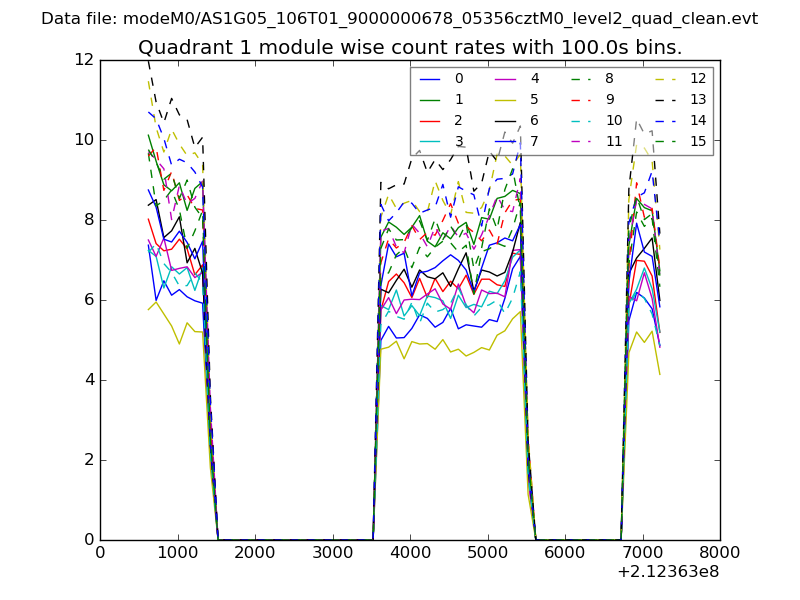
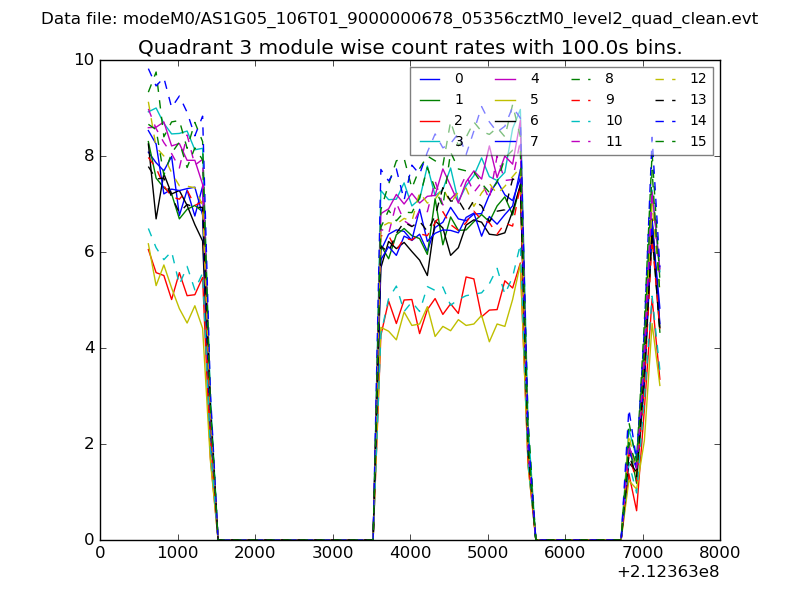
| Module-wise count rates for Quadrant A Data is divided into 100 sec bins |
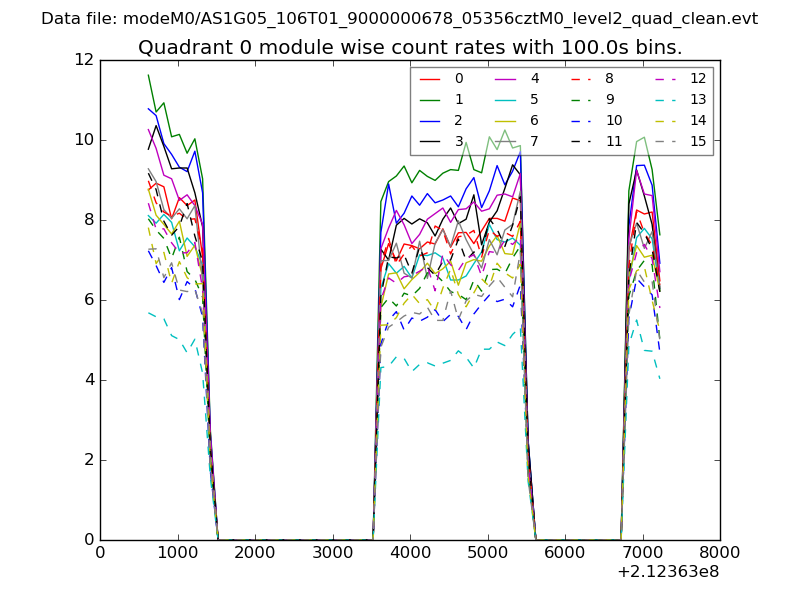 |
 |
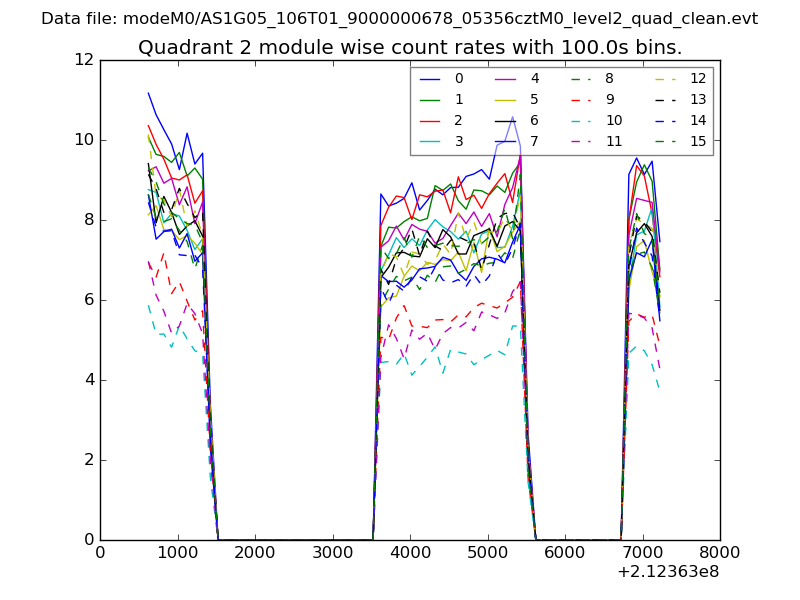
| Module-wise count rates for Quadrant B Data is divided into 100 sec bins |
 |
 |
| Module-wise count rates for Quadrant C Data is divided into 100 sec bins |
 |
 |
| Module-wise count rates for Quadrant D Data is divided into 100 sec bins |
 |
 |
| Parameter | Plot |
|---|---|
| CZT HV Monitor | 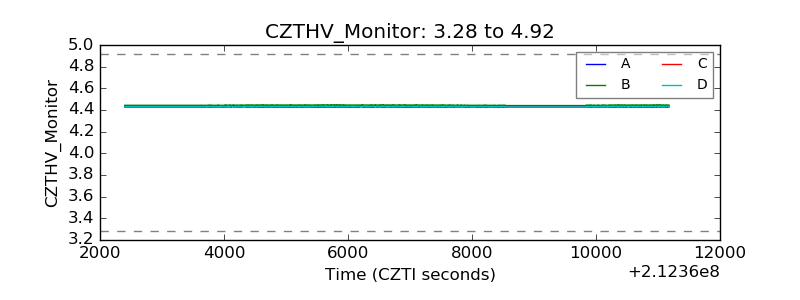 |
| D_VDD | 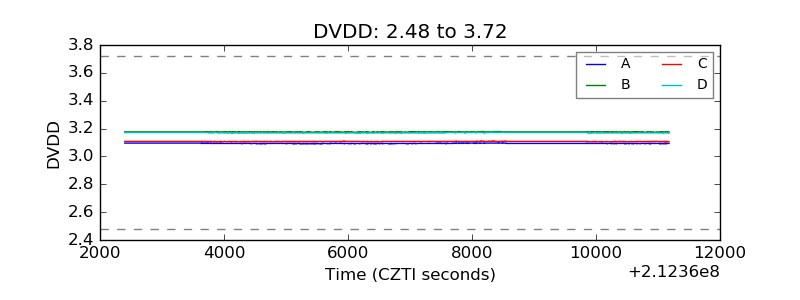 |
| Temperature 1 | 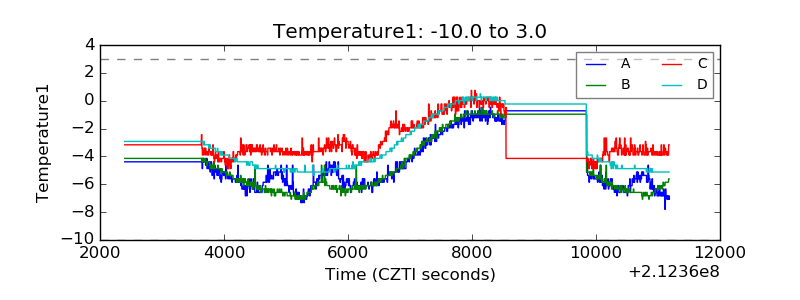 |
| Veto HV Monitor | 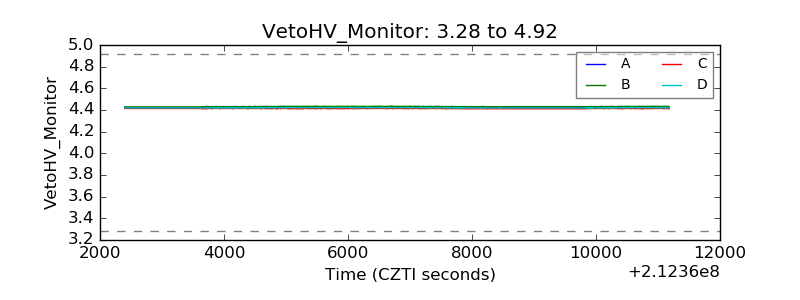 |
| Veto LLD | 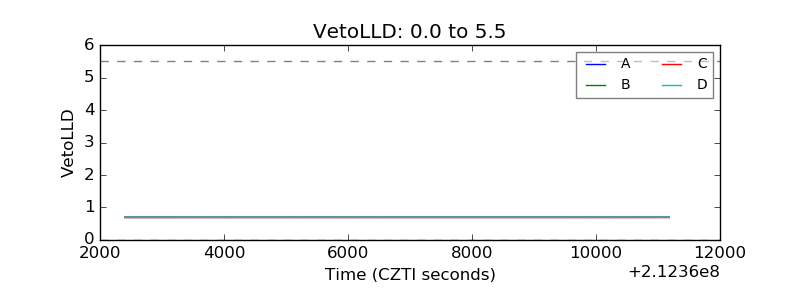 |
| Alpha Counter | 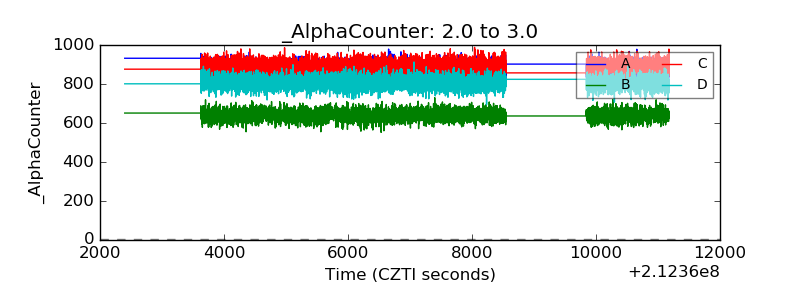 |
| _CPM_Rate | 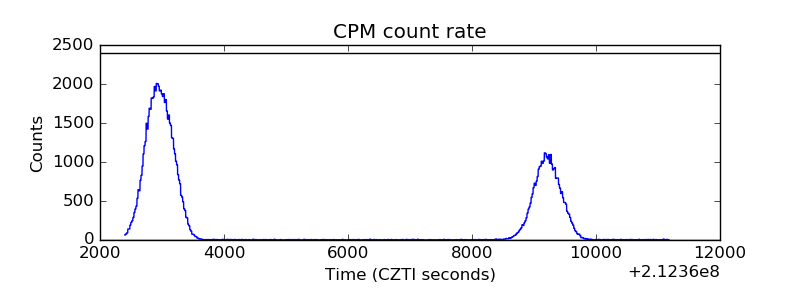 |
| CZT Counter | 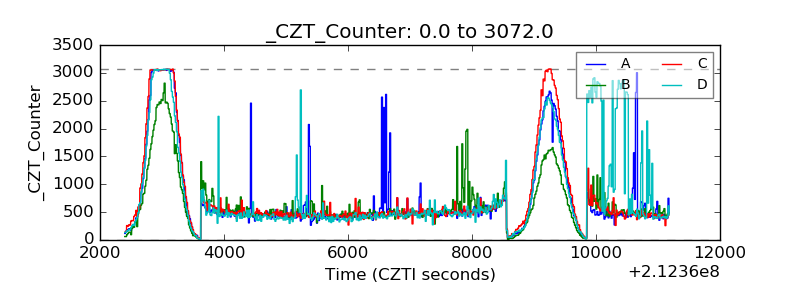 |
| +2.5 Volts monitor |  |
| +5 Volts monitor |  |
| _ROLL_ROT | 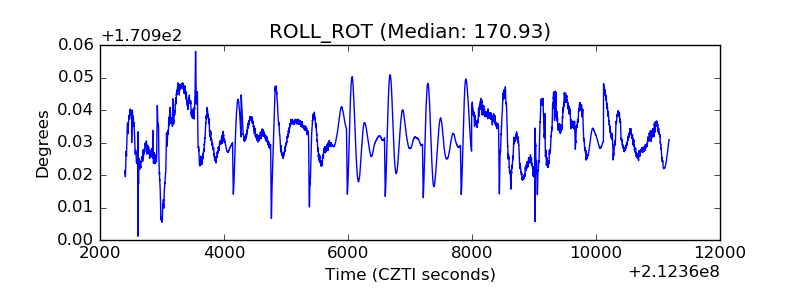 |
| _Roll_DEC | 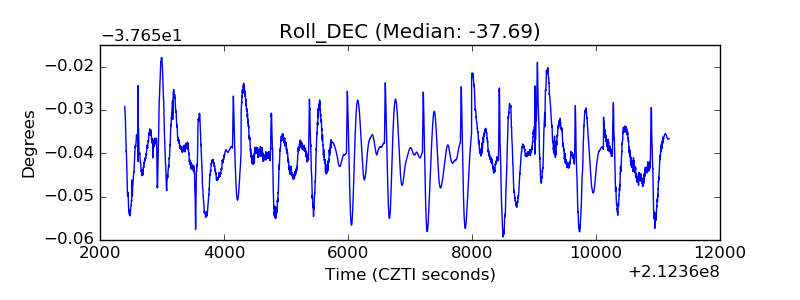 |
| _Roll_RA | 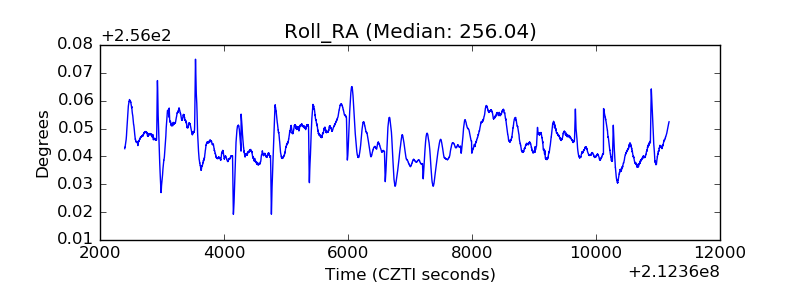 |
| Veto Counter | 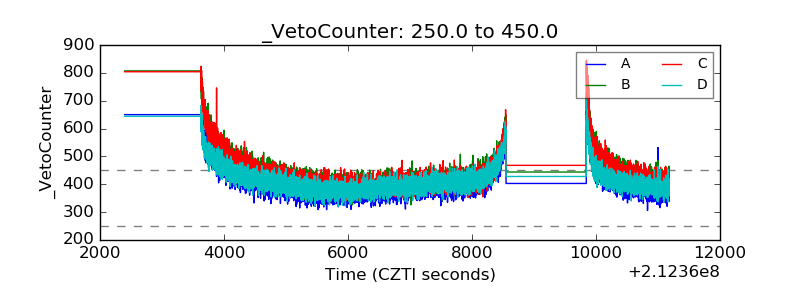 |