| Param | Original file | Final file |
|---|---|---|
| Filename | modeM0/AS1G05_106T01_9000000678_05359cztM0_level2.evt | modeM0/AS1G05_106T01_9000000678_05359cztM0_level2_quad_clean.evt |
| Size (bytes) | 586,560,960 | 80,112,960 |
| Size | 559.4 MB | 76.4 MB |
| Events in quadrant A | 4,284,752 | 465,816 |
| Events in quadrant B | 4,770,096 | 462,526 |
| Events in quadrant C | 3,950,812 | 467,714 |
| Events in quadrant D | 4,187,228 | 445,567 |
| Mode SS | |||
|---|---|---|---|
| Quadrant | BADHDUFLAG | Total packets | Discarded packets |
| A | 0 | 172 | 0 |
| B | 0 | 172 | 0 |
| C | 0 | 172 | 0 |
| D | 0 | 172 | 0 |
| Mode M0 | |||
|---|---|---|---|
| Quadrant | BADHDUFLAG | Total packets | Discarded packets |
| A | 0 | 18665 | 3 |
| B | 0 | 19641 | 2 |
| C | 0 | 17768 | 4 |
| D | 0 | 18542 | 2 |
| Mode M9 | |||
|---|---|---|---|
| Quadrant | BADHDUFLAG | Total packets | Discarded packets |
| A | 0 | 10 | 0 |
| B | 0 | 10 | 0 |
| C | 0 | 10 | 0 |
| D | 0 | 10 | 0 |
| Quadrant | Total seconds | Saturated seconds | Saturation percentage |
|---|---|---|---|
| A | 8423 | 453 | 5.378131% |
| B | 8423 | 453 | 5.378131% |
| C | 8422 | 314 | 3.728331% |
| D | 8423 | 353 | 4.190906% |
Noise dominated data is calculated using 1-second bins in cleaned event files. If a bin has >2000 counts, and if more than 50% of those come from <1% of pixels, then it is considered to be noise-dominated and hence unusable.
| Quadrant | # 1 sec bins | Bins with >0 counts | Bins with >2000 counts | High rate bins dominated by noise | Noise dominated (total time) | Noise dominated (detector-on time) | Marked lightcurve |
|---|---|---|---|---|---|---|---|
| A | 9183 | 8424 | 59 | 59 | 0.64% | 0.70% | 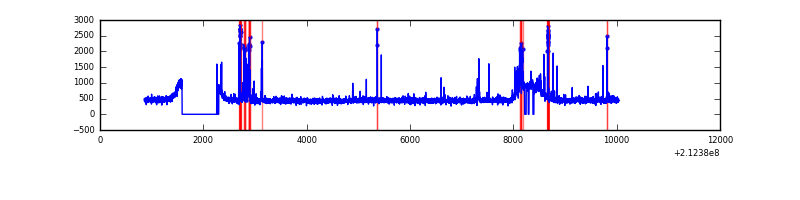 |
| B | 9183 | 8424 | 65 | 65 | 0.71% | 0.77% | 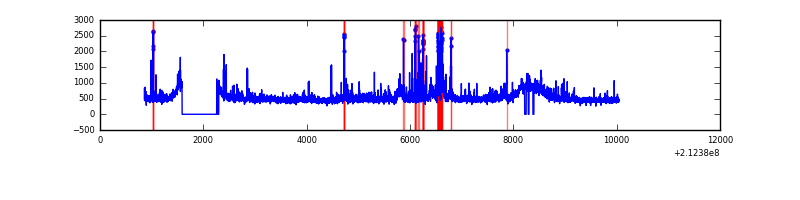 |
| C | 9183 | 8424 | 0 | 0 | 0.00% | 0.00% | 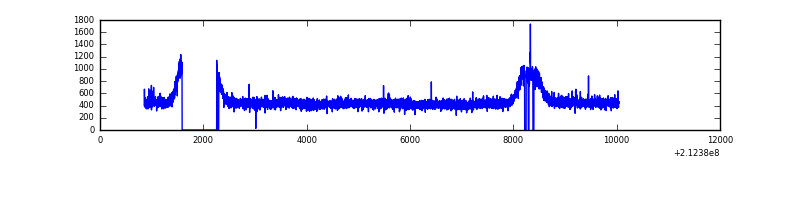 |
| D | 9183 | 8424 | 47 | 47 | 0.51% | 0.56% | 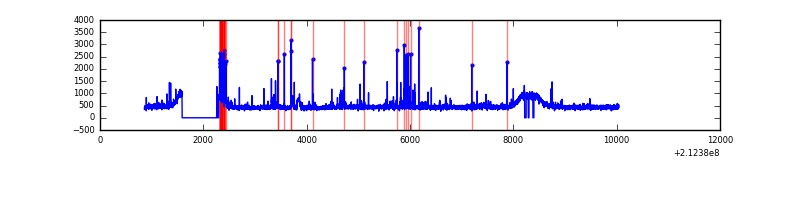 |
Top three noisy pixels from each quadrant. If the there are fewer than three noisy pixels in the level2.evt file, extra rows are filled as -1
| Pixel properties | Quadrant properties | ||||||
|---|---|---|---|---|---|---|---|
| Quadrant | DetID | PixID | Counts | Sigma | Mean | Median | Sigma |
| A | 15 | 174 | 265696 | 1257.21 | 1011 | 985 | 210.6 |
| A | 0 | 50 | 113209 | 532.99 | 1011 | 985 | 210.6 |
| A | 14 | 111 | 17883 | 80.25 | 1011 | 985 | 210.6 |
| B | 14 | 167 | 311575 | 1541.69 | 1030 | 1004 | 201.4 |
| B | 15 | 204 | 171275 | 845.24 | 1030 | 1004 | 201.4 |
| B | 4 | 80 | 97326 | 478.15 | 1030 | 1004 | 201.4 |
| C | 1 | 16 | 41516 | 173.26 | 996 | 1001 | 233.8 |
| C | 13 | 61 | 8299 | 31.21 | 996 | 1001 | 233.8 |
| C | 14 | 67 | 8016 | 30.0 | 996 | 1001 | 233.8 |
| D | 4 | 95 | 117109 | 473.43 | 992 | 961 | 245.3 |
| D | 8 | 195 | 110132 | 444.99 | 992 | 961 | 245.3 |
| D | 2 | 14 | 76232 | 306.81 | 992 | 961 | 245.3 |
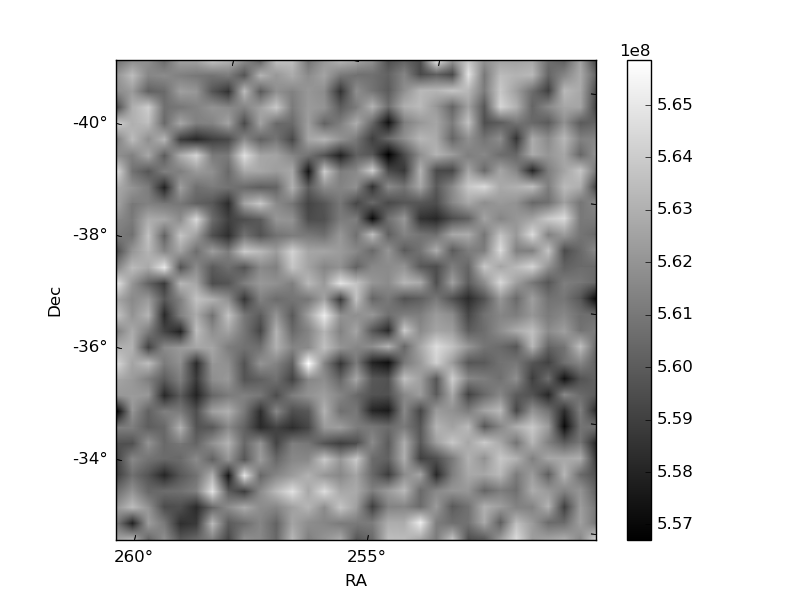
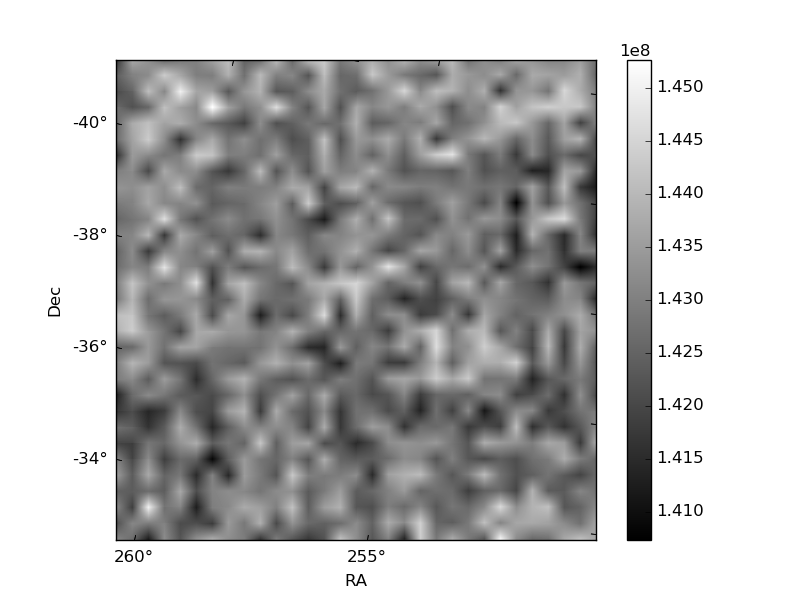
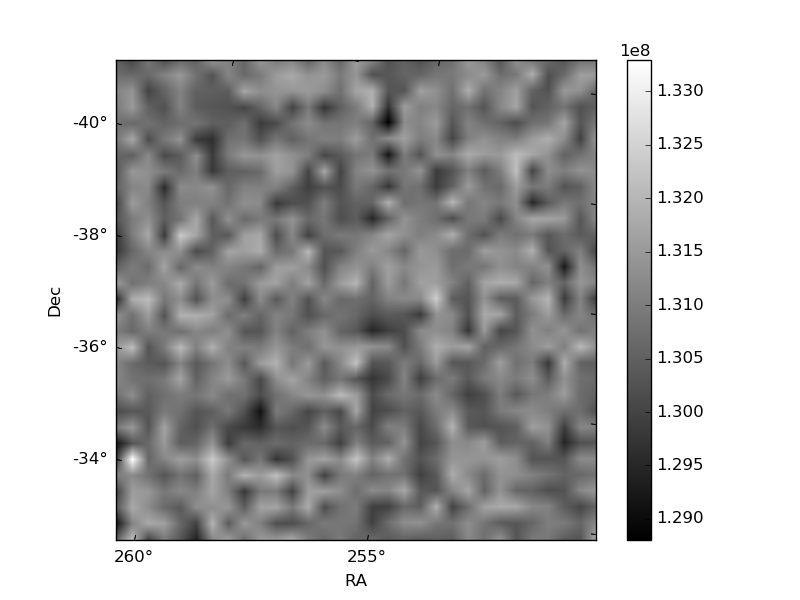
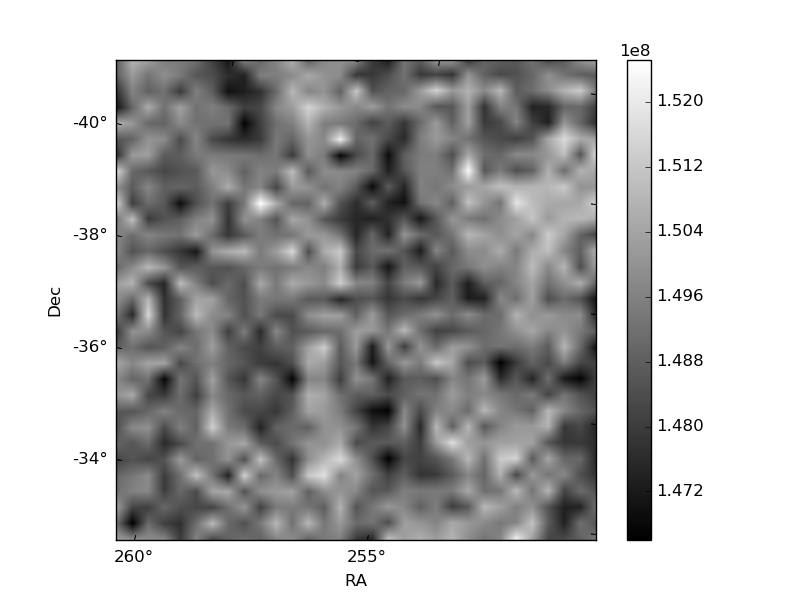
Histogram calculated using DETX and DETY for each event in the final _common_clean file
| Quadrant A | 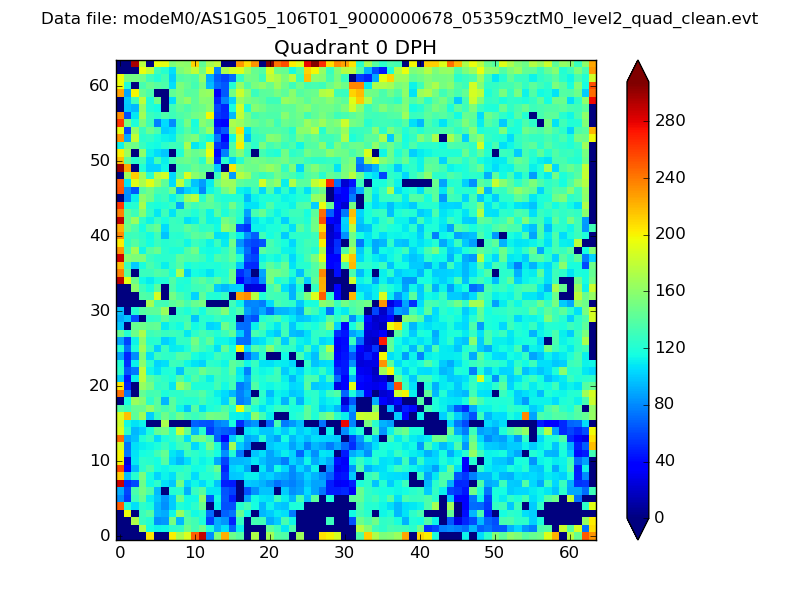 |
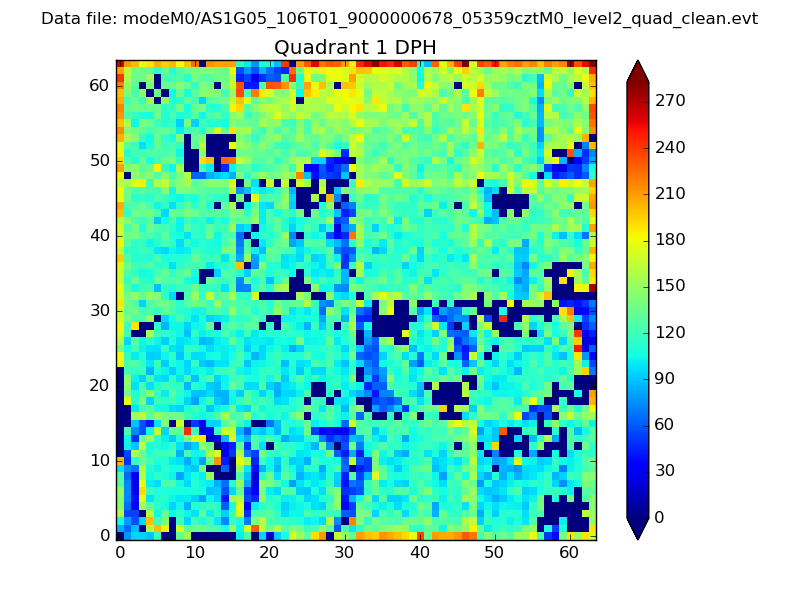 |
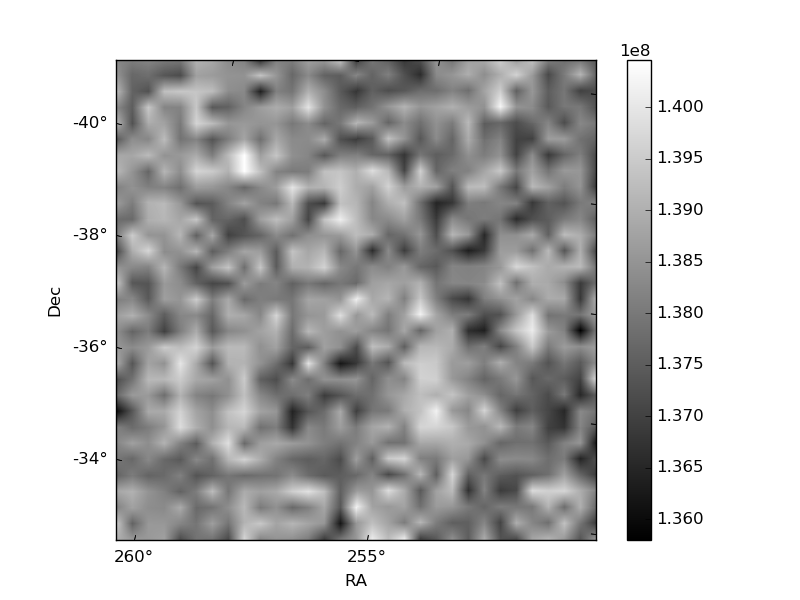
Quadrant B |
|---|---|---|---|
| Quadrant D | 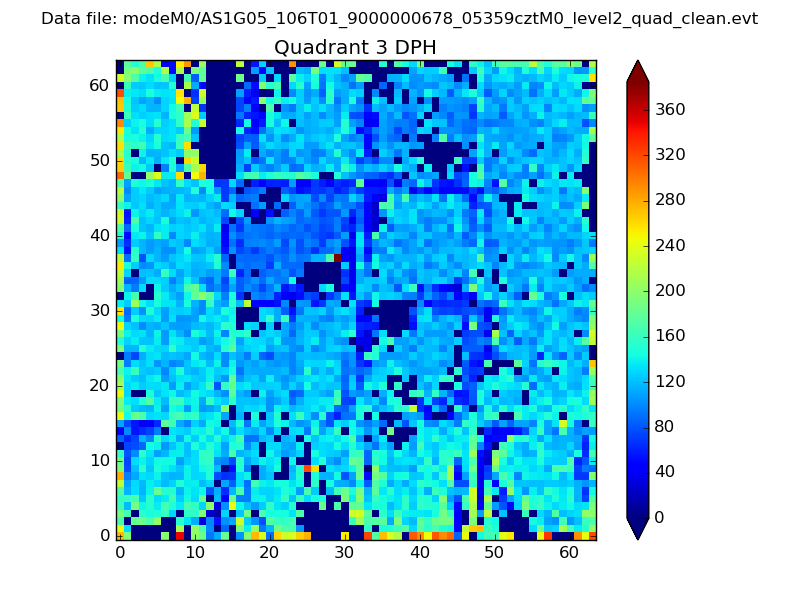 |
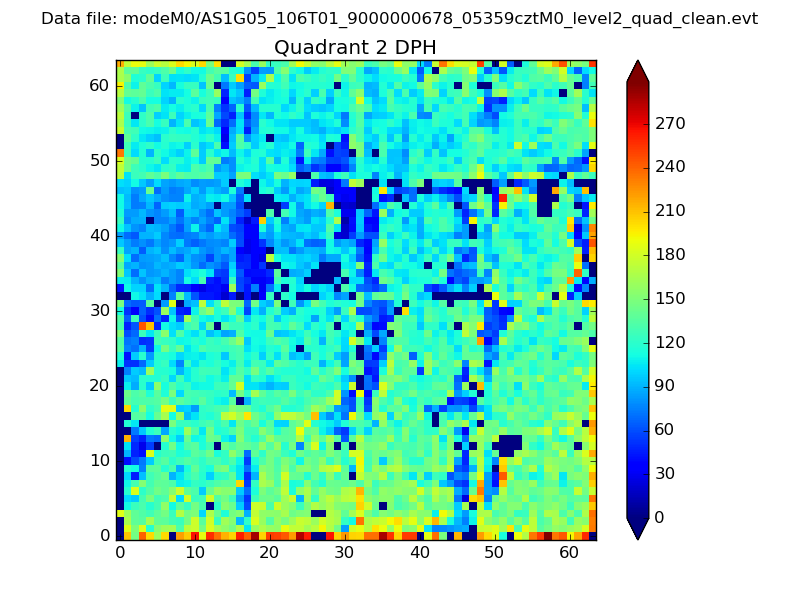 |
Quadrant C |
| Plot type | Count rate plots | Images |
|---|---|---|
| Comparison with Poisson distribution Blue bars denote a histogram of data divided into 1 sec bins. Red curve is a Poisson curve with rate = median count rate of data. |
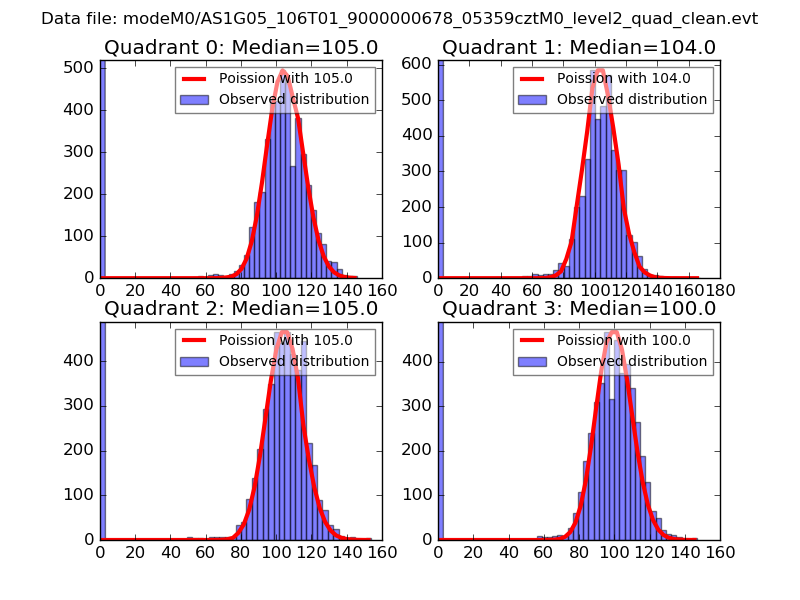 |
 |
| Quadrant-wise count rates Data is divided into 100 sec bins |
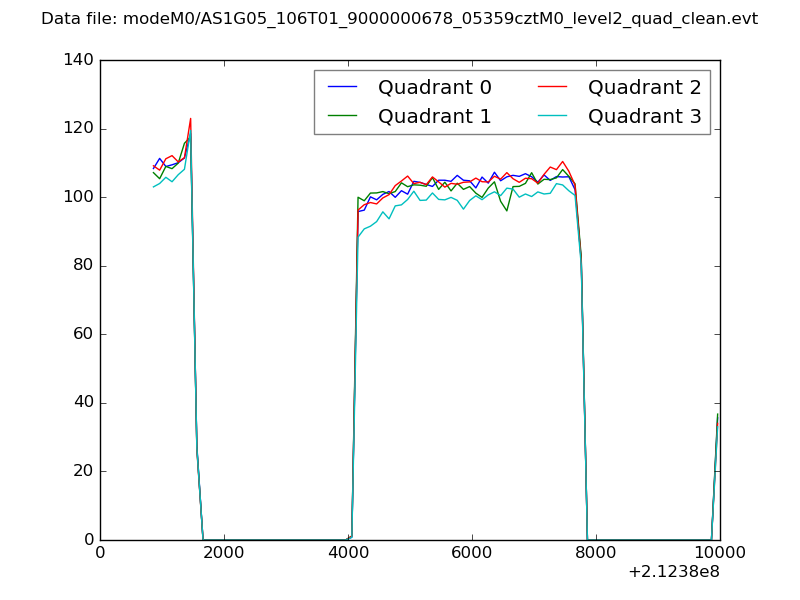 |
|
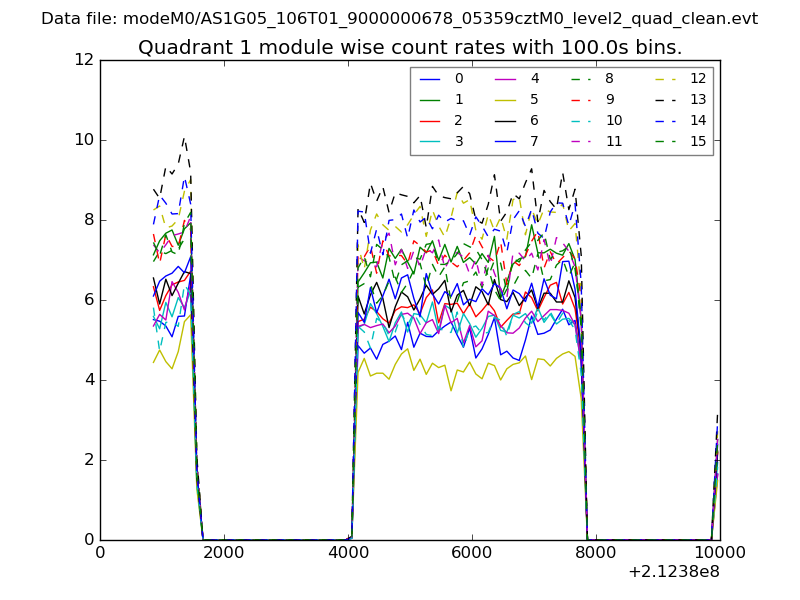
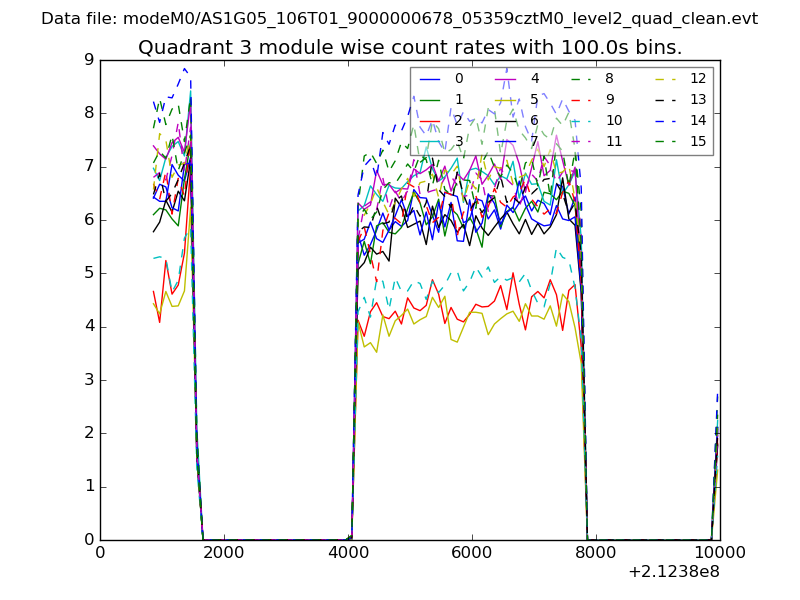
| Module-wise count rates for Quadrant A Data is divided into 100 sec bins |
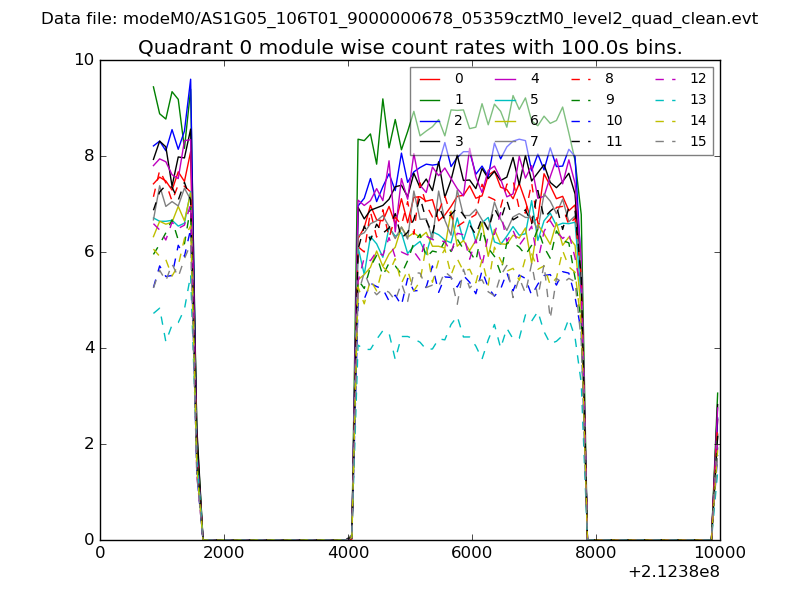 |
 |
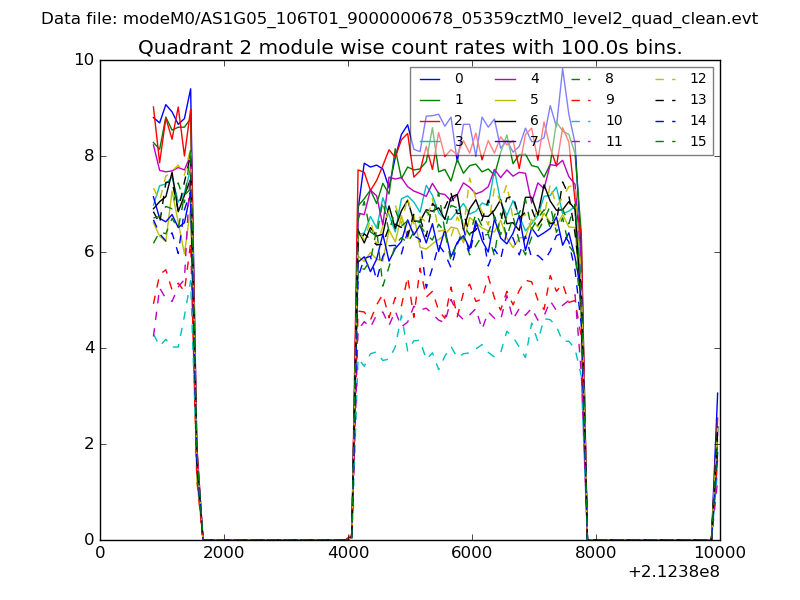
| Module-wise count rates for Quadrant B Data is divided into 100 sec bins |
 |
 |
| Module-wise count rates for Quadrant C Data is divided into 100 sec bins |
 |
 |
| Module-wise count rates for Quadrant D Data is divided into 100 sec bins |
 |
 |
| Parameter | Plot |
|---|---|
| CZT HV Monitor | 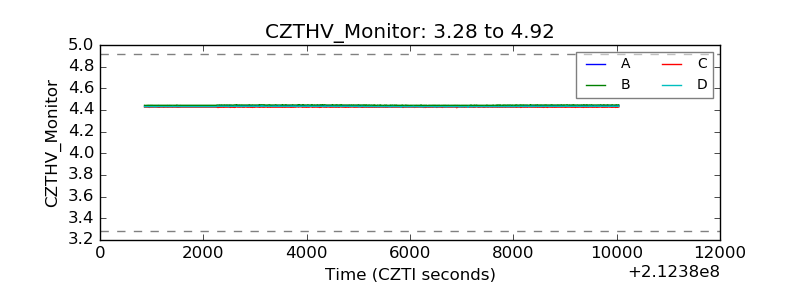 |
| D_VDD | 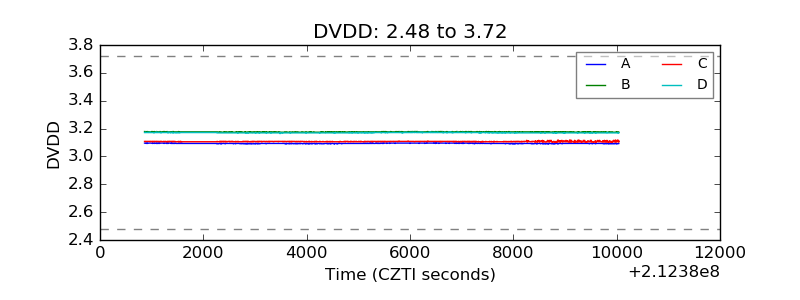 |
| Temperature 1 | 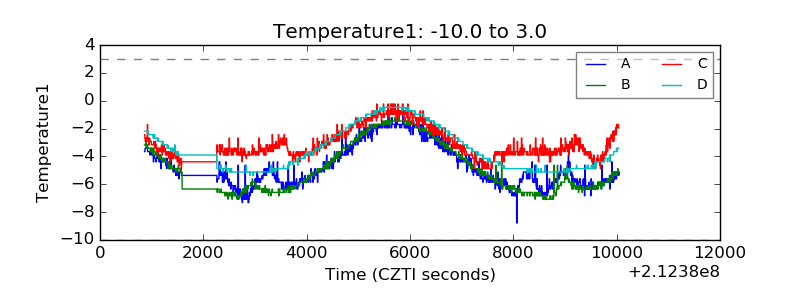 |
| Veto HV Monitor |  |
| Veto LLD |  |
| Alpha Counter | 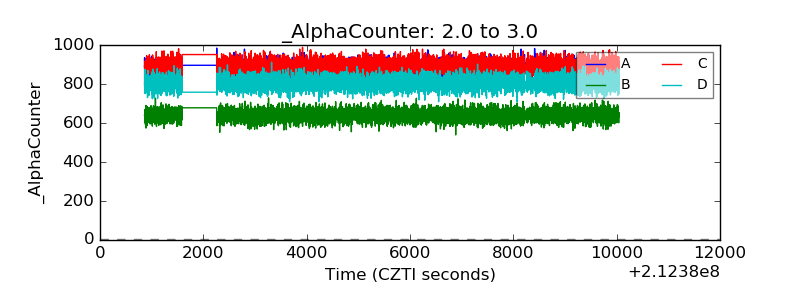 |
| _CPM_Rate | 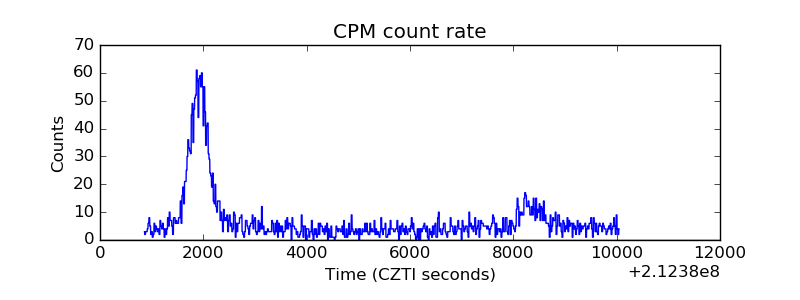 |
| CZT Counter | 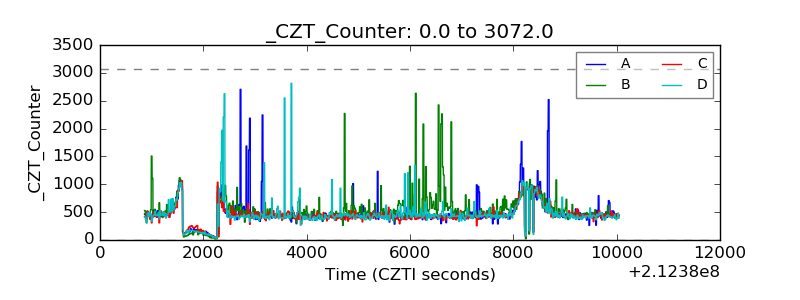 |
| +2.5 Volts monitor |  |
| +5 Volts monitor |  |
| _ROLL_ROT | 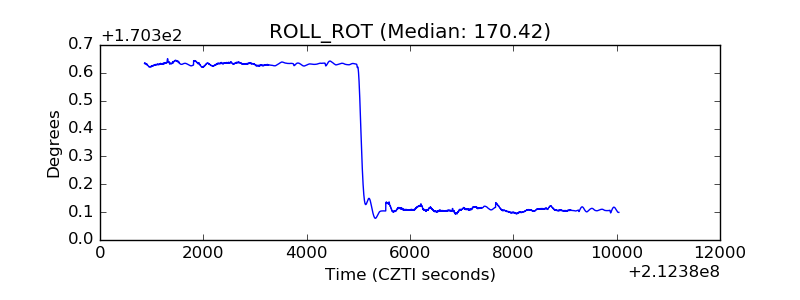 |
| _Roll_DEC | 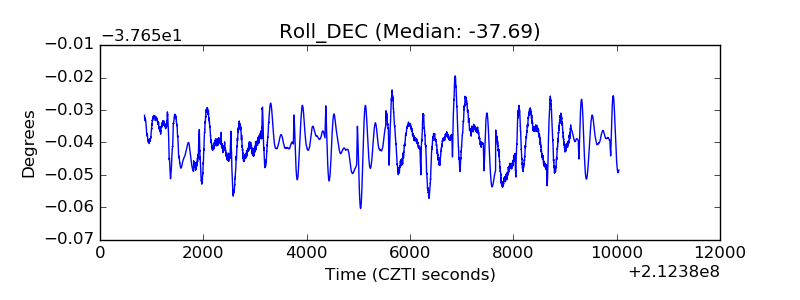 |
| _Roll_RA | 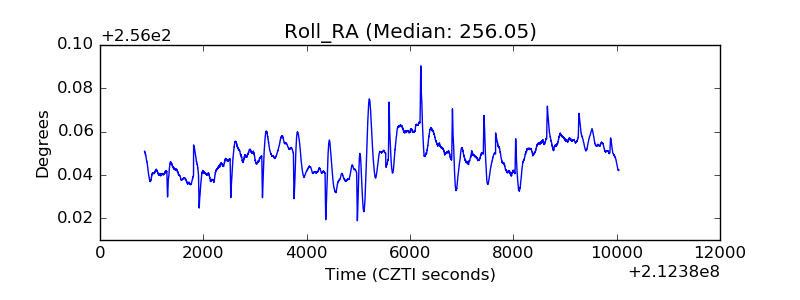 |
| Veto Counter | 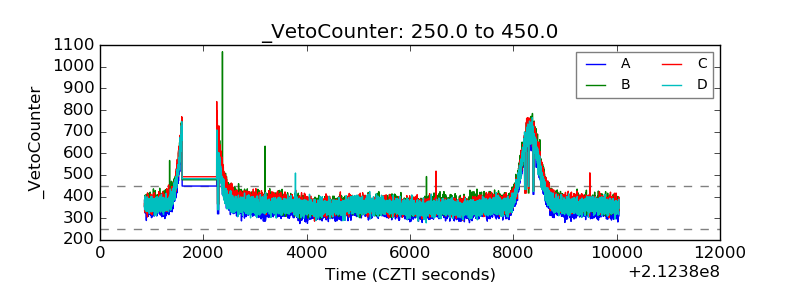 |