| Param | Original file | Final file |
|---|---|---|
| Filename | modeM0/AS1G05_106T01_9000000678_05360cztM0_level2.evt | modeM0/AS1G05_106T01_9000000678_05360cztM0_level2_quad_clean.evt |
| Size (bytes) | 591,949,440 | 75,386,880 |
| Size | 564.5 MB | 71.9 MB |
| Events in quadrant A | 4,301,578 | 427,946 |
| Events in quadrant B | 4,708,932 | 427,620 |
| Events in quadrant C | 4,045,126 | 428,346 |
| Events in quadrant D | 4,295,953 | 410,068 |
| Mode SS | |||
|---|---|---|---|
| Quadrant | BADHDUFLAG | Total packets | Discarded packets |
| A | 0 | 170 | 0 |
| B | 0 | 170 | 0 |
| C | 0 | 170 | 0 |
| D | 0 | 170 | 0 |
| Mode M0 | |||
|---|---|---|---|
| Quadrant | BADHDUFLAG | Total packets | Discarded packets |
| A | 0 | 18729 | 2 |
| B | 0 | 19616 | 1 |
| C | 0 | 18016 | 1 |
| D | 0 | 18630 | 7 |
| Mode M9 | |||
|---|---|---|---|
| Quadrant | BADHDUFLAG | Total packets | Discarded packets |
| A | 0 | 2 | 0 |
| B | 0 | 2 | 0 |
| C | 0 | 2 | 0 |
| D | 0 | 2 | 0 |
| Quadrant | Total seconds | Saturated seconds | Saturation percentage |
|---|---|---|---|
| A | 8486 | 609 | 7.176526% |
| B | 8486 | 529 | 6.233797% |
| C | 8486 | 378 | 4.454395% |
| D | 8483 | 422 | 4.974655% |
Noise dominated data is calculated using 1-second bins in cleaned event files. If a bin has >2000 counts, and if more than 50% of those come from <1% of pixels, then it is considered to be noise-dominated and hence unusable.
| Quadrant | # 1 sec bins | Bins with >0 counts | Bins with >2000 counts | High rate bins dominated by noise | Noise dominated (total time) | Noise dominated (detector-on time) | Marked lightcurve |
|---|---|---|---|---|---|---|---|
| A | 8551 | 8486 | 53 | 53 | 0.62% | 0.62% | 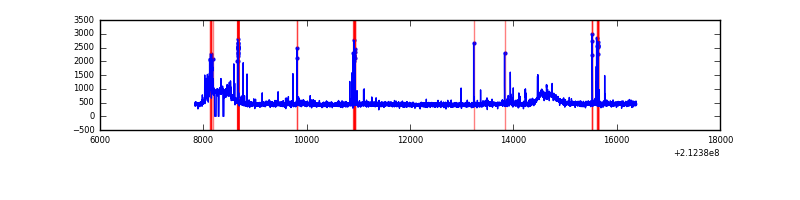 |
| B | 8551 | 8486 | 25 | 25 | 0.29% | 0.29% | 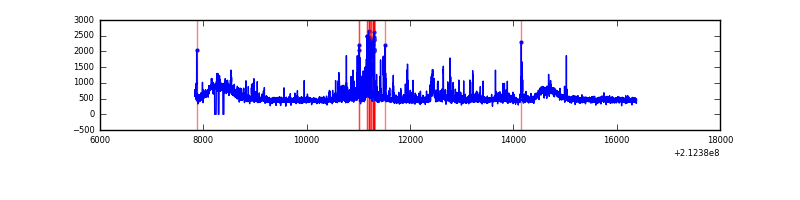 |
| C | 8551 | 8486 | 0 | 0 | 0.00% | 0.00% | 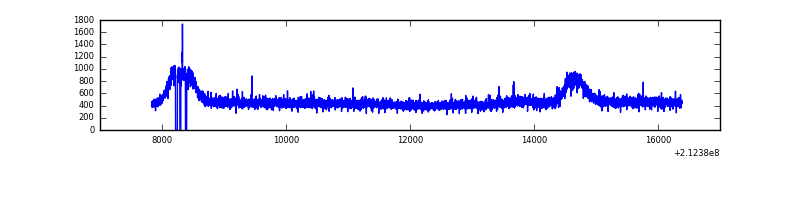 |
| D | 8551 | 8486 | 23 | 23 | 0.27% | 0.27% | 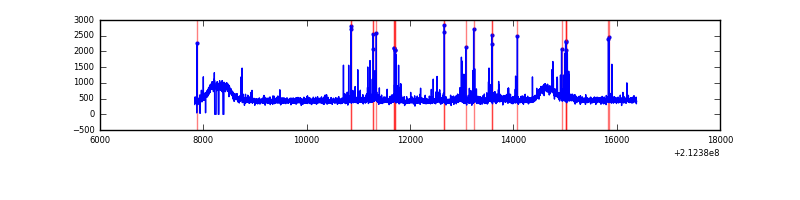 |
Top three noisy pixels from each quadrant. If the there are fewer than three noisy pixels in the level2.evt file, extra rows are filled as -1
| Pixel properties | Quadrant properties | ||||||
|---|---|---|---|---|---|---|---|
| Quadrant | DetID | PixID | Counts | Sigma | Mean | Median | Sigma |
| A | 15 | 174 | 234986 | 1093.54 | 1029 | 1001 | 214.0 |
| A | 0 | 50 | 108355 | 501.73 | 1029 | 1001 | 214.0 |
| A | 12 | 194 | 10173 | 42.87 | 1029 | 1001 | 214.0 |
| B | 14 | 167 | 334621 | 1645.7 | 1046 | 1016 | 202.7 |
| B | 4 | 80 | 110697 | 541.07 | 1046 | 1016 | 202.7 |
| B | 4 | 81 | 68088 | 330.87 | 1046 | 1016 | 202.7 |
| C | 1 | 16 | 29181 | 117.61 | 1018 | 1022 | 239.4 |
| C | 8 | 128 | 19031 | 75.22 | 1018 | 1022 | 239.4 |
| C | 8 | 112 | 9808 | 36.7 | 1018 | 1022 | 239.4 |
| D | 8 | 195 | 212407 | 836.37 | 1015 | 979 | 252.8 |
| D | 2 | 14 | 111190 | 435.98 | 1015 | 979 | 252.8 |
| D | 4 | 95 | 102977 | 403.49 | 1015 | 979 | 252.8 |
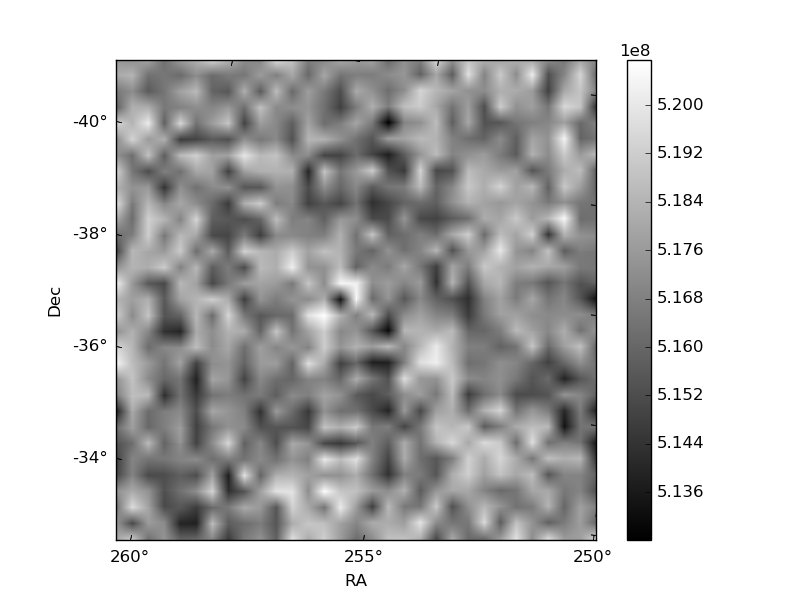
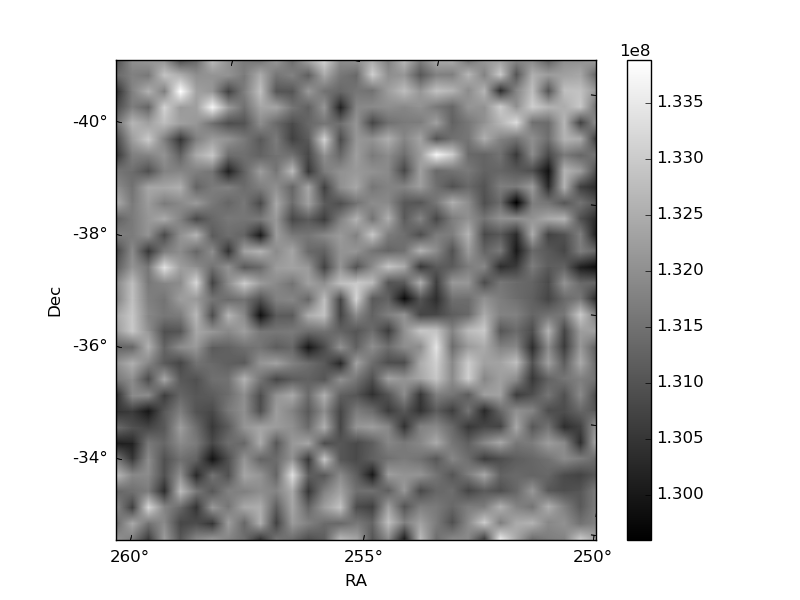
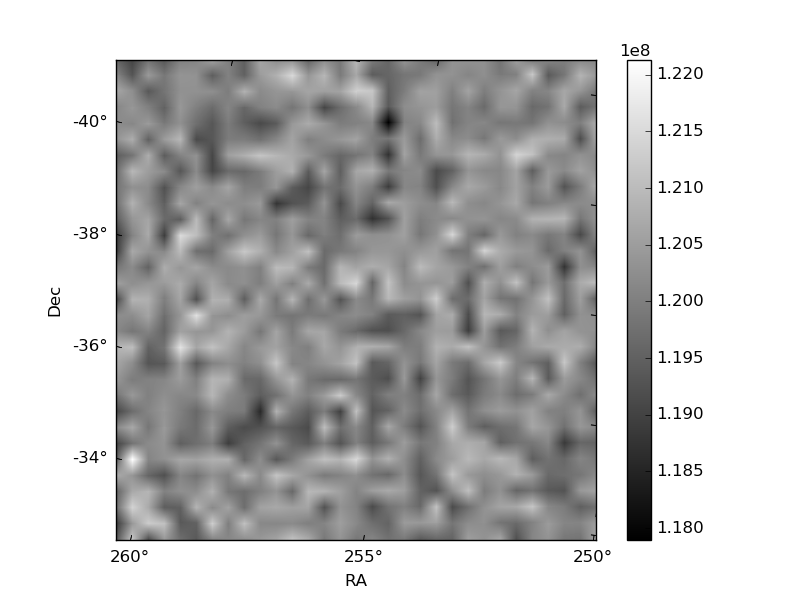
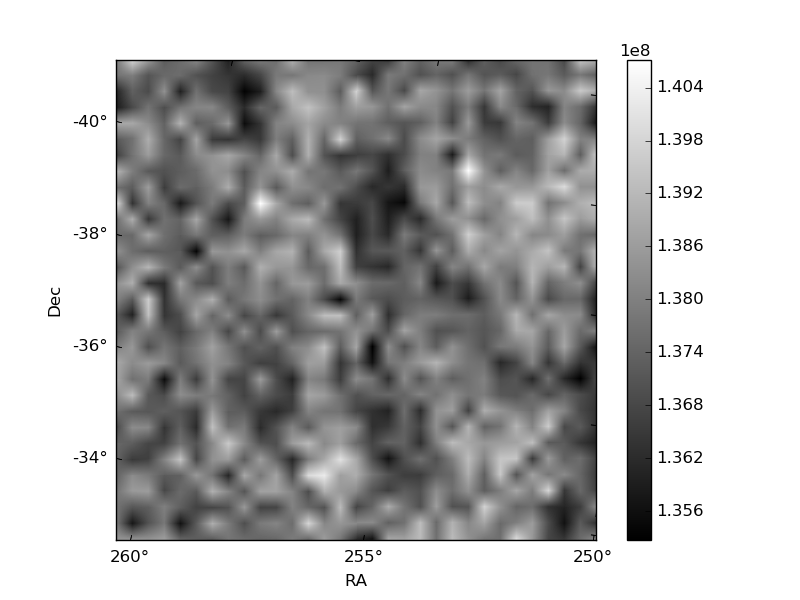
Histogram calculated using DETX and DETY for each event in the final _common_clean file
| Quadrant A | 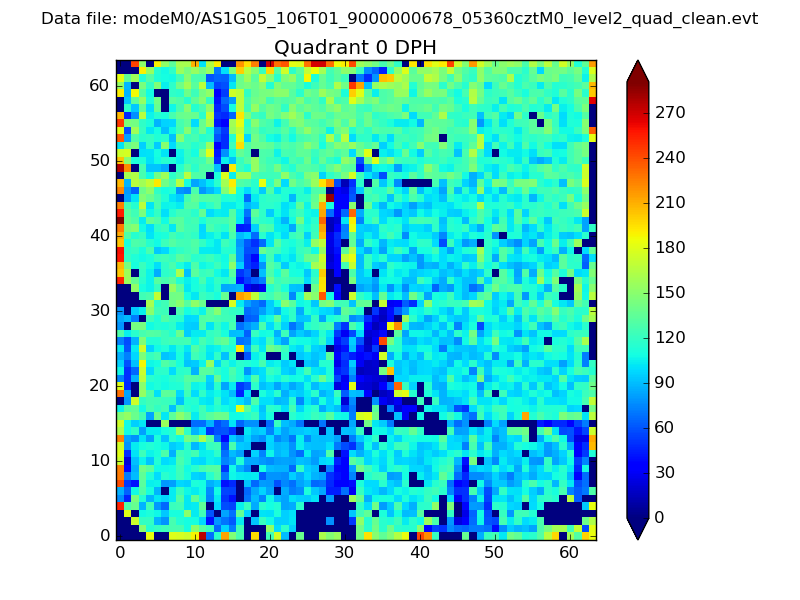 |
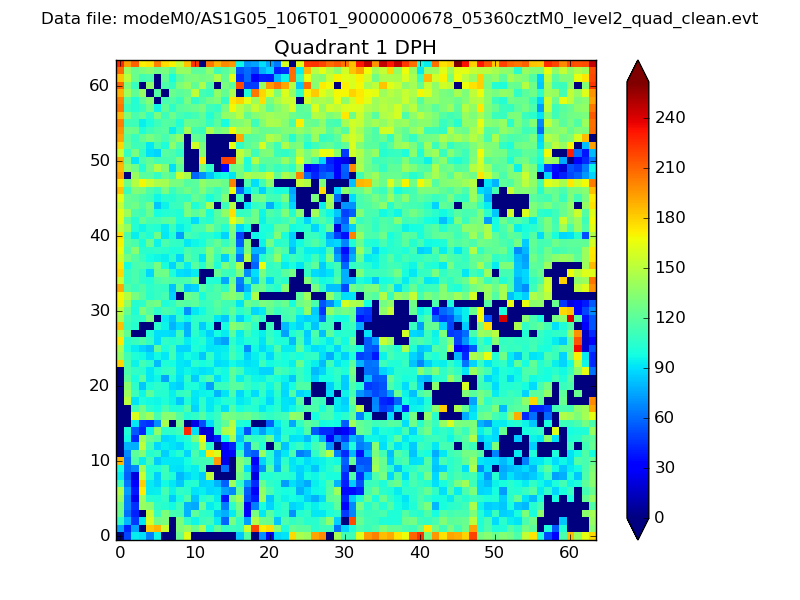 |
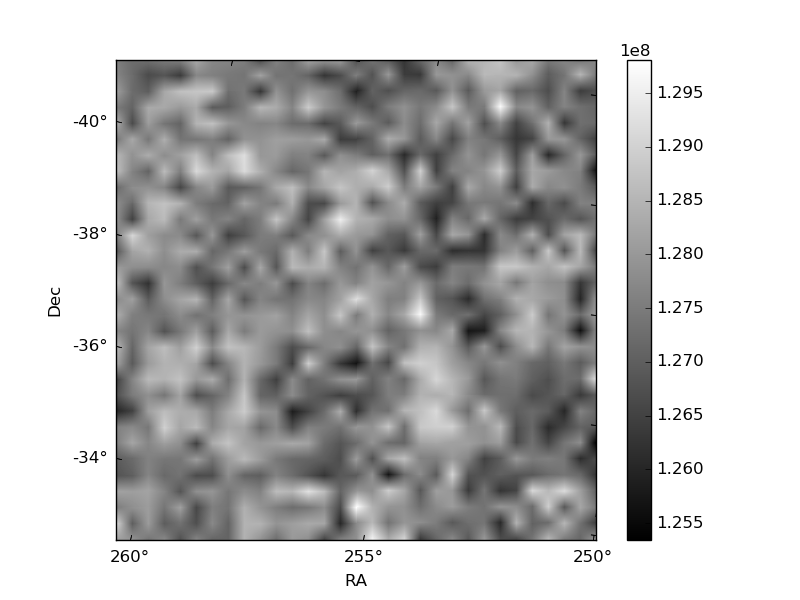
Quadrant B |
|---|---|---|---|
| Quadrant D | 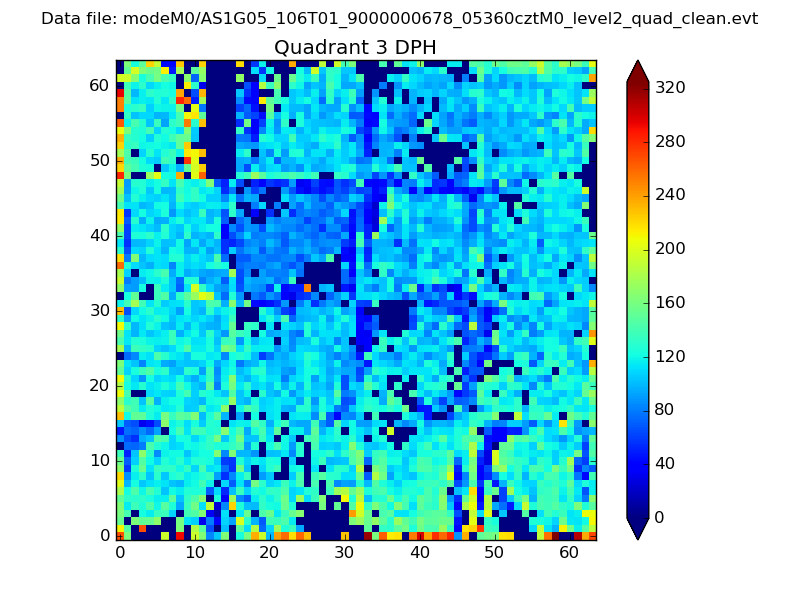 |
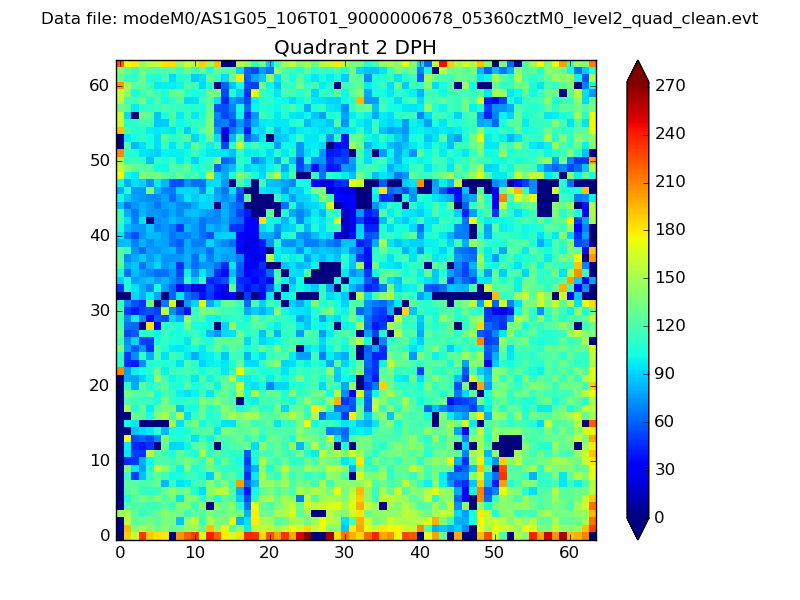 |
Quadrant C |
| Plot type | Count rate plots | Images |
|---|---|---|
| Comparison with Poisson distribution Blue bars denote a histogram of data divided into 1 sec bins. Red curve is a Poisson curve with rate = median count rate of data. |
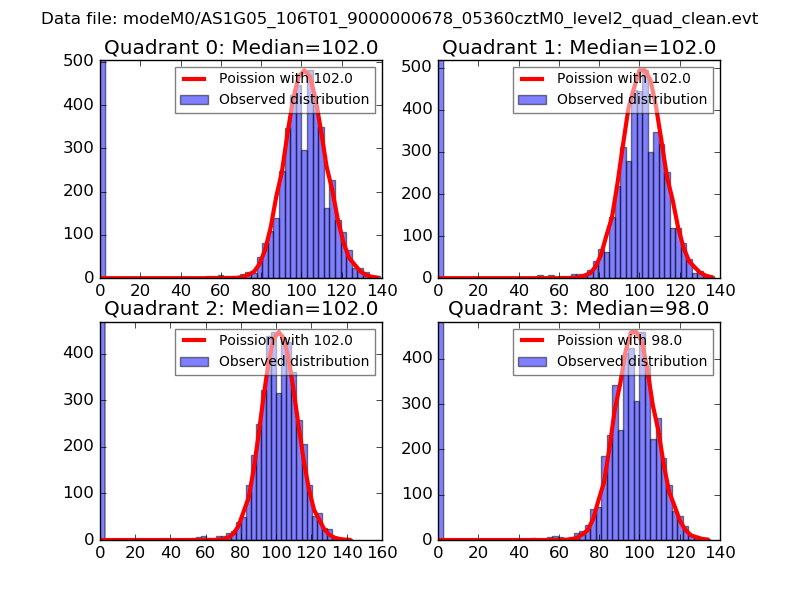 |
 |
| Quadrant-wise count rates Data is divided into 100 sec bins |
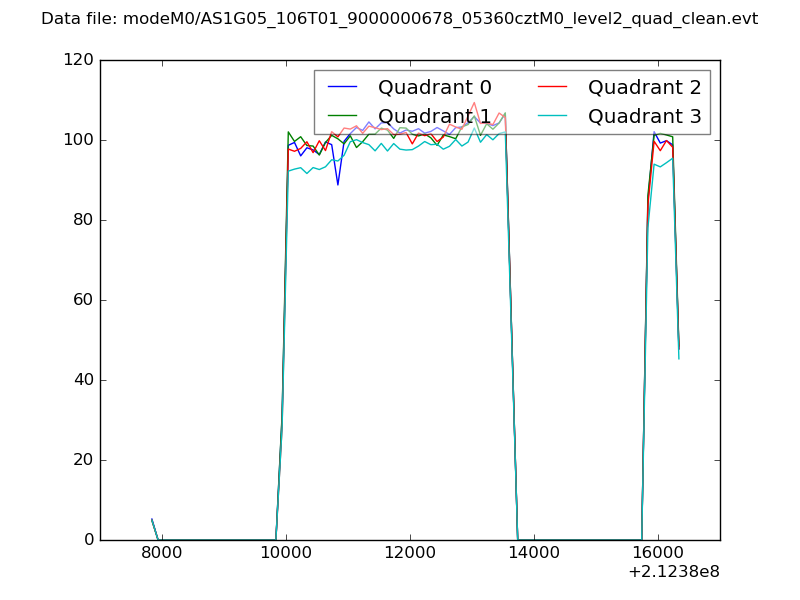 |
|
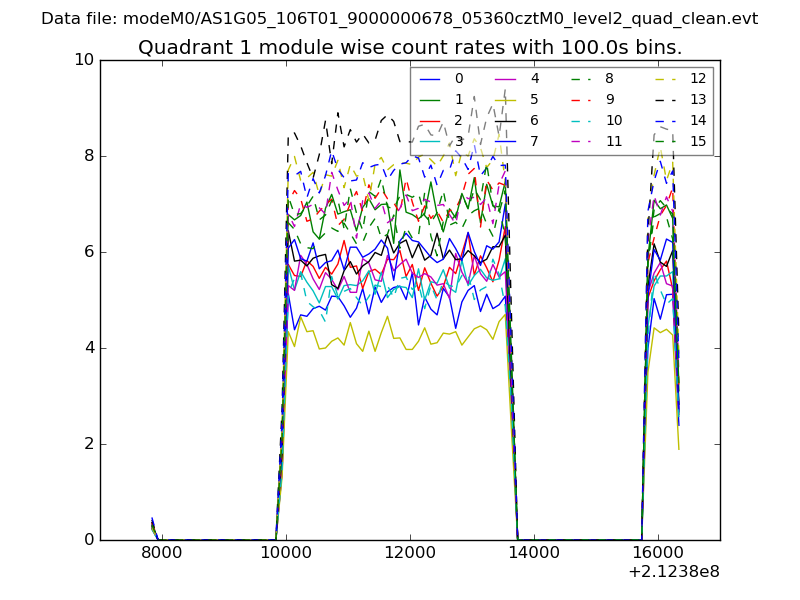
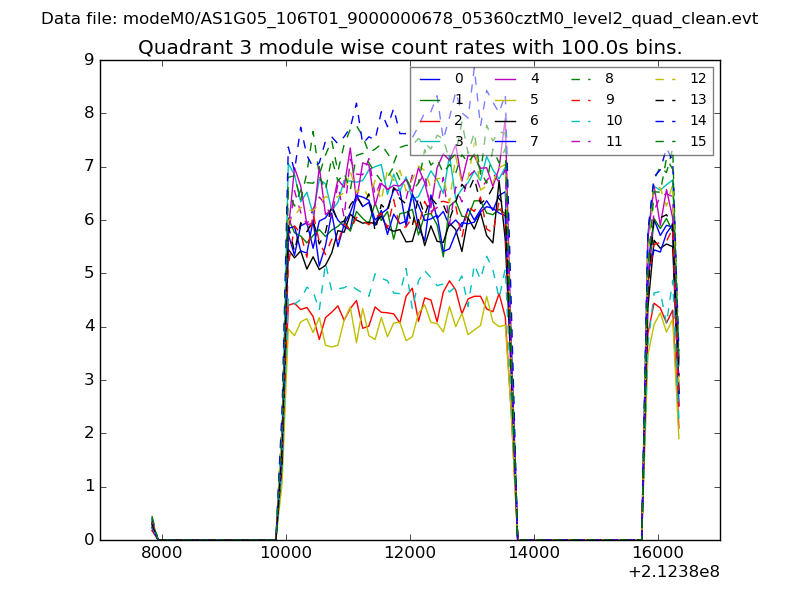
| Module-wise count rates for Quadrant A Data is divided into 100 sec bins |
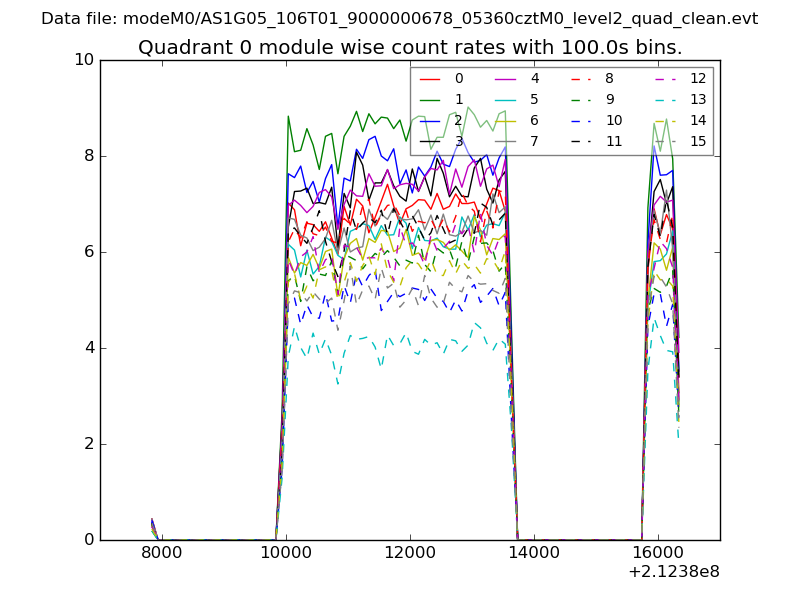 |
 |
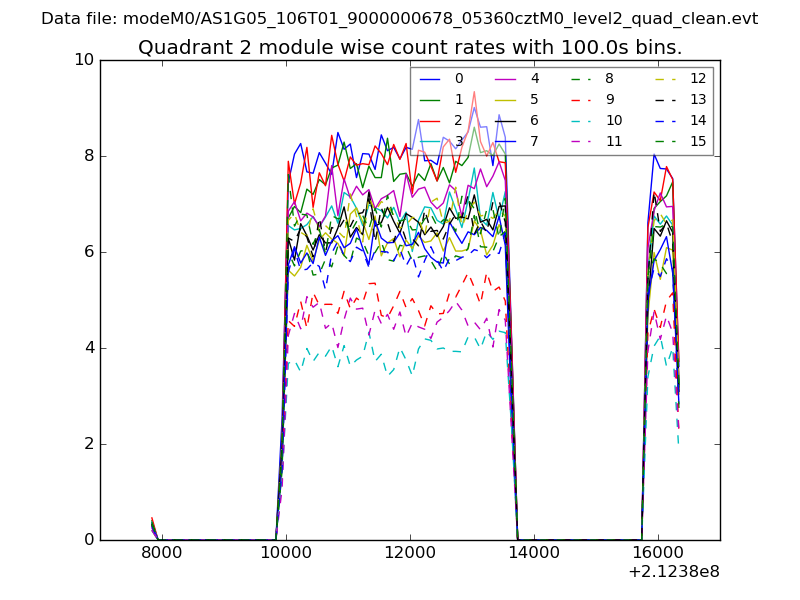
| Module-wise count rates for Quadrant B Data is divided into 100 sec bins |
 |
 |
| Module-wise count rates for Quadrant C Data is divided into 100 sec bins |
 |
 |
| Module-wise count rates for Quadrant D Data is divided into 100 sec bins |
 |
 |
| Parameter | Plot |
|---|---|
| CZT HV Monitor | 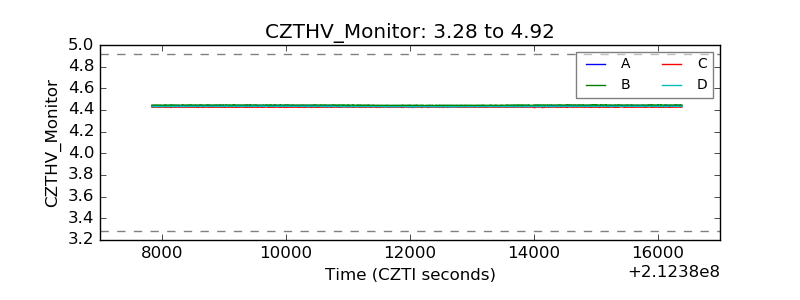 |
| D_VDD | 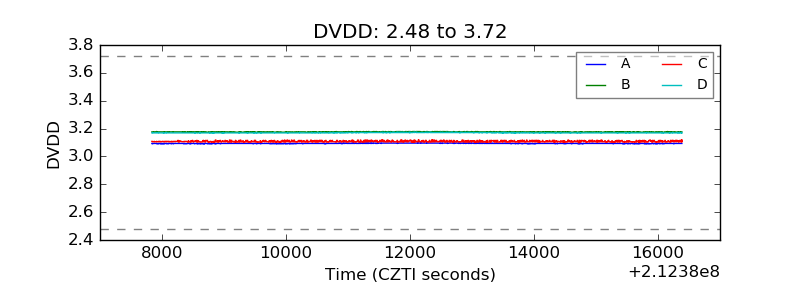 |
| Temperature 1 | 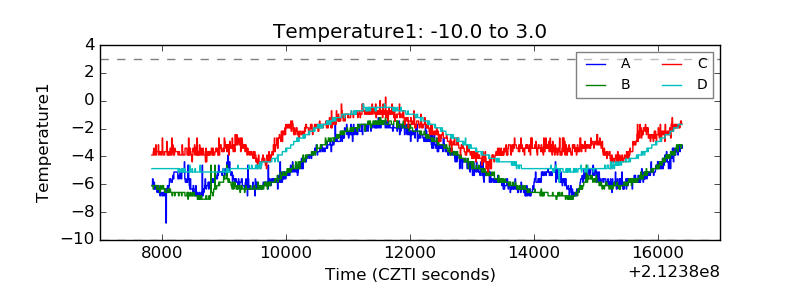 |
| Veto HV Monitor | 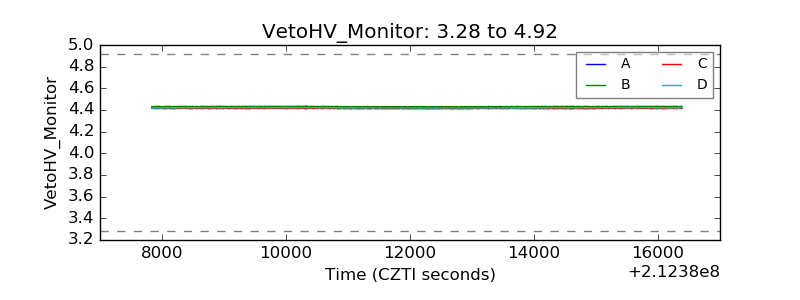 |
| Veto LLD | 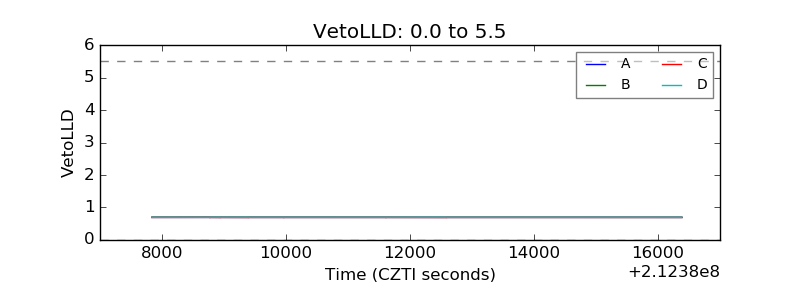 |
| Alpha Counter | 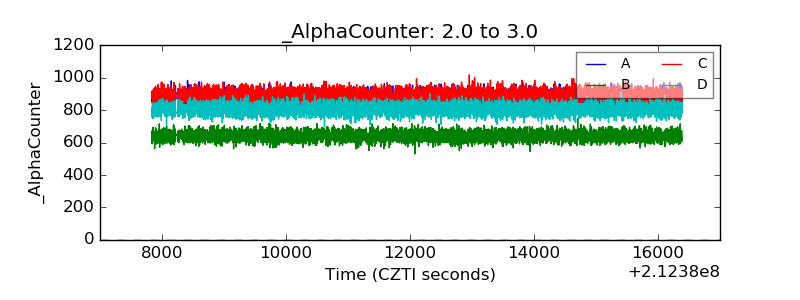 |
| _CPM_Rate | 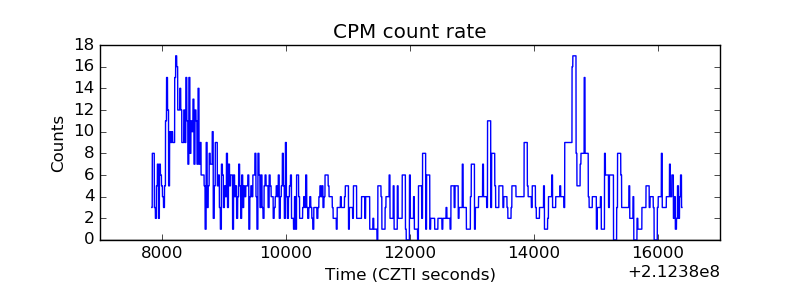 |
| CZT Counter | 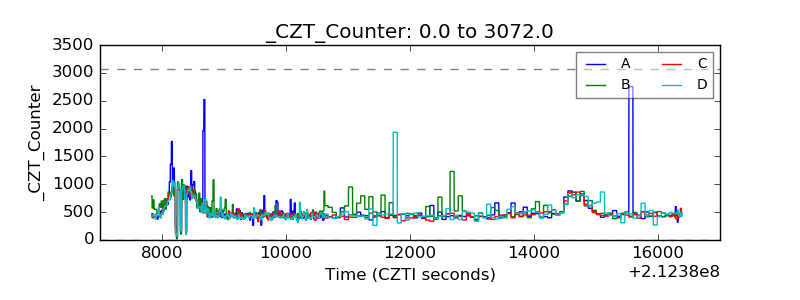 |
| +2.5 Volts monitor |  |
| +5 Volts monitor |  |
| _ROLL_ROT | 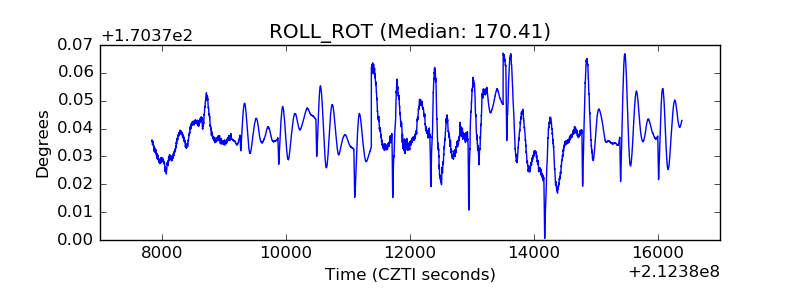 |
| _Roll_DEC | 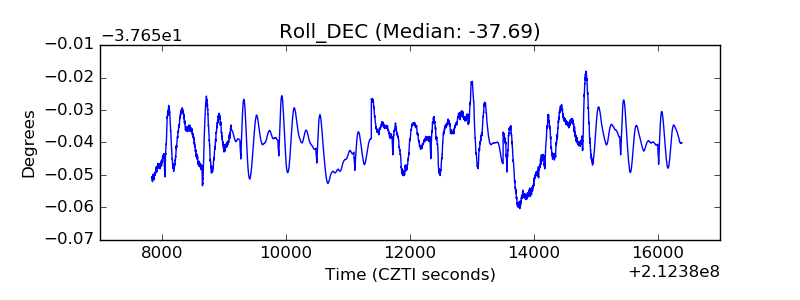 |
| _Roll_RA | 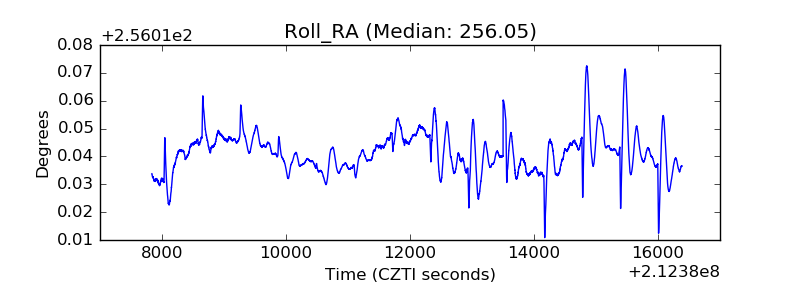 |
| Veto Counter | 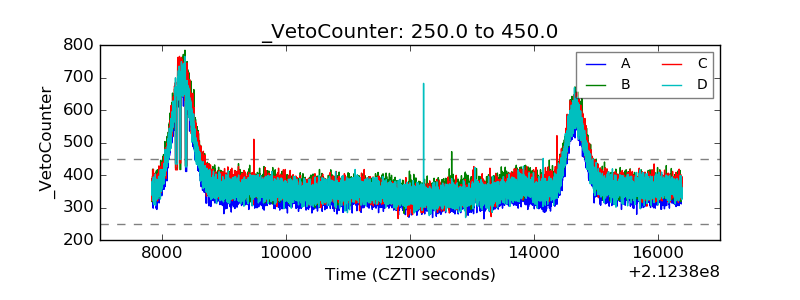 |