| Param | Original file | Final file |
|---|---|---|
| Filename | modeM0/AS1G05_106T01_9000000678_05361cztM0_level2.evt | modeM0/AS1G05_106T01_9000000678_05361cztM0_level2_quad_clean.evt |
| Size (bytes) | 467,259,840 | 60,114,240 |
| Size | 445.6 MB | 57.3 MB |
| Events in quadrant A | 3,461,503 | 347,761 |
| Events in quadrant B | 3,494,043 | 327,837 |
| Events in quadrant C | 3,151,671 | 350,398 |
| Events in quadrant D | 3,591,165 | 330,742 |
| Mode SS | |||
|---|---|---|---|
| Quadrant | BADHDUFLAG | Total packets | Discarded packets |
| A | 0 | 165 | 25 |
| B | 0 | 165 | 33 |
| C | 0 | 164 | 22 |
| D | 0 | 164 | 32 |
| Mode M0 | |||
|---|---|---|---|
| Quadrant | BADHDUFLAG | Total packets | Discarded packets |
| A | 0 | 18177 | 3272 |
| B | 0 | 17988 | 3283 |
| C | 0 | 16940 | 2957 |
| D | 0 | 18704 | 3535 |
| Mode M9 | |||
|---|---|---|---|
| Quadrant | BADHDUFLAG | Total packets | Discarded packets |
| A | 0 | 3 | 0 |
| B | 0 | 3 | 0 |
| C | 0 | 3 | 1 |
| D | 0 | 3 | 0 |
| Quadrant | Total seconds | Saturated seconds | Saturation percentage |
|---|---|---|---|
| A | 6631 | 513 | 7.736390% |
| B | 6651 | 401 | 6.029169% |
| C | 6639 | 272 | 4.097003% |
| D | 6616 | 361 | 5.456469% |
Noise dominated data is calculated using 1-second bins in cleaned event files. If a bin has >2000 counts, and if more than 50% of those come from <1% of pixels, then it is considered to be noise-dominated and hence unusable.
| Quadrant | # 1 sec bins | Bins with >0 counts | Bins with >2000 counts | High rate bins dominated by noise | Noise dominated (total time) | Noise dominated (detector-on time) | Marked lightcurve |
|---|---|---|---|---|---|---|---|
| A | 8404 | 7126 | 74 | 74 | 0.88% | 1.04% | 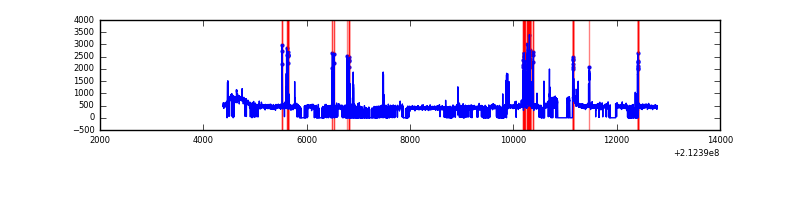 |
| B | 8403 | 7149 | 19 | 19 | 0.23% | 0.27% | 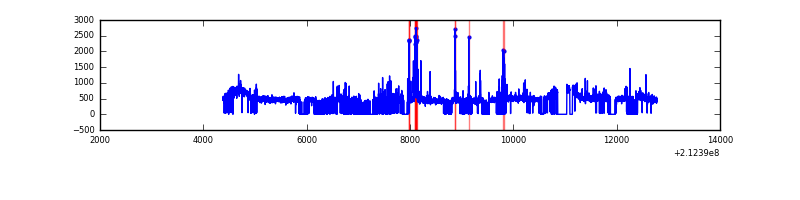 |
| C | 8404 | 7144 | 0 | 0 | 0.00% | 0.00% | 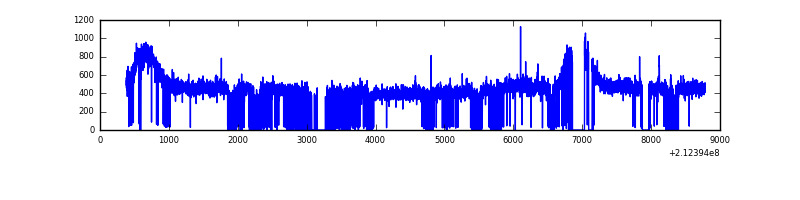 |
| D | 8404 | 7132 | 37 | 37 | 0.44% | 0.52% | 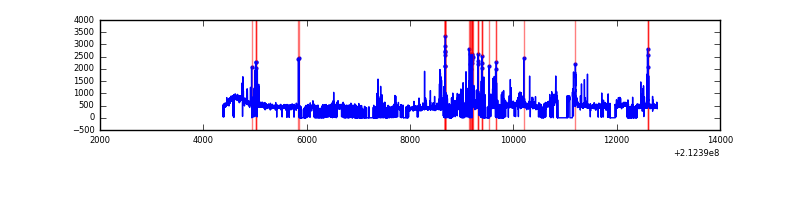 |
Top three noisy pixels from each quadrant. If the there are fewer than three noisy pixels in the level2.evt file, extra rows are filled as -1
| Pixel properties | Quadrant properties | ||||||
|---|---|---|---|---|---|---|---|
| Quadrant | DetID | PixID | Counts | Sigma | Mean | Median | Sigma |
| A | 15 | 174 | 188235 | 1130.03 | 800 | 781 | 165.9 |
| A | 0 | 50 | 155298 | 931.48 | 800 | 781 | 165.9 |
| A | 14 | 111 | 37762 | 222.93 | 800 | 781 | 165.9 |
| B | 4 | 80 | 125939 | 787.51 | 816 | 795 | 158.9 |
| B | 4 | 81 | 75817 | 472.1 | 816 | 795 | 158.9 |
| B | 15 | 204 | 47454 | 293.62 | 816 | 795 | 158.9 |
| C | 1 | 16 | 39780 | 211.83 | 791 | 792 | 184.0 |
| C | 8 | 128 | 10279 | 51.55 | 791 | 792 | 184.0 |
| C | 13 | 61 | 6422 | 30.59 | 791 | 792 | 184.0 |
| D | 2 | 63 | 164401 | 841.36 | 785 | 758 | 194.5 |
| D | 2 | 234 | 102808 | 524.68 | 785 | 758 | 194.5 |
| D | 8 | 195 | 93811 | 478.42 | 785 | 758 | 194.5 |
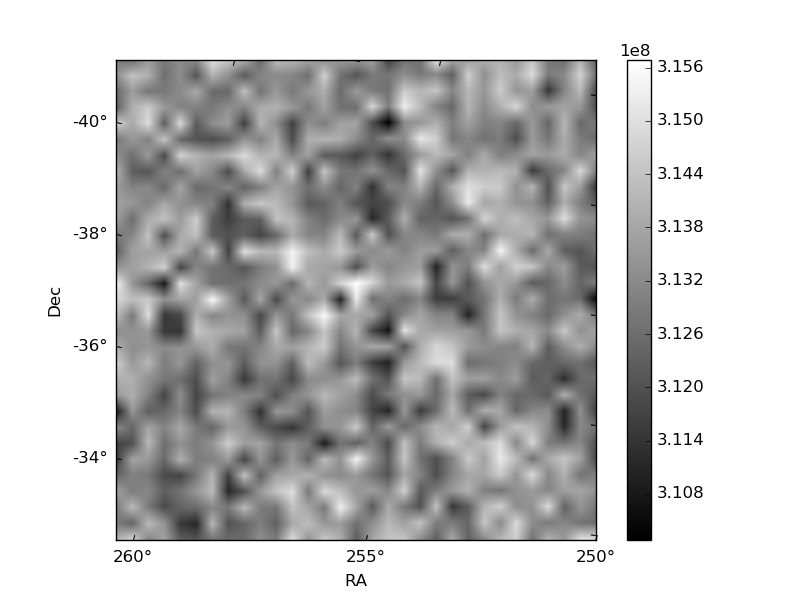
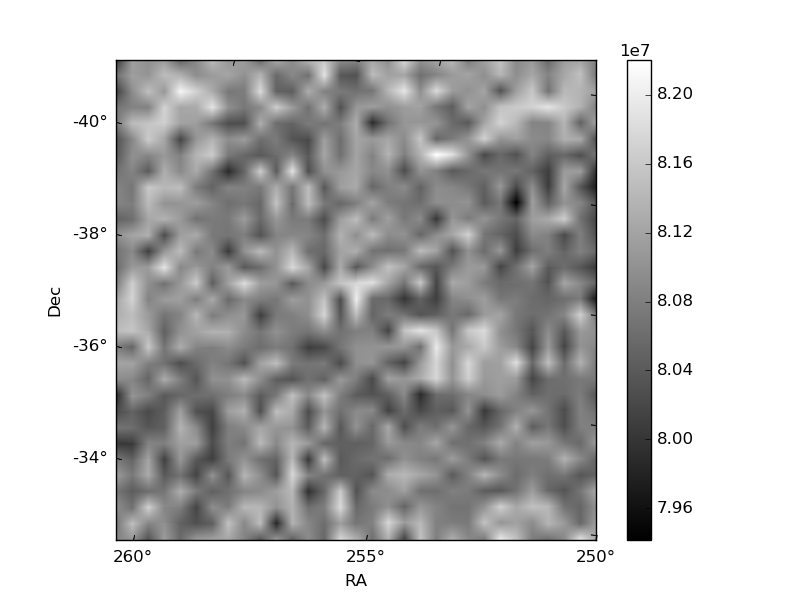
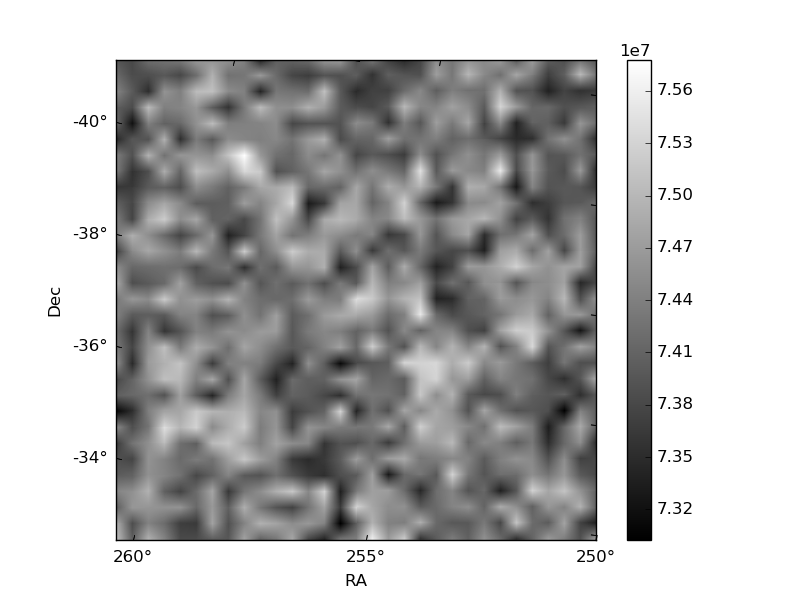
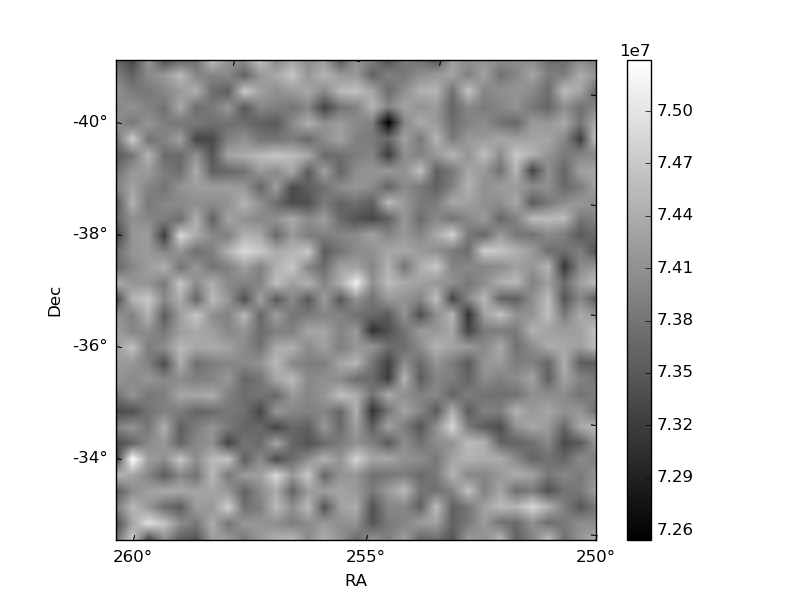
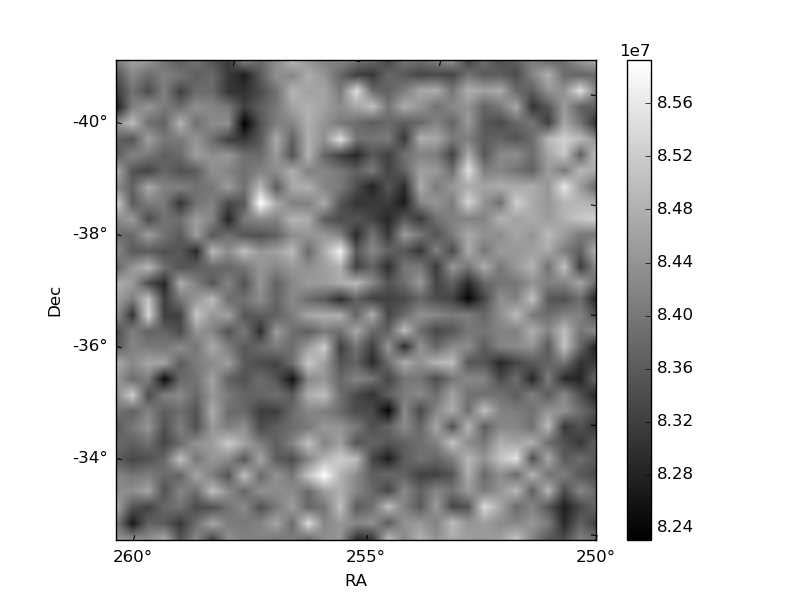
Histogram calculated using DETX and DETY for each event in the final _common_clean file
| Quadrant A | 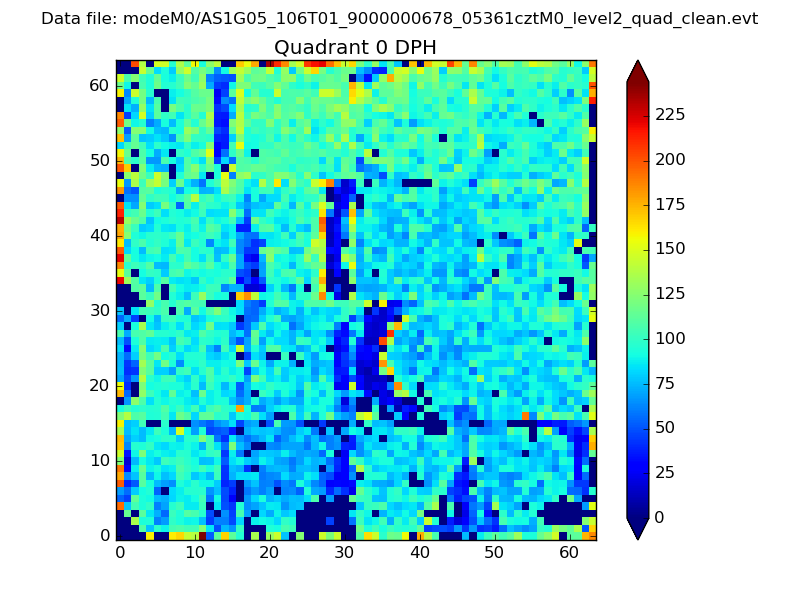 |
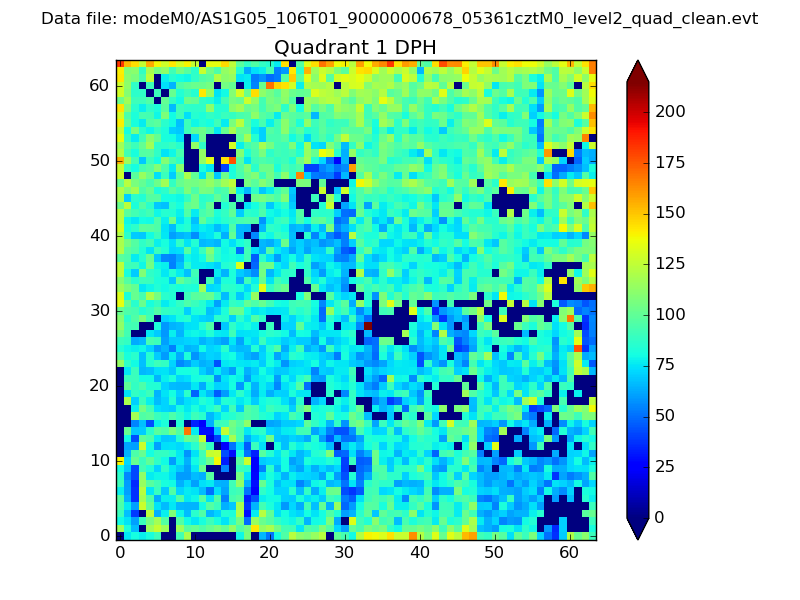 |
Quadrant B |
|---|---|---|---|
| Quadrant D | 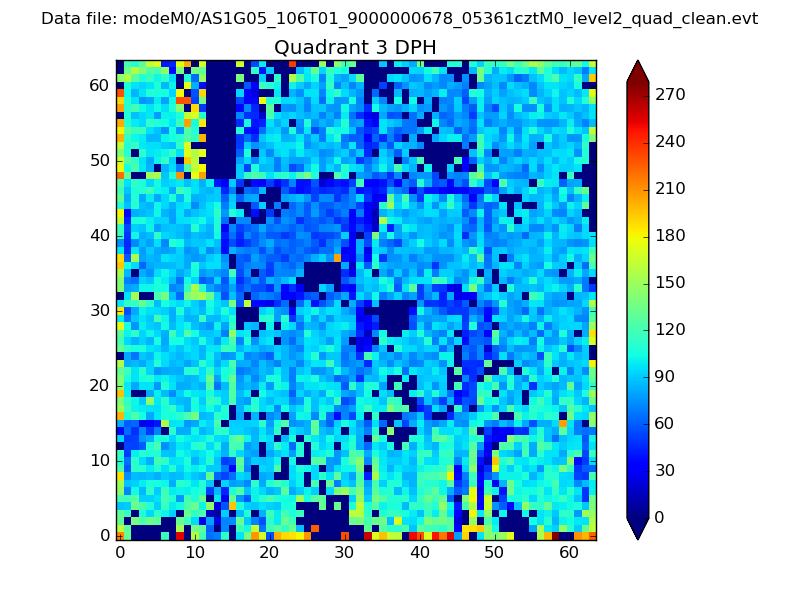 |
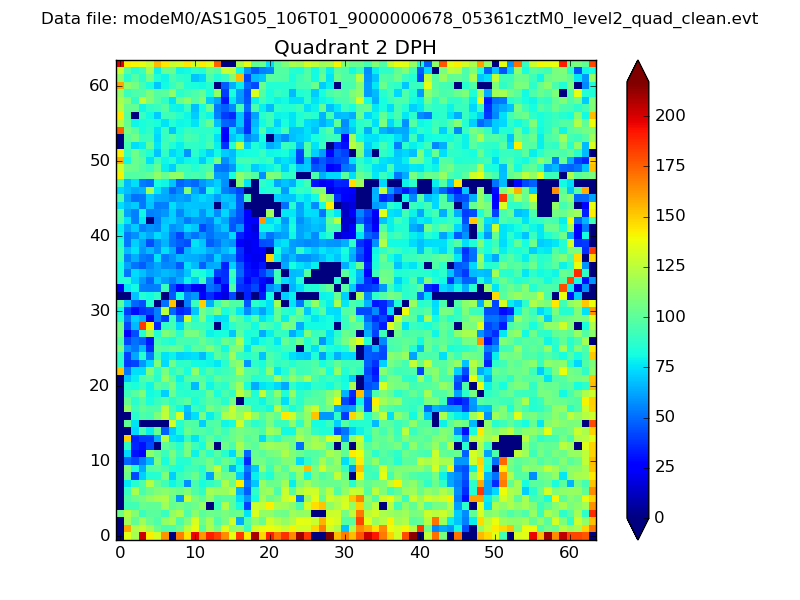 |
Quadrant C |
| Plot type | Count rate plots | Images |
|---|---|---|
| Comparison with Poisson distribution Blue bars denote a histogram of data divided into 1 sec bins. Red curve is a Poisson curve with rate = median count rate of data. |
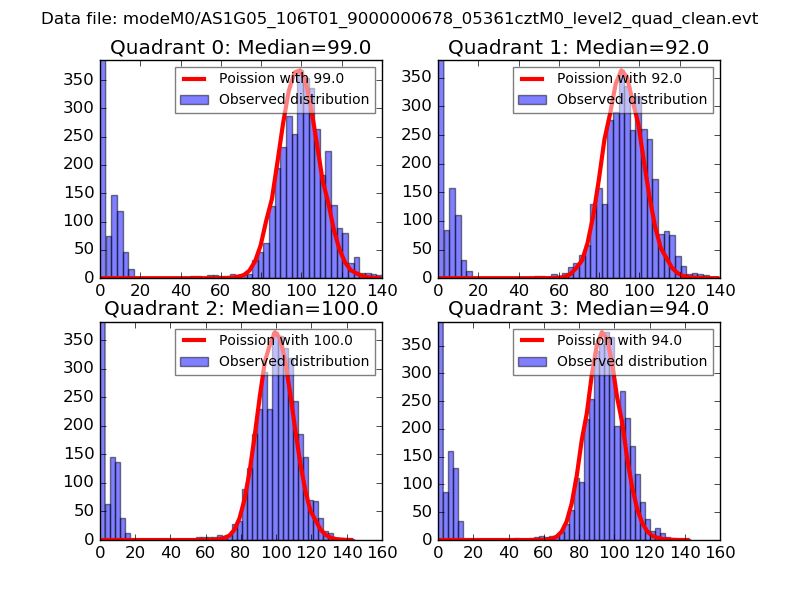 |
 |
| Quadrant-wise count rates Data is divided into 100 sec bins |
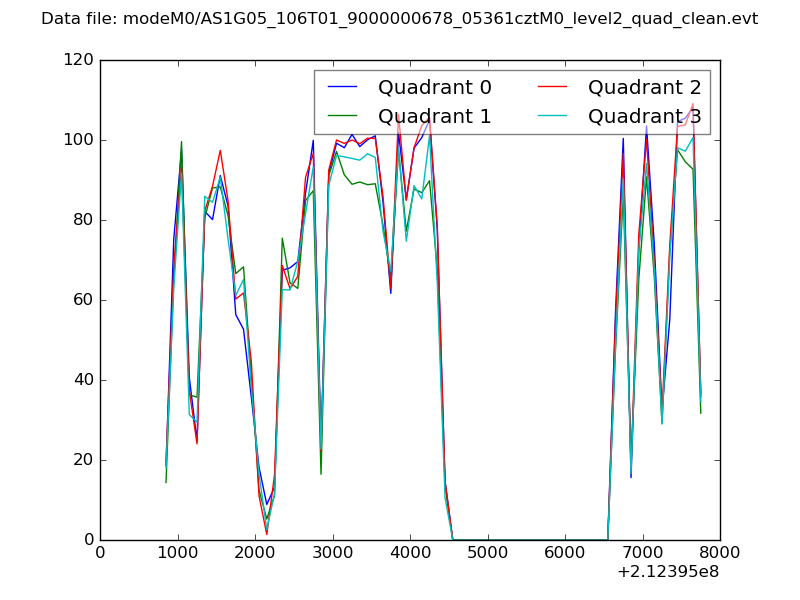 |
|
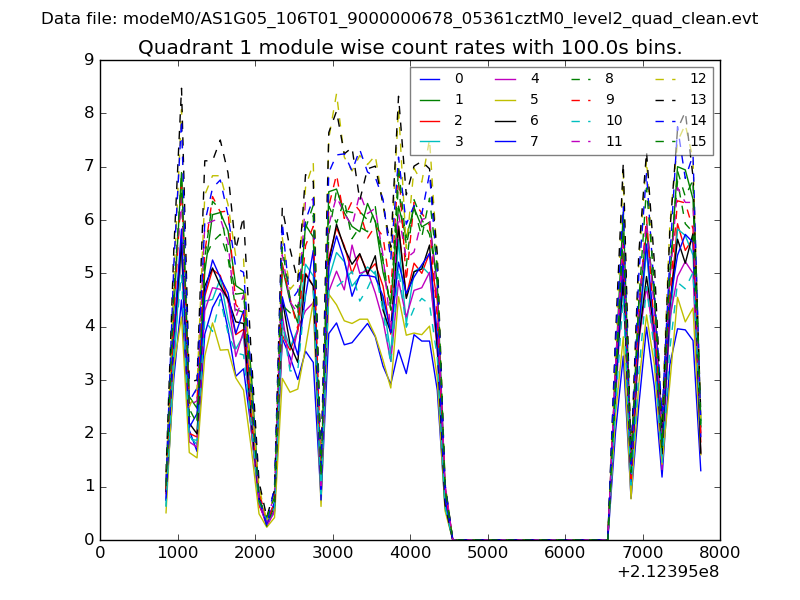
| Module-wise count rates for Quadrant A Data is divided into 100 sec bins |
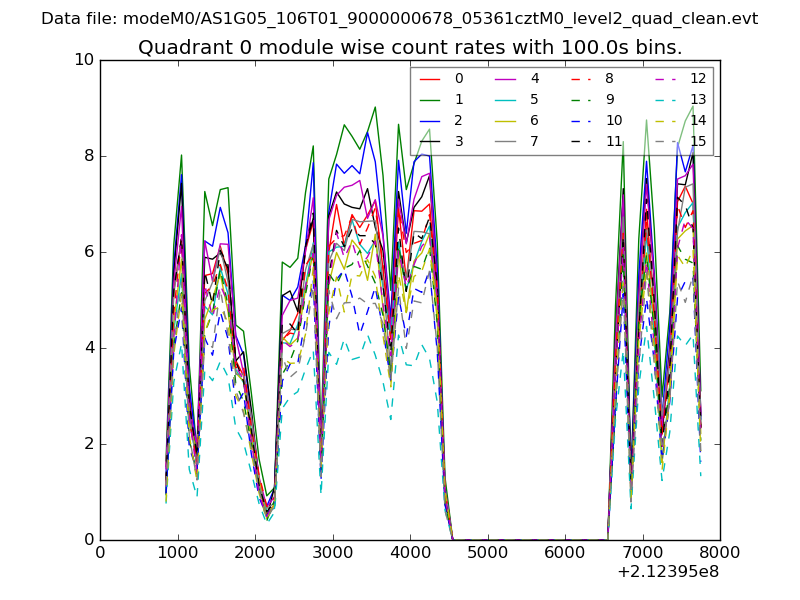 |
 |
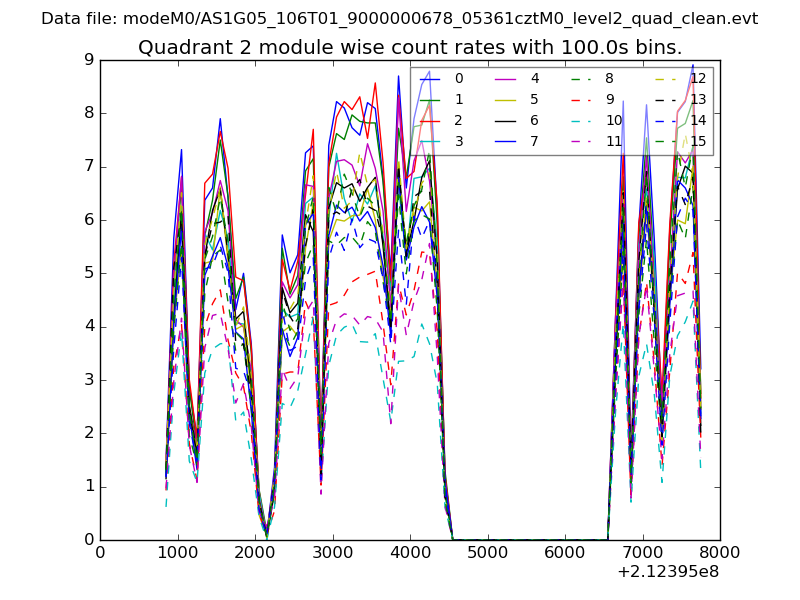
| Module-wise count rates for Quadrant B Data is divided into 100 sec bins |
 |
 |
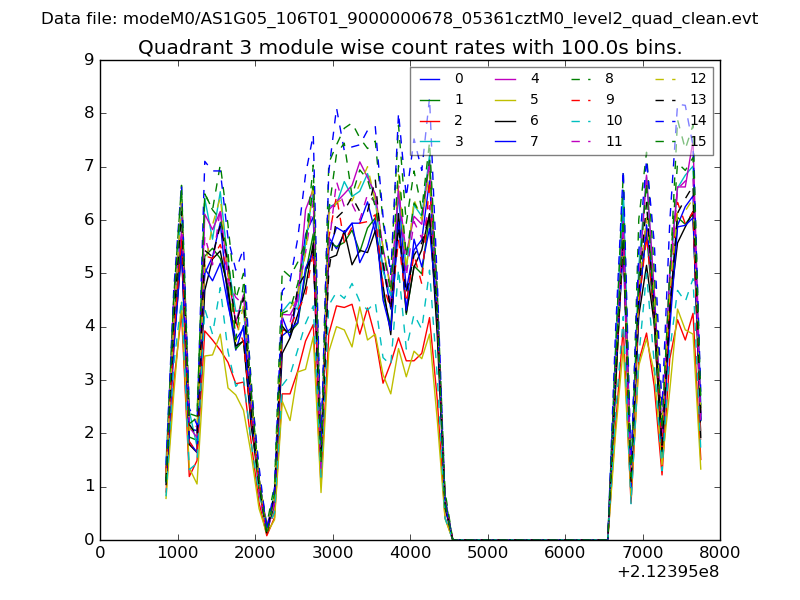
| Module-wise count rates for Quadrant C Data is divided into 100 sec bins |
 |
 |
| Module-wise count rates for Quadrant D Data is divided into 100 sec bins |
 |
 |
| Parameter | Plot |
|---|---|
| CZT HV Monitor | 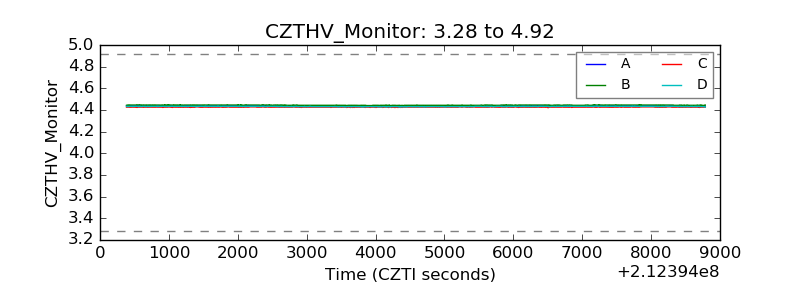 |
| D_VDD | 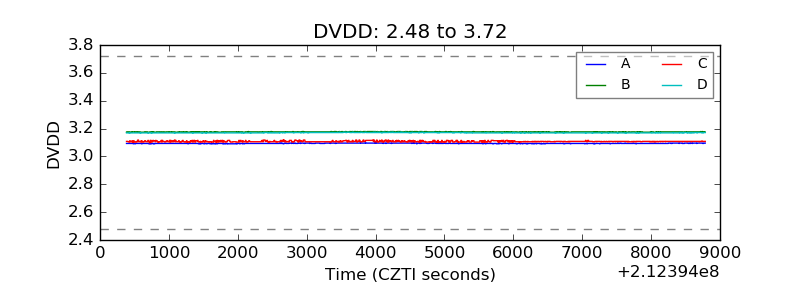 |
| Temperature 1 | 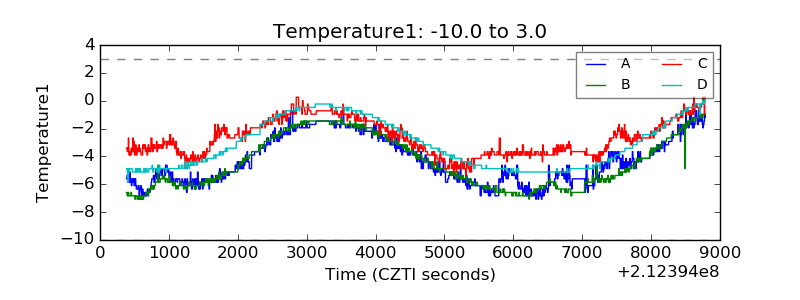 |
| Veto HV Monitor | 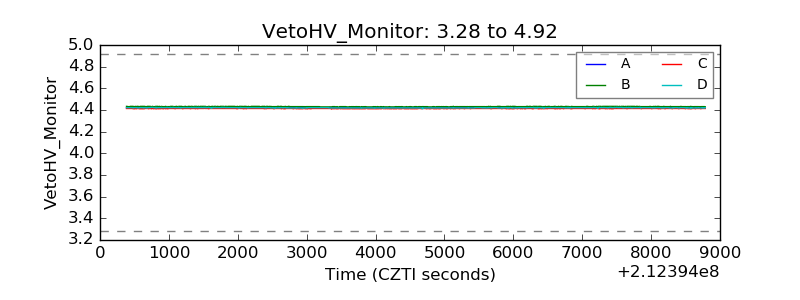 |
| Veto LLD | 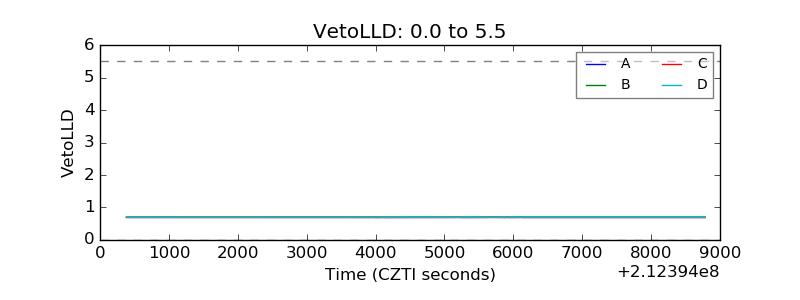 |
| Alpha Counter |  |
| _CPM_Rate |  |
| CZT Counter | 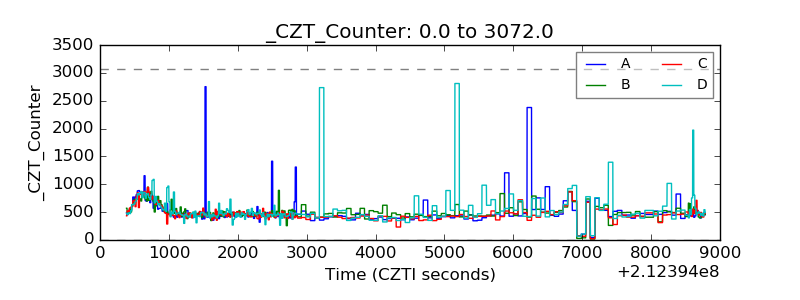 |
| +2.5 Volts monitor |  |
| +5 Volts monitor |  |
| _ROLL_ROT | 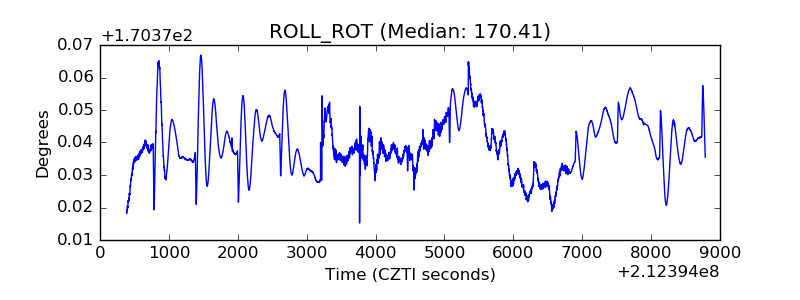 |
| _Roll_DEC | 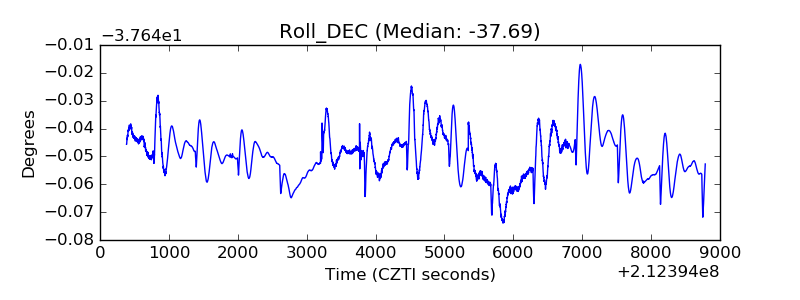 |
| _Roll_RA | 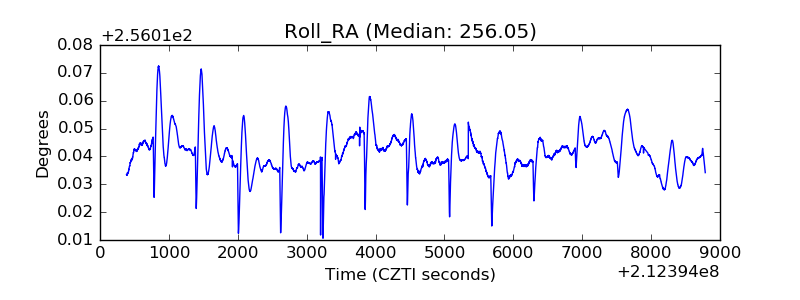 |
| Veto Counter | 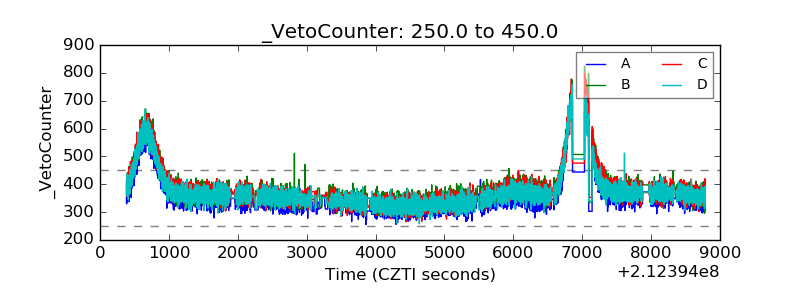 |