| Param | Original file | Final file |
|---|---|---|
| Filename | modeM0/AS1G05_106T01_9000000678_05364cztM0_level2.evt | modeM0/AS1G05_106T01_9000000678_05364cztM0_level2_quad_clean.evt |
| Size (bytes) | 1,601,190,720 | 264,908,160 |
| Size | 1.5 GB | 252.6 MB |
| Events in quadrant A | 11,655,750 | 1,614,670 |
| Events in quadrant B | 12,440,864 | 1,612,555 |
| Events in quadrant C | 10,606,732 | 1,620,588 |
| Events in quadrant D | 12,189,236 | 1,547,369 |
| Mode SS | |||
|---|---|---|---|
| Quadrant | BADHDUFLAG | Total packets | Discarded packets |
| A | 0 | 482 | 0 |
| B | 0 | 482 | 0 |
| C | 0 | 482 | 0 |
| D | 0 | 482 | 0 |
| Mode M0 | |||
|---|---|---|---|
| Quadrant | BADHDUFLAG | Total packets | Discarded packets |
| A | 0 | 51459 | 14 |
| B | 0 | 52515 | 14 |
| C | 0 | 48460 | 17 |
| D | 0 | 52232 | 6 |
| Mode M9 | |||
|---|---|---|---|
| Quadrant | BADHDUFLAG | Total packets | Discarded packets |
| A | 0 | 24 | 0 |
| B | 0 | 24 | 0 |
| C | 0 | 24 | 0 |
| D | 0 | 24 | 0 |
| Quadrant | Total seconds | Saturated seconds | Saturation percentage |
|---|---|---|---|
| A | 23663 | 670 | 2.831425% |
| B | 23662 | 498 | 2.104640% |
| C | 23661 | 269 | 1.136892% |
| D | 23666 | 455 | 1.922589% |
Noise dominated data is calculated using 1-second bins in cleaned event files. If a bin has >2000 counts, and if more than 50% of those come from <1% of pixels, then it is considered to be noise-dominated and hence unusable.
| Quadrant | # 1 sec bins | Bins with >0 counts | Bins with >2000 counts | High rate bins dominated by noise | Noise dominated (total time) | Noise dominated (detector-on time) | Marked lightcurve |
|---|---|---|---|---|---|---|---|
| A | 25987 | 23667 | 251 | 251 | 0.97% | 1.06% | 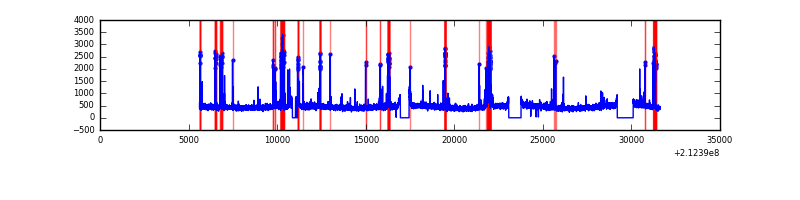 |
| B | 25987 | 23667 | 137 | 137 | 0.53% | 0.58% | 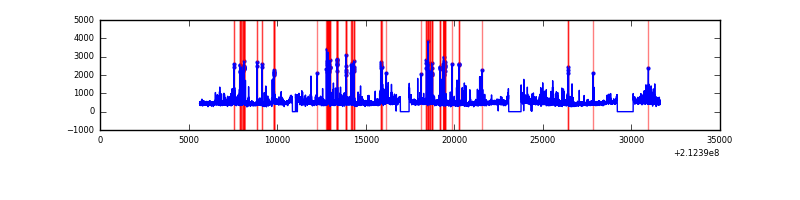 |
| C | 25987 | 23667 | 17 | 17 | 0.07% | 0.07% | 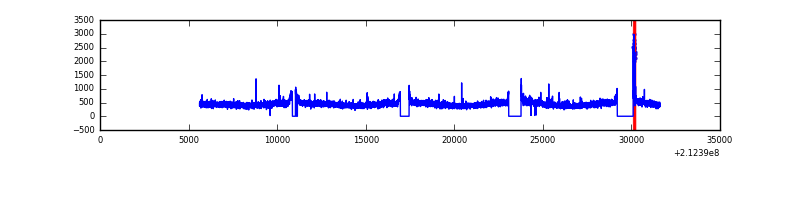 |
| D | 25987 | 23668 | 162 | 162 | 0.62% | 0.68% | 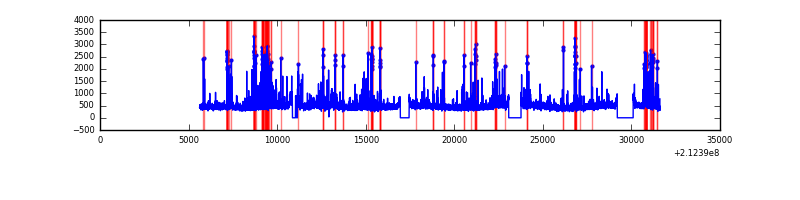 |
Top three noisy pixels from each quadrant. If the there are fewer than three noisy pixels in the level2.evt file, extra rows are filled as -1
| Pixel properties | Quadrant properties | ||||||
|---|---|---|---|---|---|---|---|
| Quadrant | DetID | PixID | Counts | Sigma | Mean | Median | Sigma |
| A | 0 | 50 | 820893 | 1483.72 | 2701 | 2641 | 551.5 |
| A | 15 | 174 | 376156 | 677.29 | 2701 | 2641 | 551.5 |
| A | 14 | 111 | 67240 | 117.14 | 2701 | 2641 | 551.5 |
| B | 10 | 16 | 434463 | 820.64 | 2745 | 2680 | 526.2 |
| B | 4 | 80 | 404425 | 763.55 | 2745 | 2680 | 526.2 |
| B | 4 | 81 | 293598 | 552.92 | 2745 | 2680 | 526.2 |
| C | 1 | 16 | 219889 | 357.66 | 2637 | 2648 | 607.4 |
| C | 9 | 247 | 55593 | 87.17 | 2637 | 2648 | 607.4 |
| C | 13 | 61 | 21744 | 31.44 | 2637 | 2648 | 607.4 |
| D | 8 | 195 | 535783 | 826.21 | 2632 | 2550 | 645.4 |
| D | 2 | 234 | 351549 | 540.75 | 2632 | 2550 | 645.4 |
| D | 2 | 63 | 267946 | 411.22 | 2632 | 2550 | 645.4 |
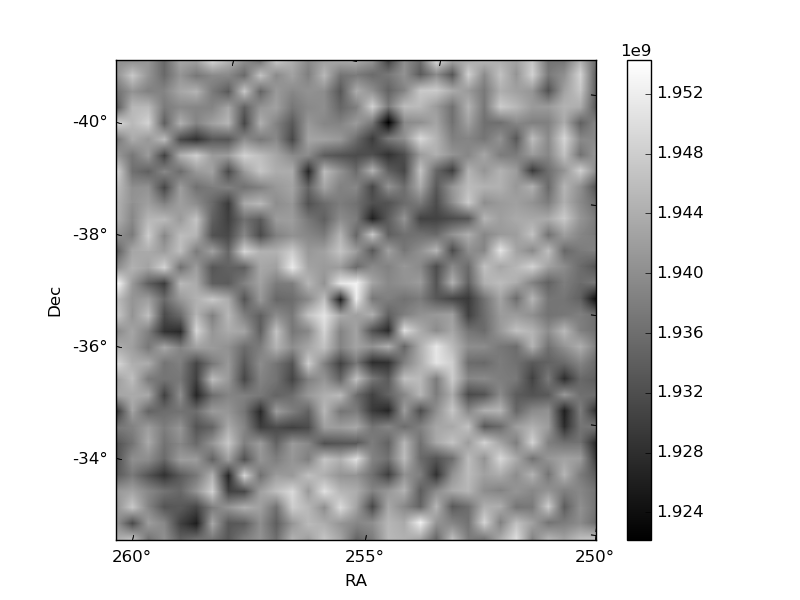
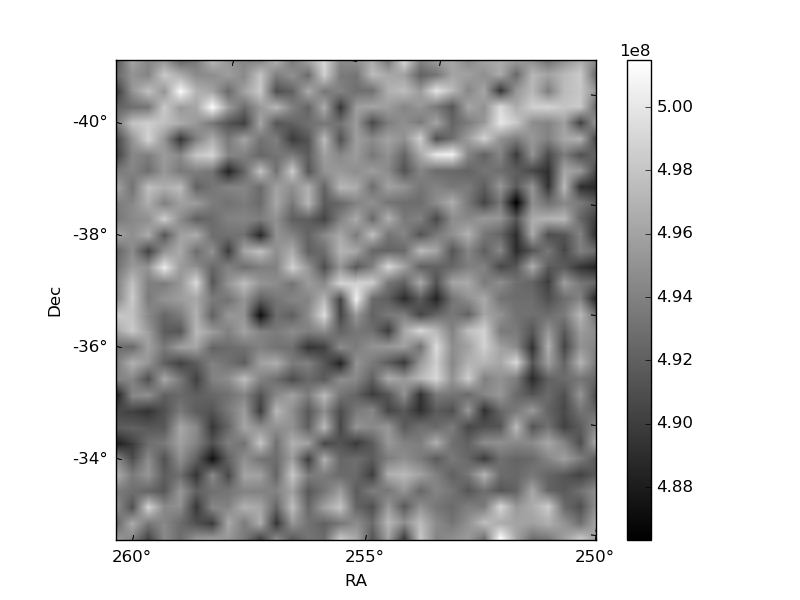
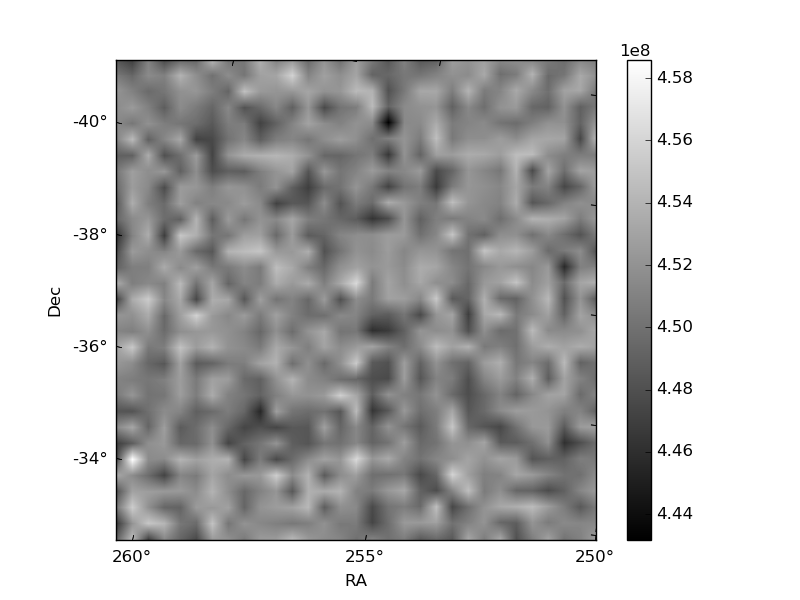
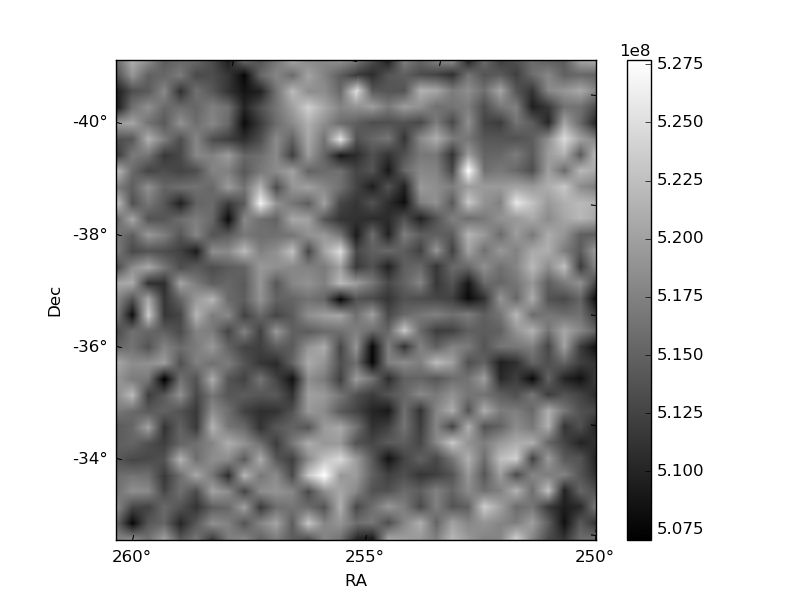
Histogram calculated using DETX and DETY for each event in the final _common_clean file
| Quadrant A | 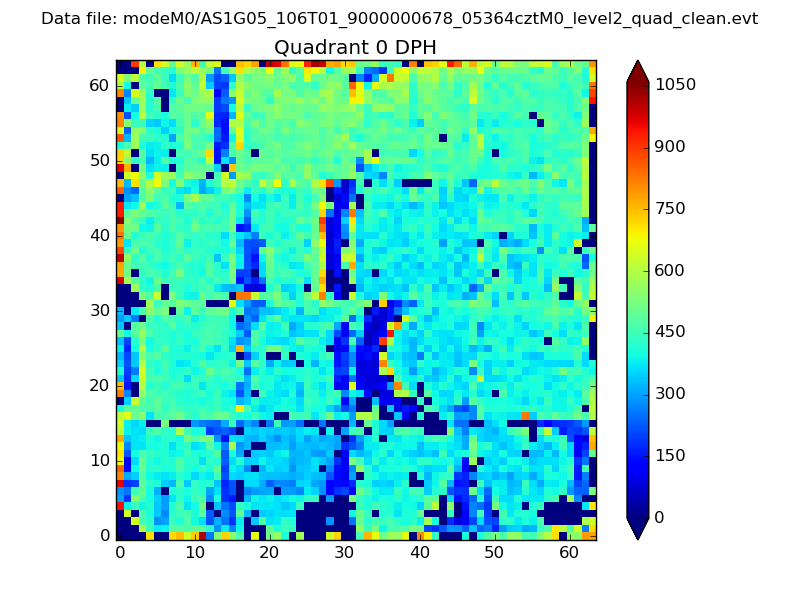 |
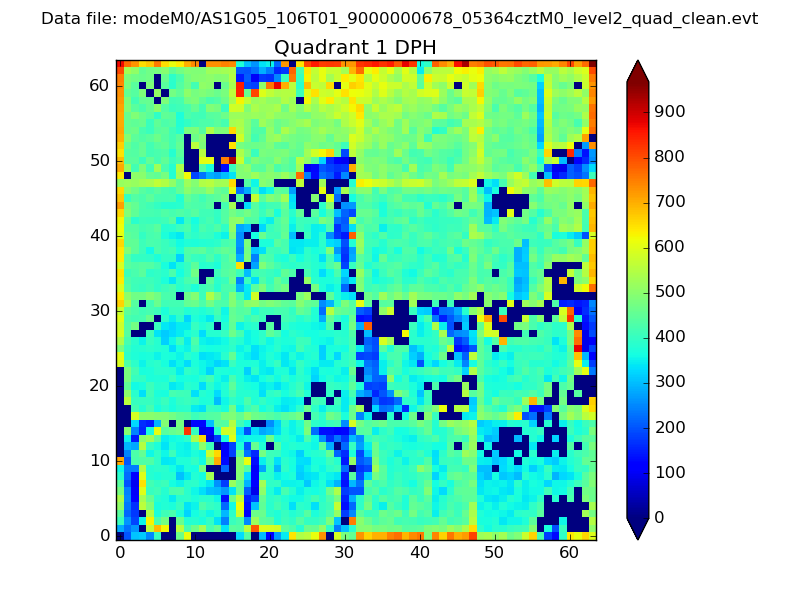 |
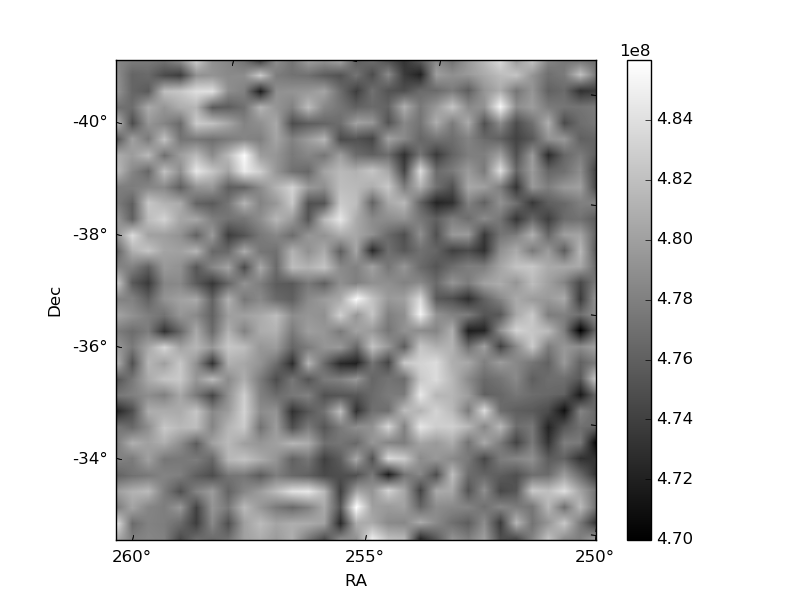
Quadrant B |
|---|---|---|---|
| Quadrant D | 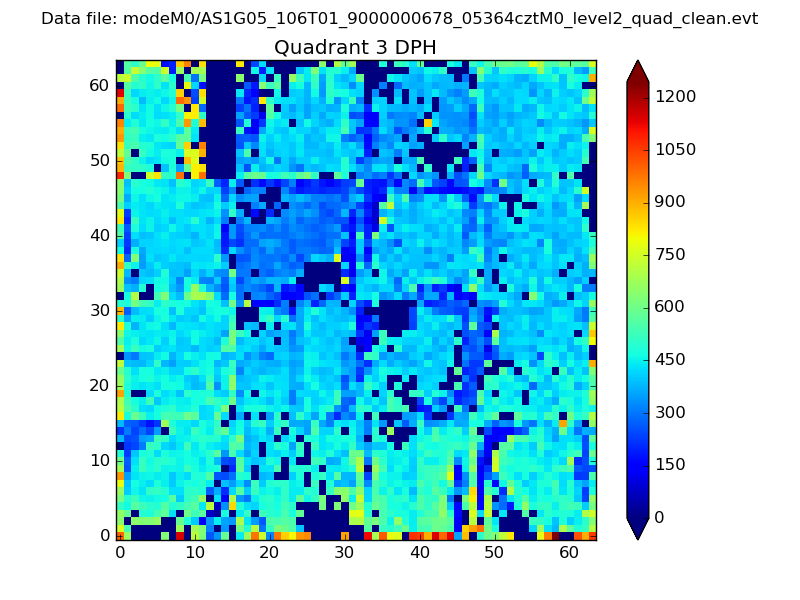 |
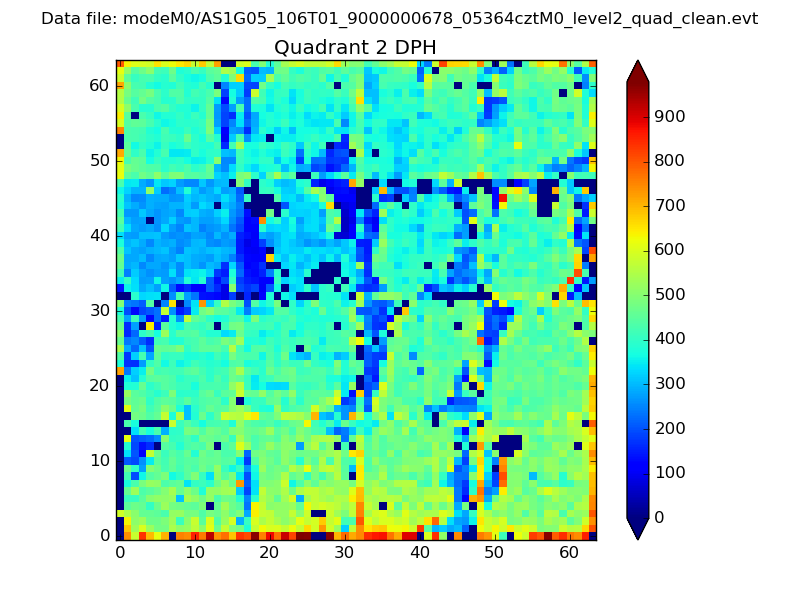 |
Quadrant C |
| Plot type | Count rate plots | Images |
|---|---|---|
| Comparison with Poisson distribution Blue bars denote a histogram of data divided into 1 sec bins. Red curve is a Poisson curve with rate = median count rate of data. |
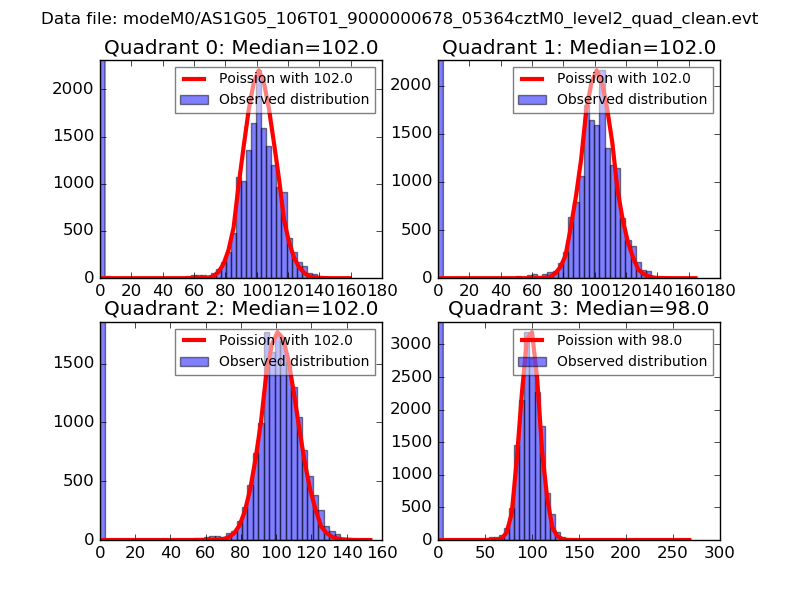 |
 |
| Quadrant-wise count rates Data is divided into 100 sec bins |
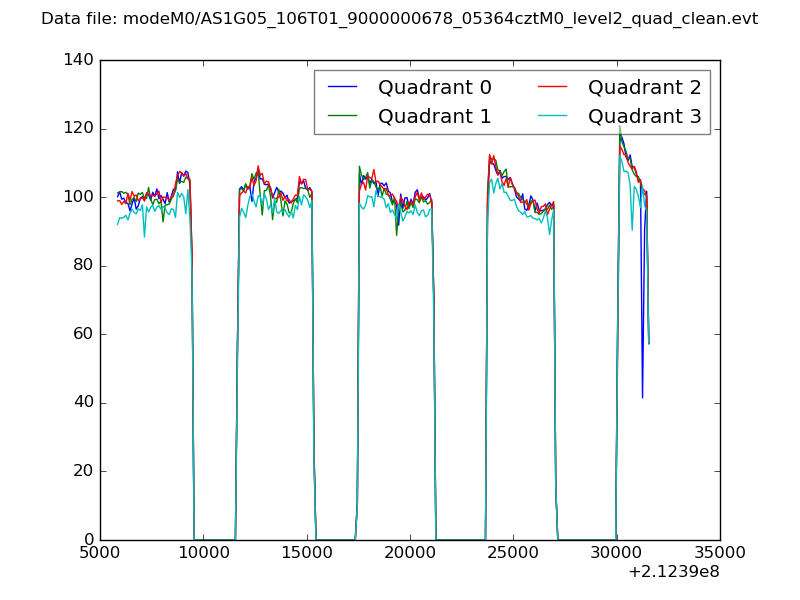 |
|
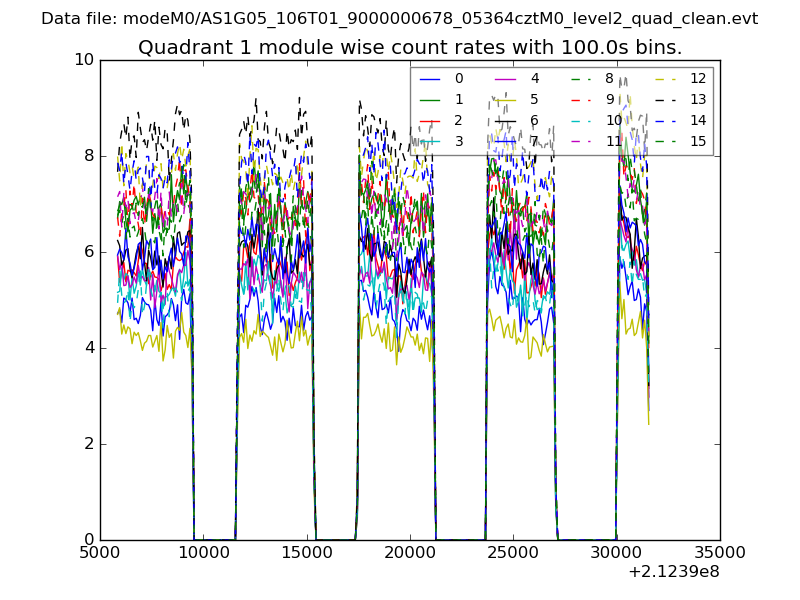
| Module-wise count rates for Quadrant A Data is divided into 100 sec bins |
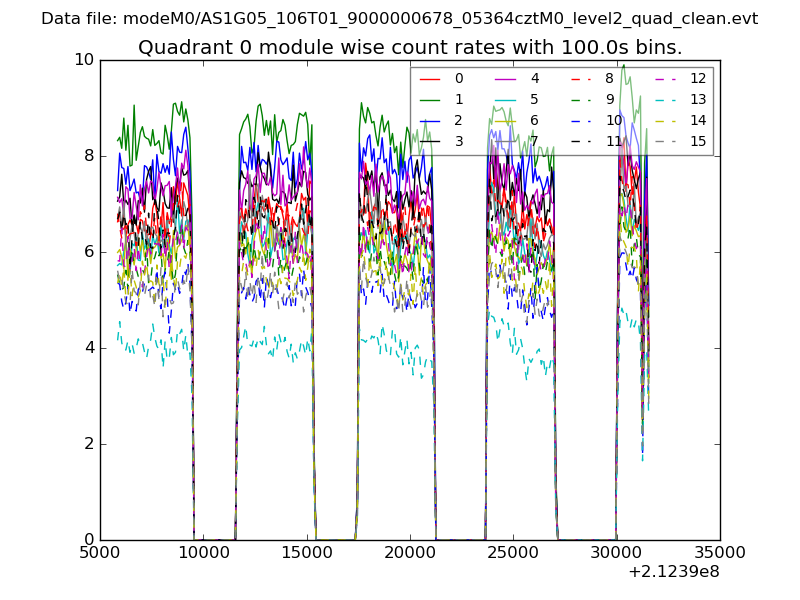 |
 |
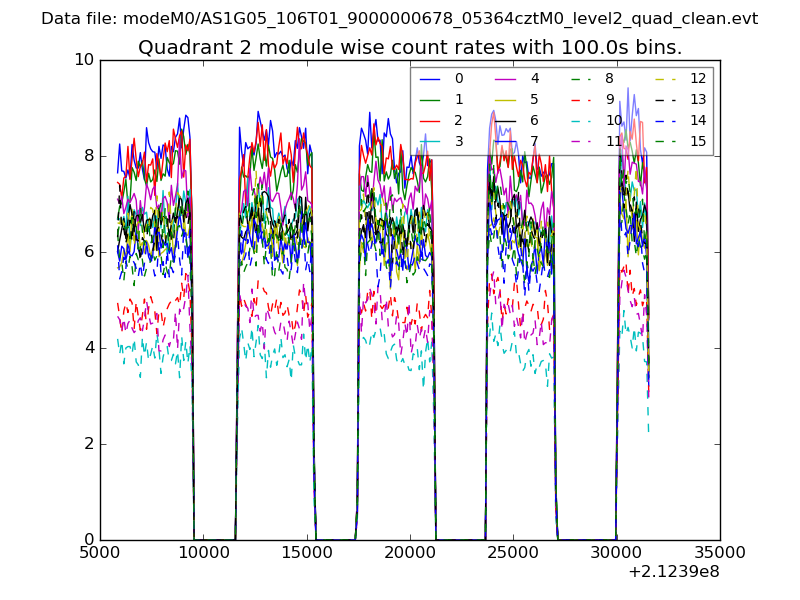
| Module-wise count rates for Quadrant B Data is divided into 100 sec bins |
 |
 |
| Module-wise count rates for Quadrant C Data is divided into 100 sec bins |
 |
 |
| Module-wise count rates for Quadrant D Data is divided into 100 sec bins |
 |
 |
| Parameter | Plot |
|---|---|
| CZT HV Monitor | 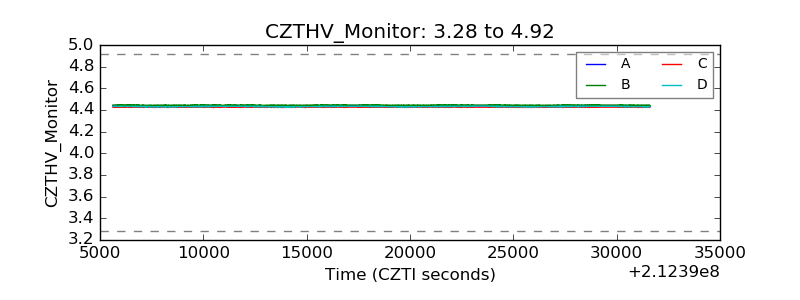 |
| D_VDD | 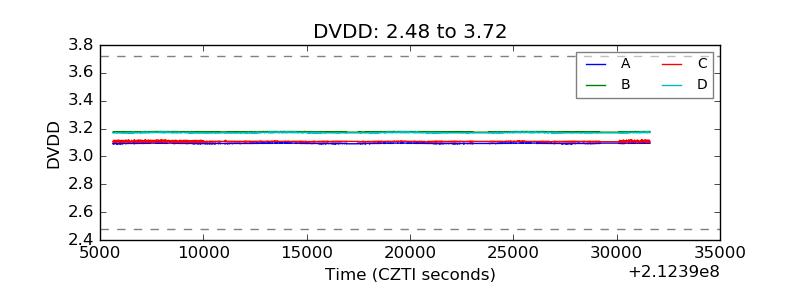 |
| Temperature 1 | 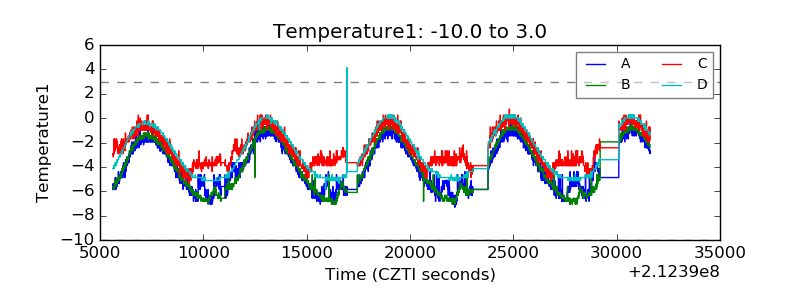 |
| Veto HV Monitor | 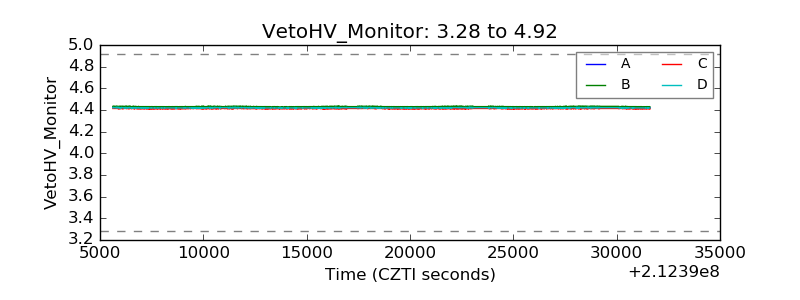 |
| Veto LLD | 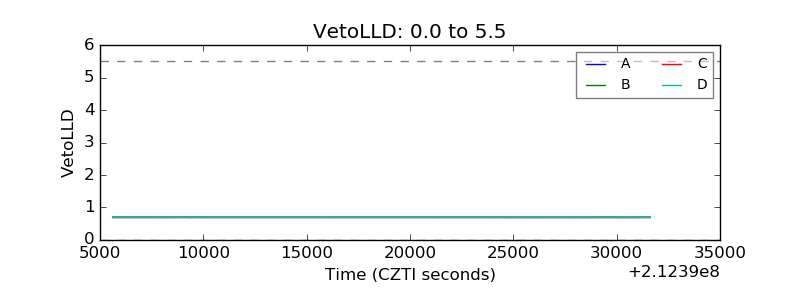 |
| Alpha Counter | 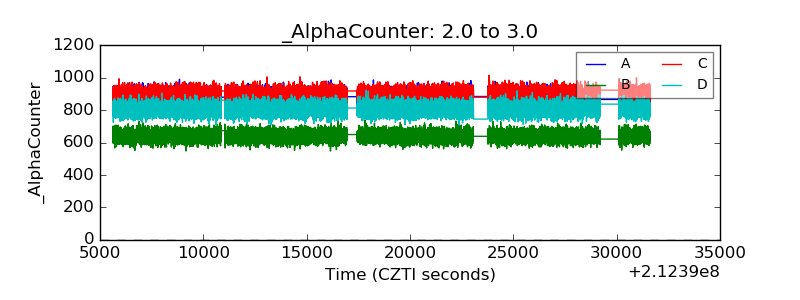 |
| _CPM_Rate | 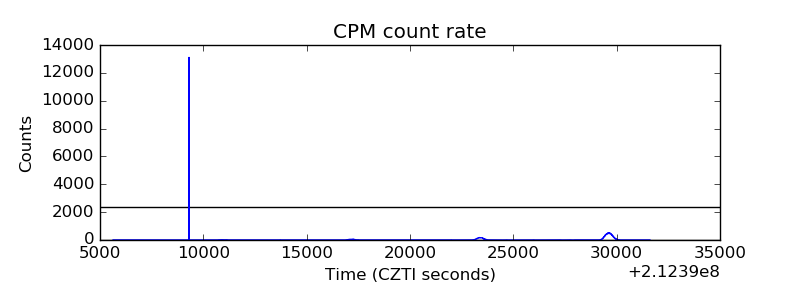 |
| CZT Counter | 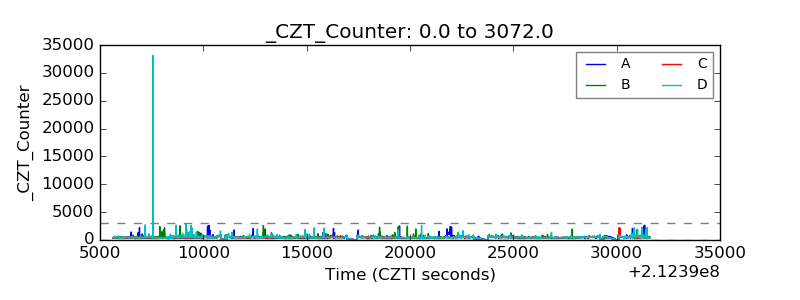 |
| +2.5 Volts monitor |  |
| +5 Volts monitor |  |
| _ROLL_ROT |  |
| _Roll_DEC | 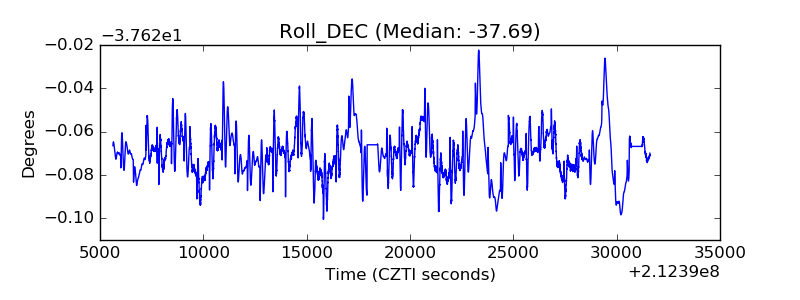 |
| _Roll_RA | 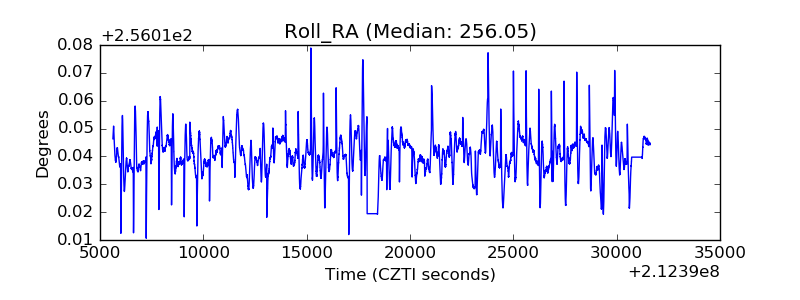 |
| Veto Counter | 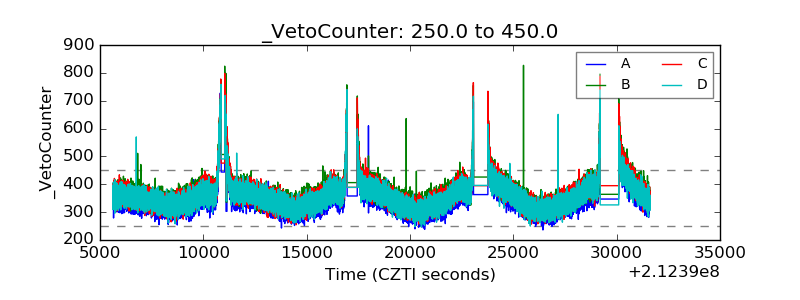 |