| Param | Original file | Final file |
|---|---|---|
| Filename | modeM0/AS1G05_106T01_9000000678_05367cztM0_level2.evt | modeM0/AS1G05_106T01_9000000678_05367cztM0_level2_quad_clean.evt |
| Size (bytes) | 128,652,480 | 31,953,600 |
| Size | 122.7 MB | 30.5 MB |
| Events in quadrant A | 892,151 | 211,894 |
| Events in quadrant B | 1,056,527 | 209,161 |
| Events in quadrant C | 912,930 | 209,330 |
| Events in quadrant D | 903,790 | 199,377 |
| Mode SS | |||
|---|---|---|---|
| Quadrant | BADHDUFLAG | Total packets | Discarded packets |
| A | 0 | 36 | 0 |
| B | 0 | 36 | 0 |
| C | 0 | 36 | 0 |
| D | 0 | 36 | 0 |
| Mode M0 | |||
|---|---|---|---|
| Quadrant | BADHDUFLAG | Total packets | Discarded packets |
| A | 0 | 3929 | 0 |
| B | 0 | 4437 | 0 |
| C | 0 | 4061 | 0 |
| D | 0 | 4015 | 0 |
| Quadrant | Total seconds | Saturated seconds | Saturation percentage |
|---|---|---|---|
| A | 1890 | 5 | 0.264550% |
| B | 1890 | 30 | 1.587302% |
| C | 1890 | 1 | 0.052910% |
| D | 1890 | 9 | 0.476190% |
Noise dominated data is calculated using 1-second bins in cleaned event files. If a bin has >2000 counts, and if more than 50% of those come from <1% of pixels, then it is considered to be noise-dominated and hence unusable.
| Quadrant | # 1 sec bins | Bins with >0 counts | Bins with >2000 counts | High rate bins dominated by noise | Noise dominated (total time) | Noise dominated (detector-on time) | Marked lightcurve |
|---|---|---|---|---|---|---|---|
| A | 1890 | 1890 | 2 | 2 | 0.11% | 0.11% | 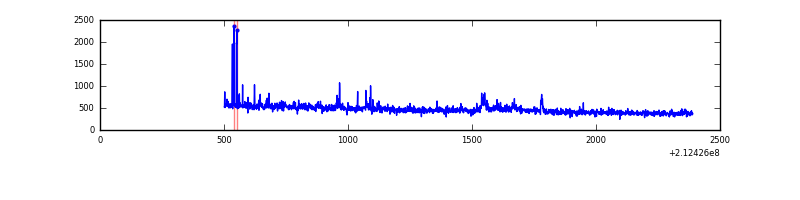 |
| B | 1890 | 1890 | 19 | 19 | 1.01% | 1.01% | 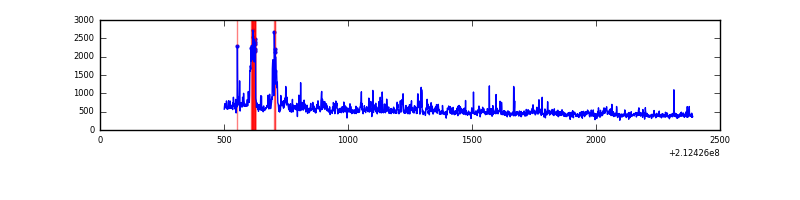 |
| C | 1890 | 1890 | 0 | 0 | 0.00% | 0.00% | 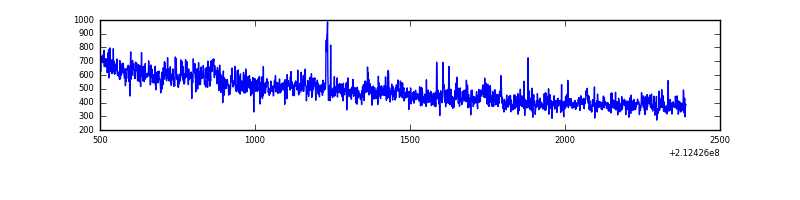 |
| D | 1890 | 1890 | 9 | 9 | 0.48% | 0.48% | 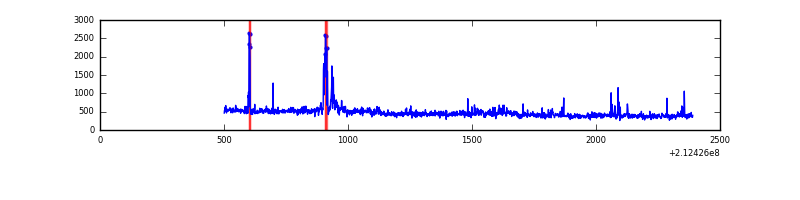 |
Top three noisy pixels from each quadrant. If the there are fewer than three noisy pixels in the level2.evt file, extra rows are filled as -1
| Pixel properties | Quadrant properties | ||||||
|---|---|---|---|---|---|---|---|
| Quadrant | DetID | PixID | Counts | Sigma | Mean | Median | Sigma |
| A | 0 | 50 | 28025 | 593.8 | 219 | 215 | 46.8 |
| A | 14 | 111 | 18148 | 382.91 | 219 | 215 | 46.8 |
| A | 12 | 194 | 2179 | 41.94 | 219 | 215 | 46.8 |
| B | 11 | 51 | 100368 | 2256.38 | 218 | 214 | 44.4 |
| B | 4 | 80 | 34535 | 773.22 | 218 | 214 | 44.4 |
| B | 4 | 172 | 24345 | 543.65 | 218 | 214 | 44.4 |
| C | 1 | 16 | 101517 | 2053.12 | 207 | 209 | 49.3 |
| C | 14 | 67 | 2881 | 54.15 | 207 | 209 | 49.3 |
| C | 13 | 61 | 1743 | 31.09 | 207 | 209 | 49.3 |
| D | 2 | 33 | 45789 | 861.05 | 208 | 201 | 52.9 |
| D | 8 | 195 | 36182 | 679.6 | 208 | 201 | 52.9 |
| D | 2 | 136 | 10012 | 185.31 | 208 | 201 | 52.9 |
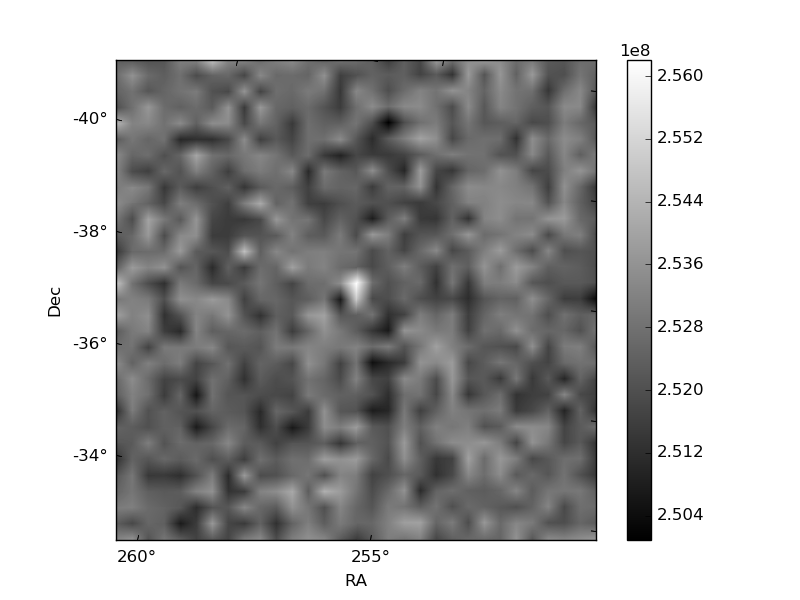
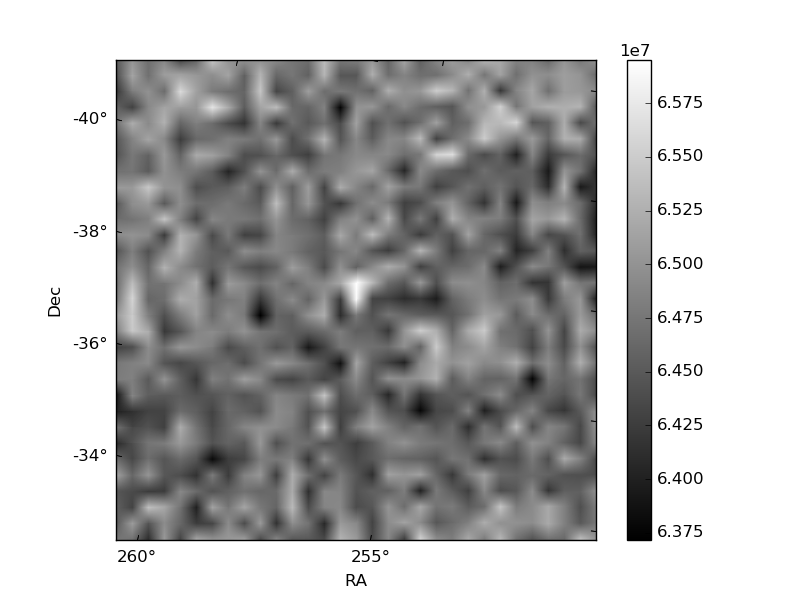
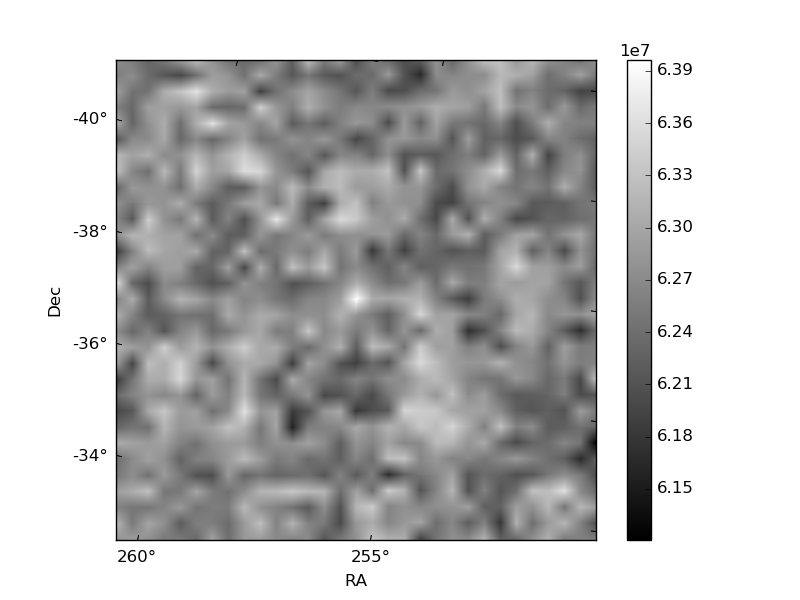
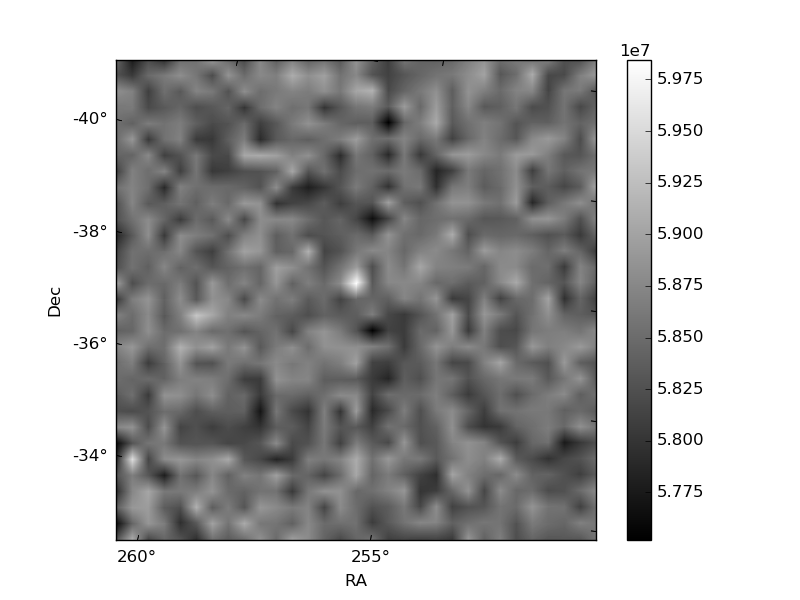
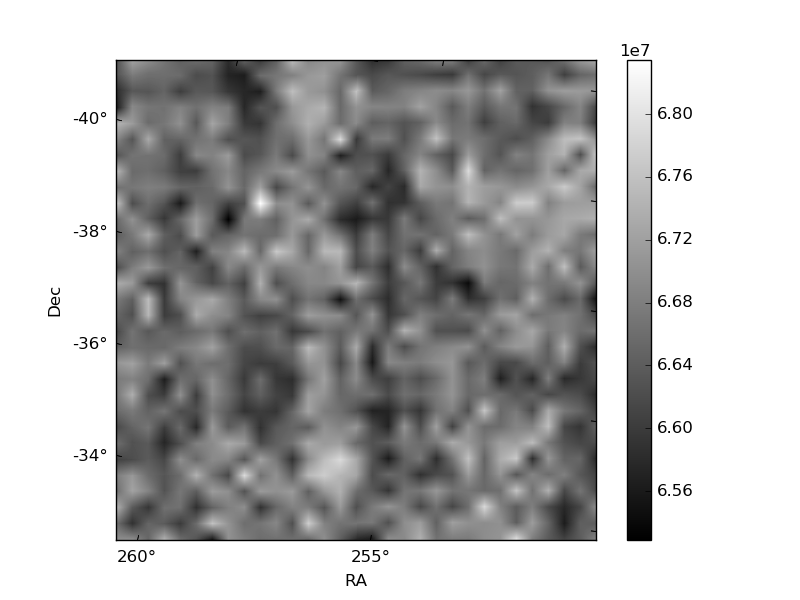
Histogram calculated using DETX and DETY for each event in the final _common_clean file
| Quadrant A | 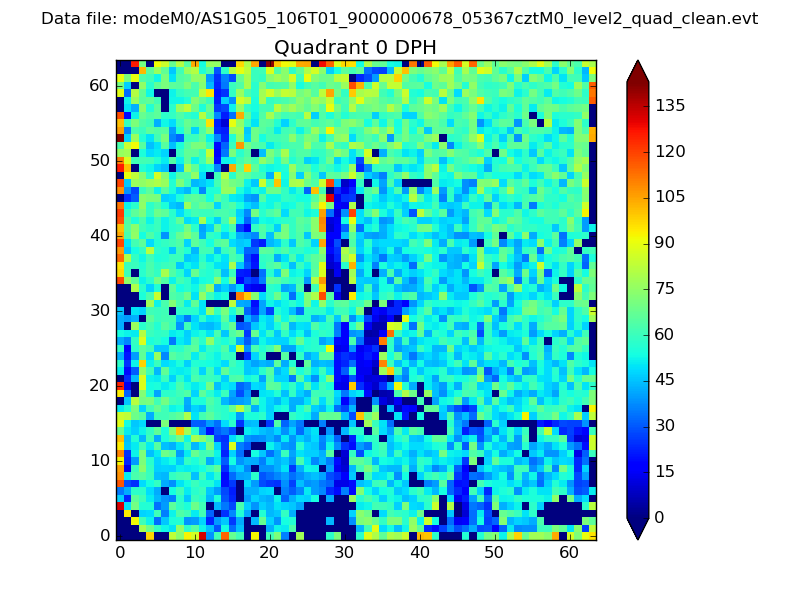 |
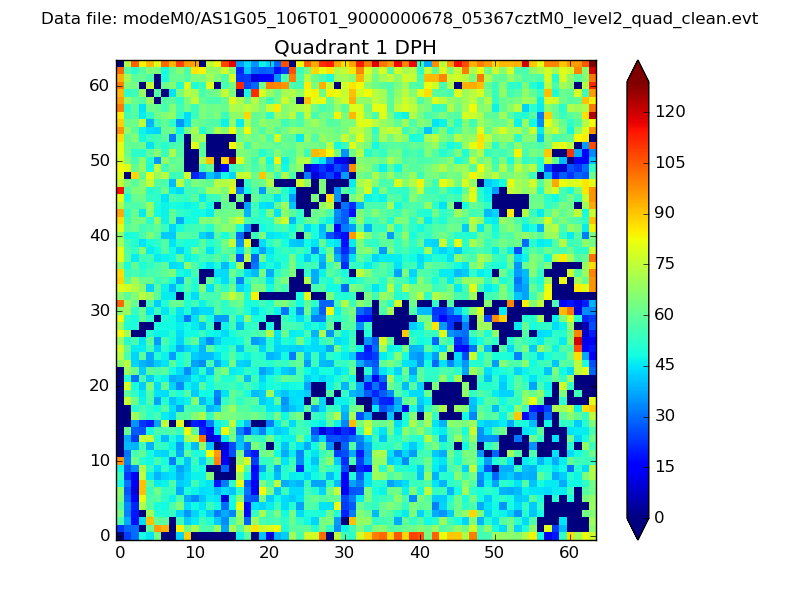 |
Quadrant B |
|---|---|---|---|
| Quadrant D | 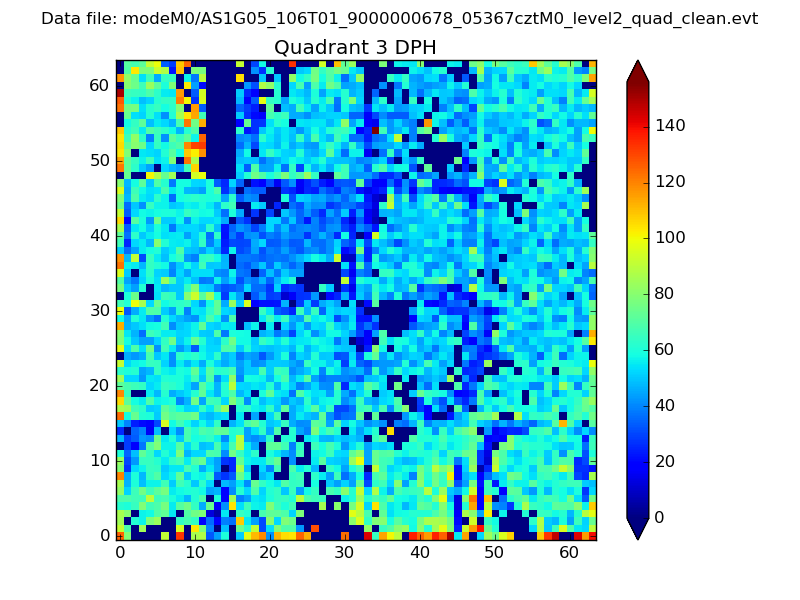 |
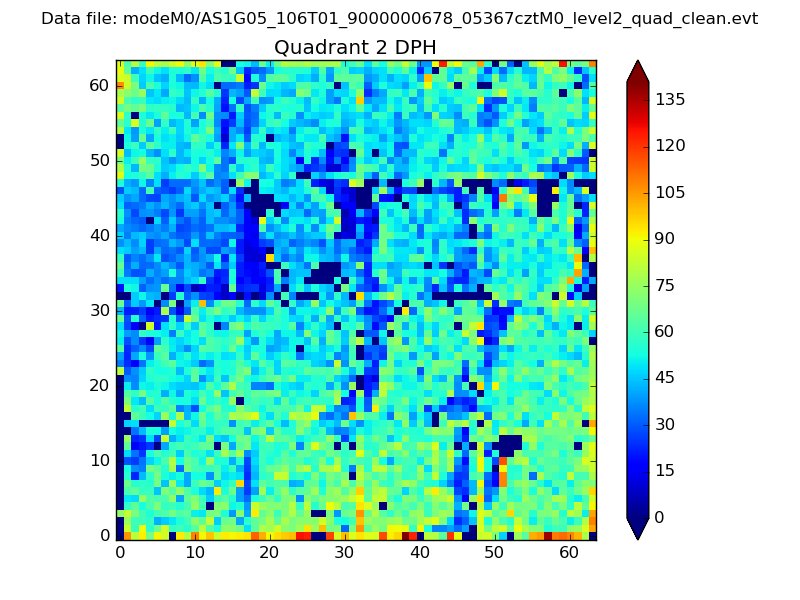 |
Quadrant C |
| Plot type | Count rate plots | Images |
|---|---|---|
| Comparison with Poisson distribution Blue bars denote a histogram of data divided into 1 sec bins. Red curve is a Poisson curve with rate = median count rate of data. |
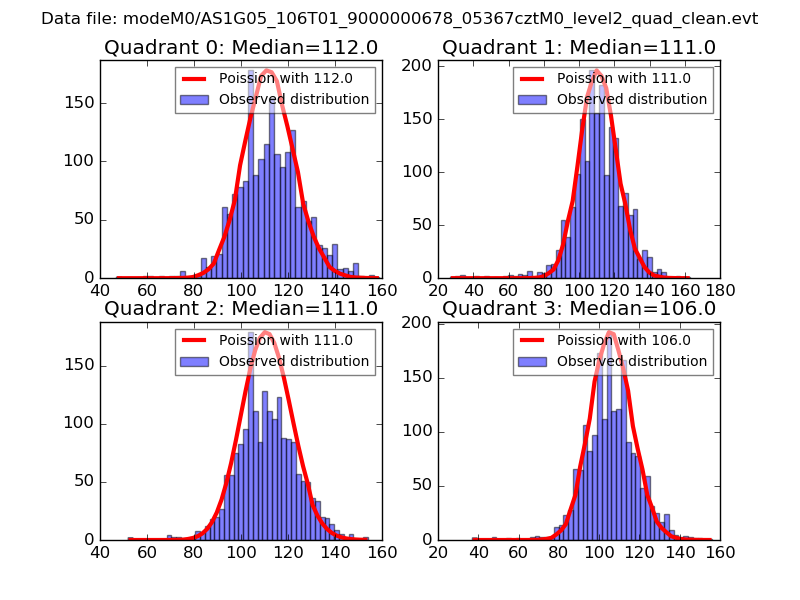 |
 |
| Quadrant-wise count rates Data is divided into 100 sec bins |
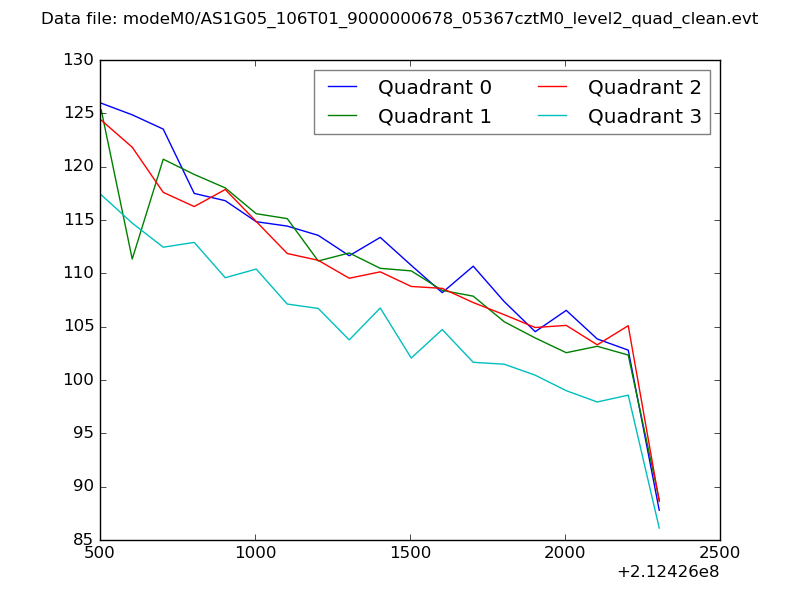 |
|
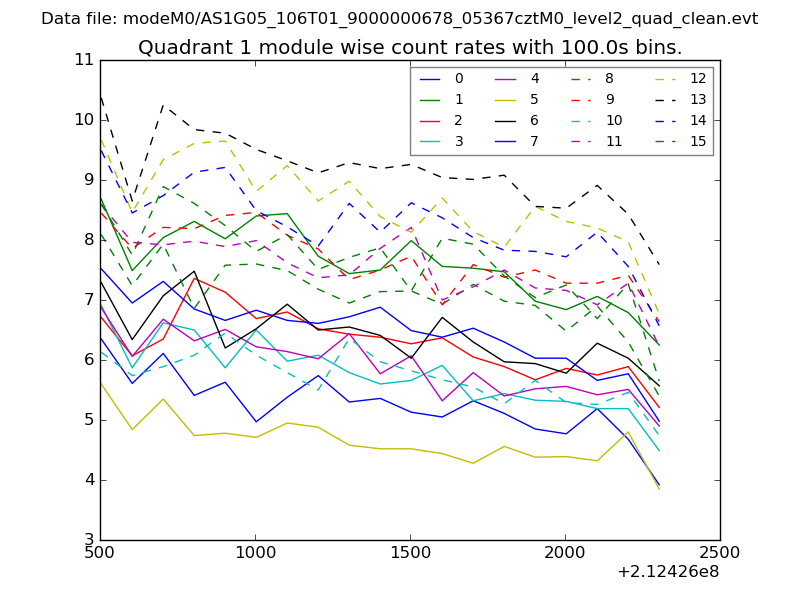
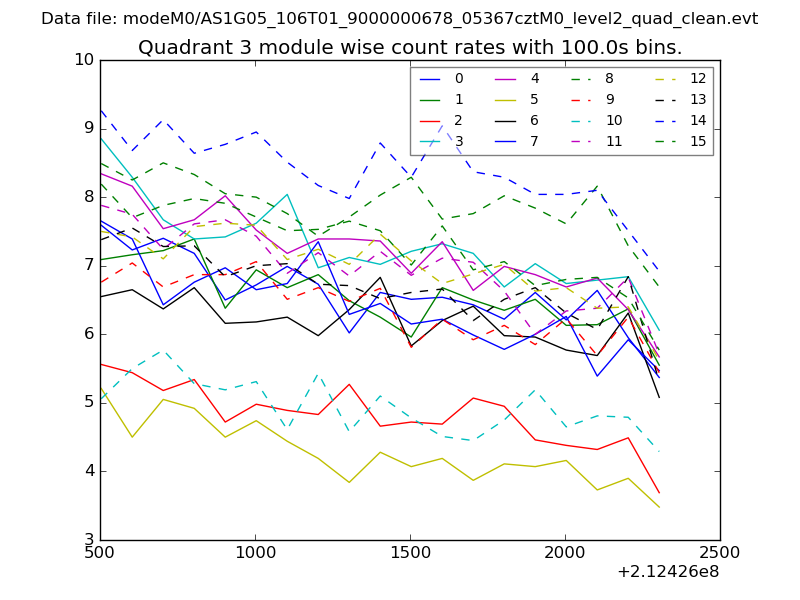
| Module-wise count rates for Quadrant A Data is divided into 100 sec bins |
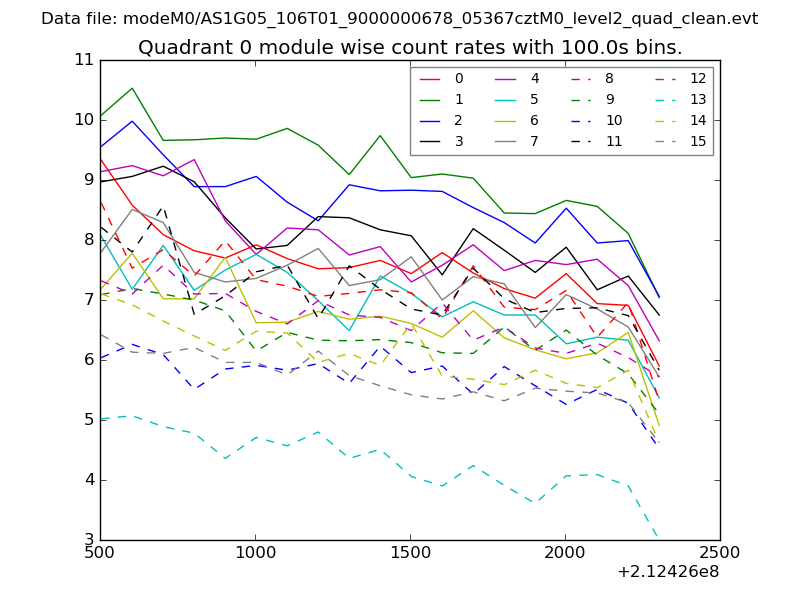 |
 |
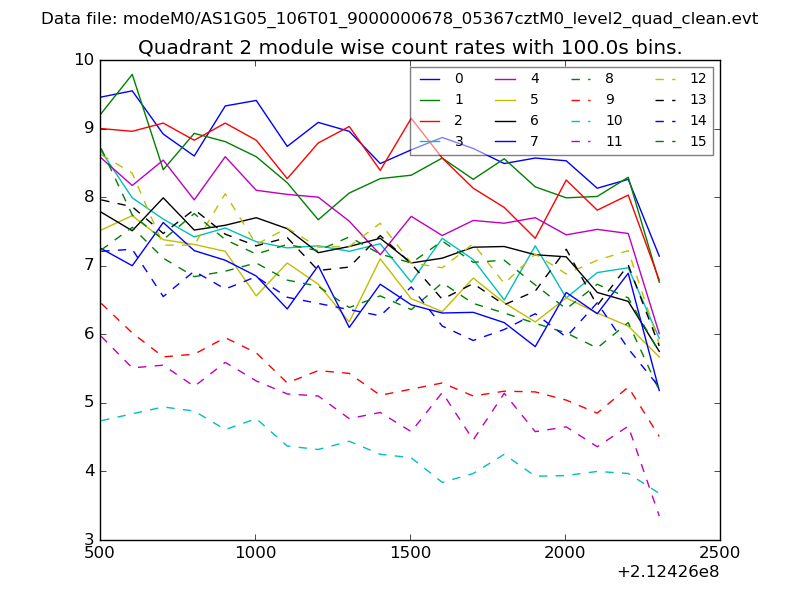
| Module-wise count rates for Quadrant B Data is divided into 100 sec bins |
 |
 |
| Module-wise count rates for Quadrant C Data is divided into 100 sec bins |
 |
 |
| Module-wise count rates for Quadrant D Data is divided into 100 sec bins |
 |
 |
| Parameter | Plot |
|---|---|
| CZT HV Monitor | 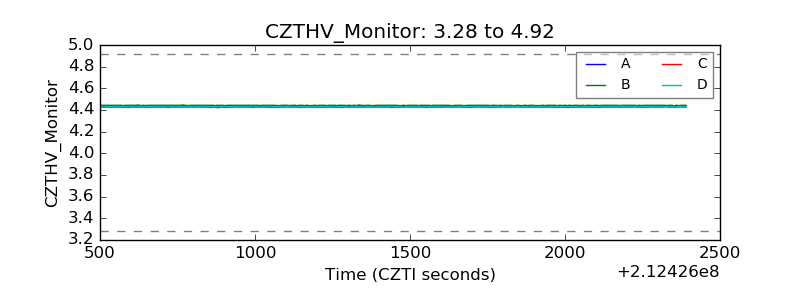 |
| D_VDD | 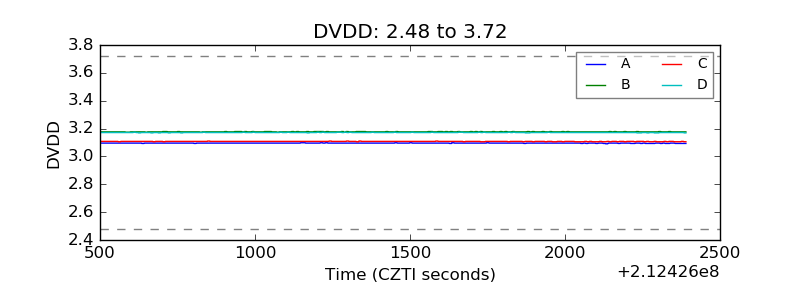 |
| Temperature 1 | 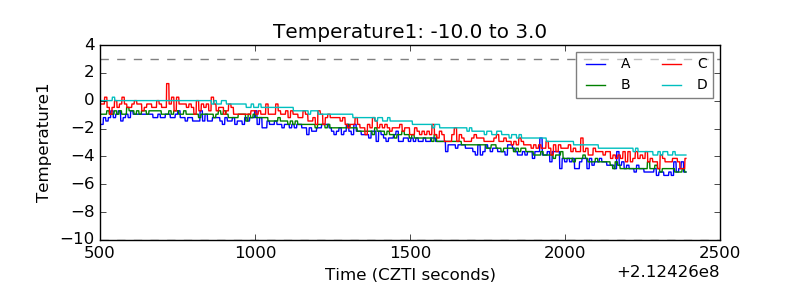 |
| Veto HV Monitor | 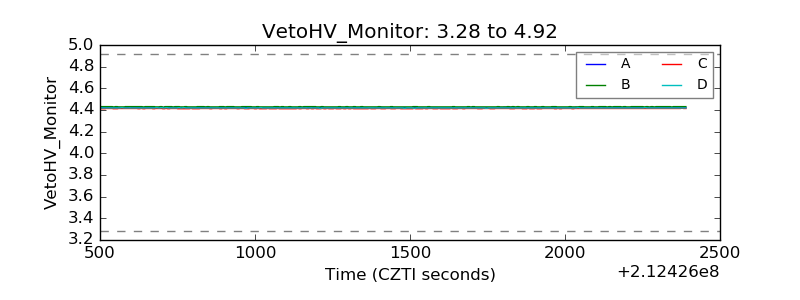 |
| Veto LLD | 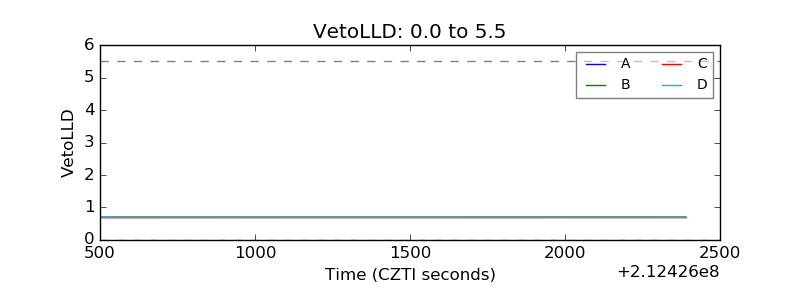 |
| Alpha Counter | 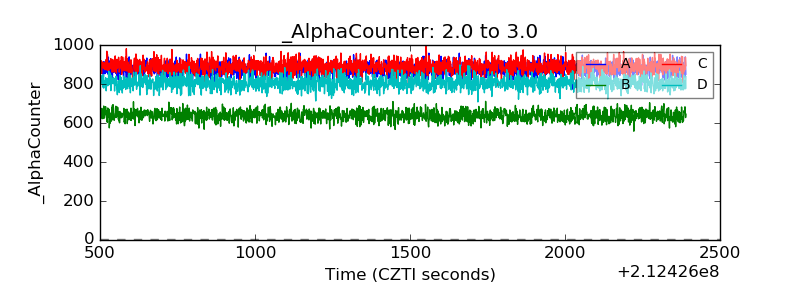 |
| _CPM_Rate | 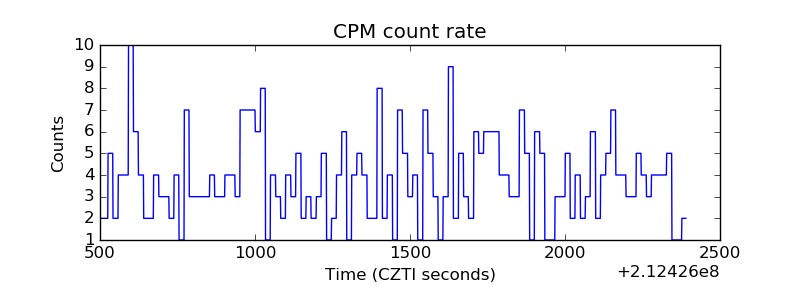 |
| CZT Counter | 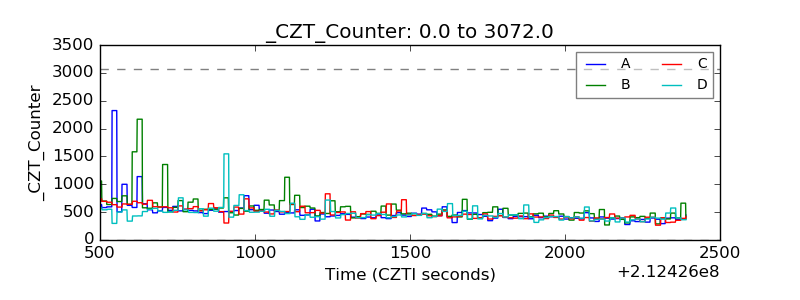 |
| +2.5 Volts monitor | 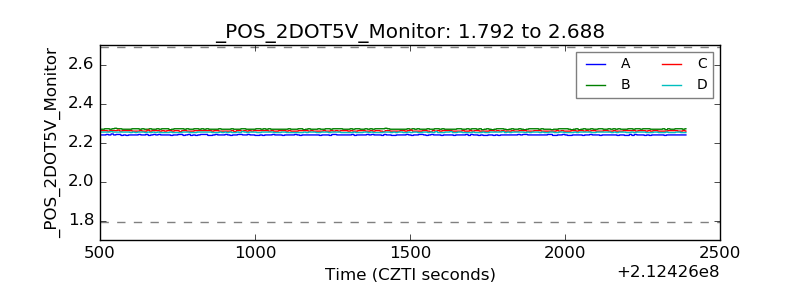 |
| +5 Volts monitor |  |
| _ROLL_ROT | 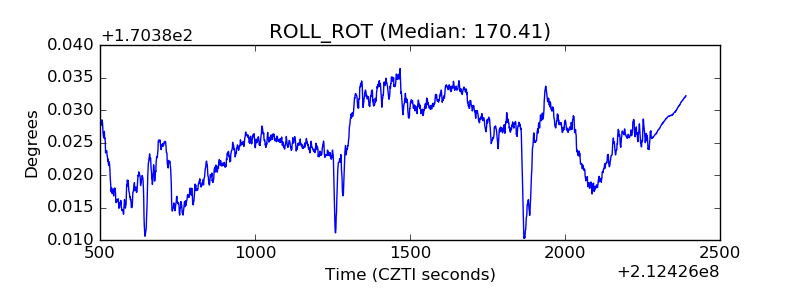 |
| _Roll_DEC | 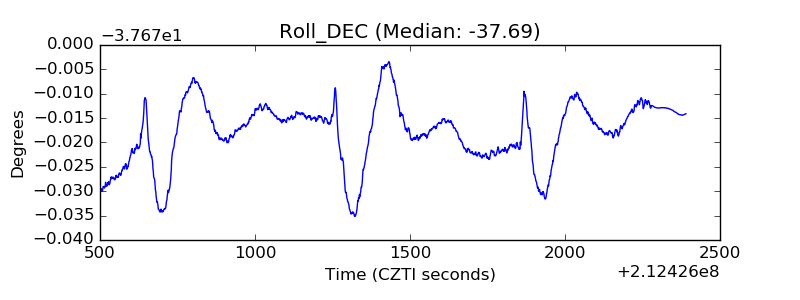 |
| _Roll_RA | 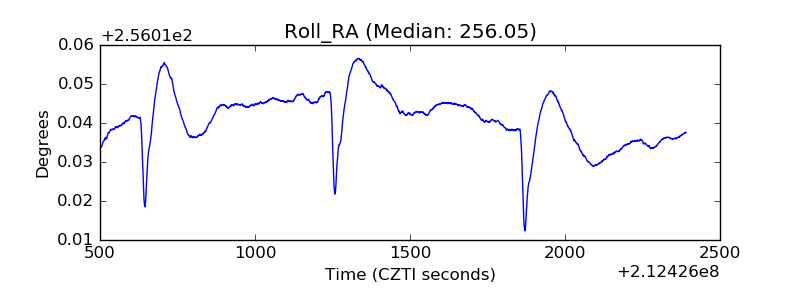 |
| Veto Counter | 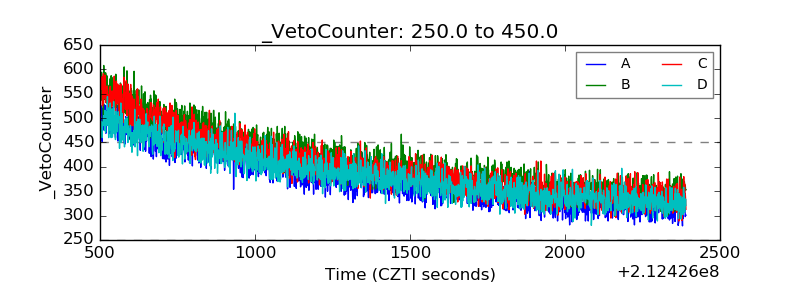 |