| Param | Original file | Final file |
|---|---|---|
| Filename | modeM0/AS1G05_021T02_9000000680cztM0_level2.fits | modeM0/AS1G05_021T02_9000000680cztM0_level2_quad_clean.evt |
| Size (bytes) | 635,451,840 | 600,586,560 |
| Size | 606.0 MB | 572.8 MB |
| Events in quadrant A | 3,807,338 | 3,464,631 |
| Events in quadrant B | 3,731,750 | 3,542,120 |
| Events in quadrant C | 3,813,576 | 3,438,190 |
| Events in quadrant D | 3,097,836 | 2,952,151 |
| Mode M0 | |||
|---|---|---|---|
| Quadrant | BADHDUFLAG | Total packets | Discarded packets |
| A | 0 | 153381 | 0 |
| B | 0 | 149469 | 0 |
| C | 0 | 148099 | 0 |
| D | 0 | 192010 | 0 |
| Mode SS | |||
|---|---|---|---|
| Quadrant | BADHDUFLAG | Total packets | Discarded packets |
| A | 0 | 1418 | 0 |
| B | 0 | 1418 | 0 |
| C | 0 | 1418 | 0 |
| D | 0 | 1418 | 0 |
| Mode M9 | |||
|---|---|---|---|
| Quadrant | BADHDUFLAG | Total packets | Discarded packets |
| A | 0 | 104 | 0 |
| B | 0 | 104 | 0 |
| C | 0 | 104 | 0 |
| D | 0 | 104 | 0 |
| Quadrant | Total seconds | Saturated seconds | Saturation percentage |
|---|---|---|---|
| A | 69877 | 1646 | 2.355568% |
| B | 69881 | 1223 | 1.750118% |
| C | 69877 | 864 | 1.236458% |
| D | 69865 | 4824 | 6.904745% |
Noise dominated data is calculated using 1-second bins in cleaned event files. If a bin has >2000 counts, and if more than 50% of those come from <1% of pixels, then it is considered to be noise-dominated and hence unusable.
| Quadrant | # 1 sec bins | Bins with >0 counts | Bins with >2000 counts | High rate bins dominated by noise | Noise dominated (total time) | Noise dominated (detector-on time) | Marked lightcurve |
|---|---|---|---|---|---|---|---|
| A | 80244 | 69865 | 0 | 0 | 0.00% | 0.00% |  |
| B | 80243 | 69872 | 0 | 0 | 0.00% | 0.00% |  |
| C | 80243 | 69872 | 0 | 0 | 0.00% | 0.00% |  |
| D | 80244 | 69555 | 0 | 0 | 0.00% | 0.00% | 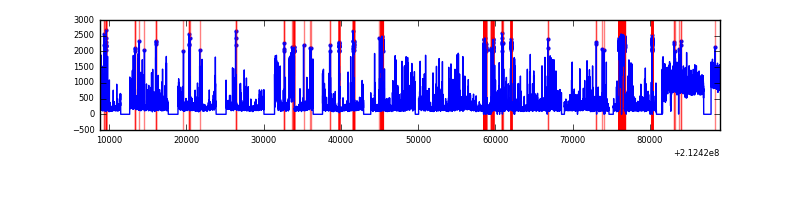 |
Top three noisy pixels from each quadrant. If the there are fewer than three noisy pixels in the level2.evt file, extra rows are filled as -1
| Pixel properties | Quadrant properties | ||||||
|---|---|---|---|---|---|---|---|
| Quadrant | DetID | PixID | Counts | Sigma | Mean | Median | Sigma |
| A | 14 | 188 | 3790 | 11.22 | 986 | 918 | 256.0 |
| A | 0 | 29 | 3767 | 11.13 | 986 | 918 | 256.0 |
| A | 7 | 110 | 3355 | 9.52 | 986 | 918 | 256.0 |
| B | 2 | 9 | 3290 | 11.68 | 985 | 933 | 201.8 |
| B | 12 | 226 | 2646 | 8.49 | 985 | 933 | 201.8 |
| B | 5 | 128 | 2581 | 8.17 | 985 | 933 | 201.8 |
| C | 1 | 80 | 2756 | 6.8 | 1005 | 926 | 268.9 |
| C | 12 | 241 | 2729 | 6.7 | 1005 | 926 | 268.9 |
| C | 1 | 81 | 2688 | 6.55 | 1005 | 926 | 268.9 |
| D | 11 | 82 | 2369 | 6.62 | 882 | 798 | 237.2 |
| D | 6 | 231 | 2307 | 6.36 | 882 | 798 | 237.2 |
| D | 3 | 14 | 2300 | 6.33 | 882 | 798 | 237.2 |
Histogram calculated using DETX and DETY for each event in the final _common_clean file
| Quadrant A | 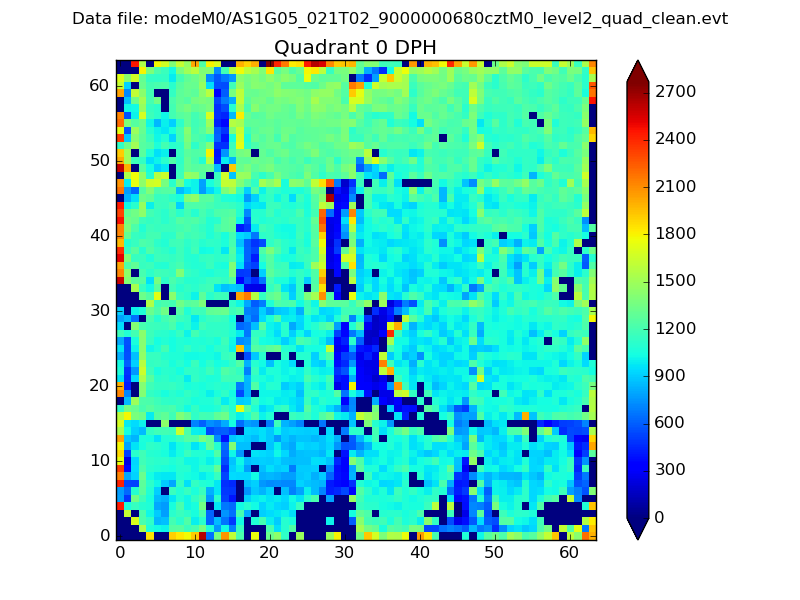 |
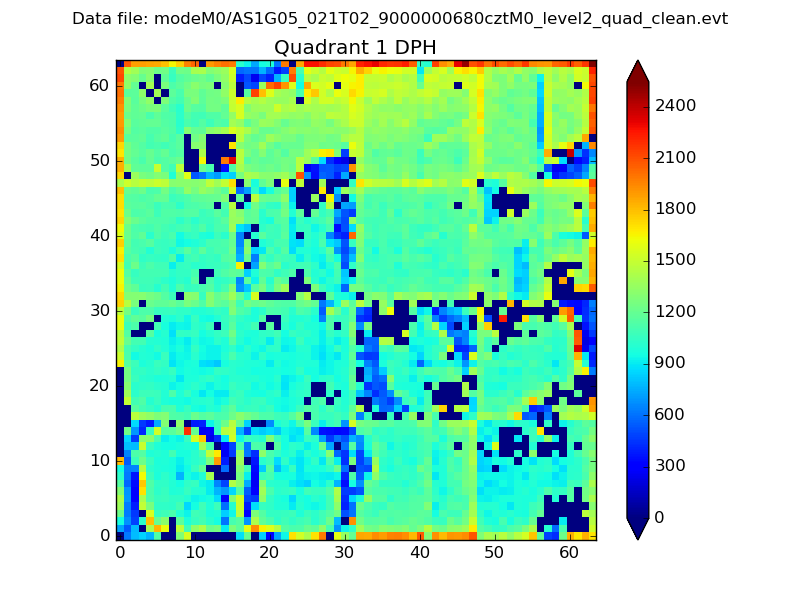 |
Quadrant B |
|---|---|---|---|
| Quadrant D | 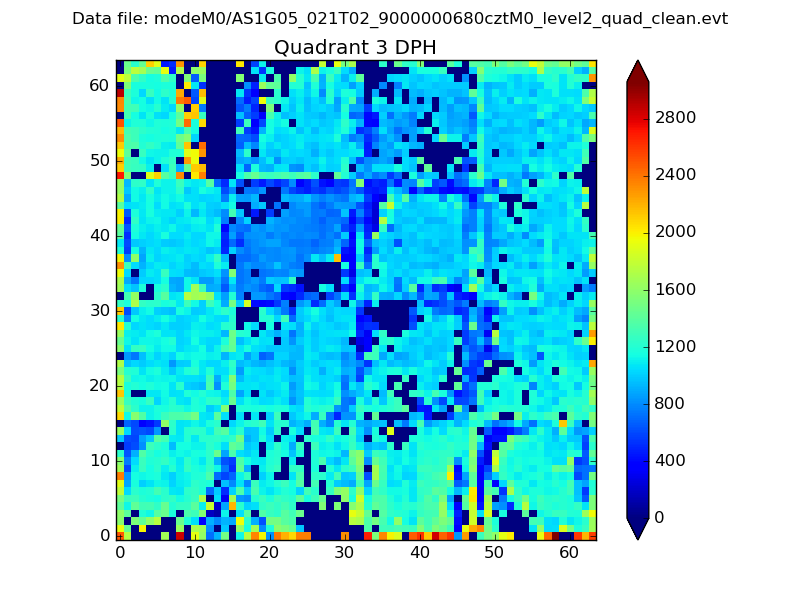 |
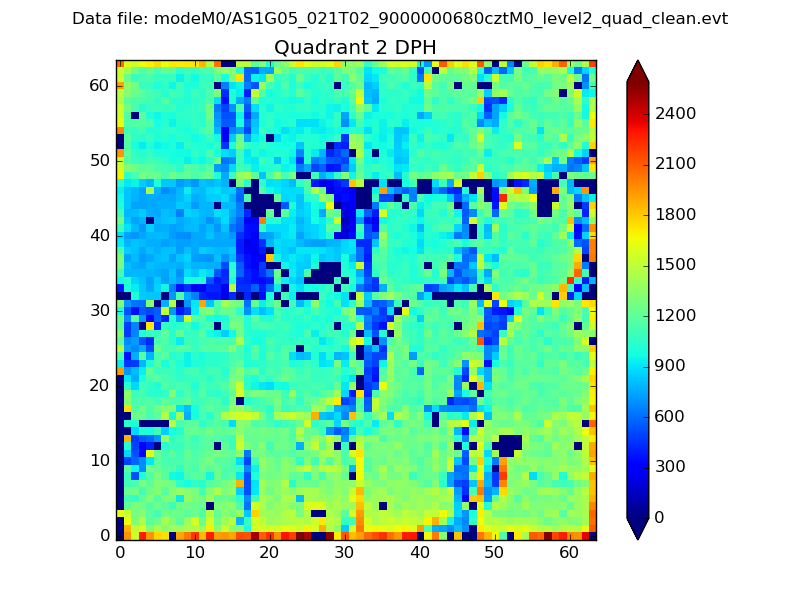 |
Quadrant C |
| Plot type | Count rate plots | Images |
|---|---|---|
| Comparison with Poisson distribution Blue bars denote a histogram of data divided into 1 sec bins. Red curve is a Poisson curve with rate = median count rate of data. |
 |
 |
| Quadrant-wise count rates Data is divided into 100 sec bins |
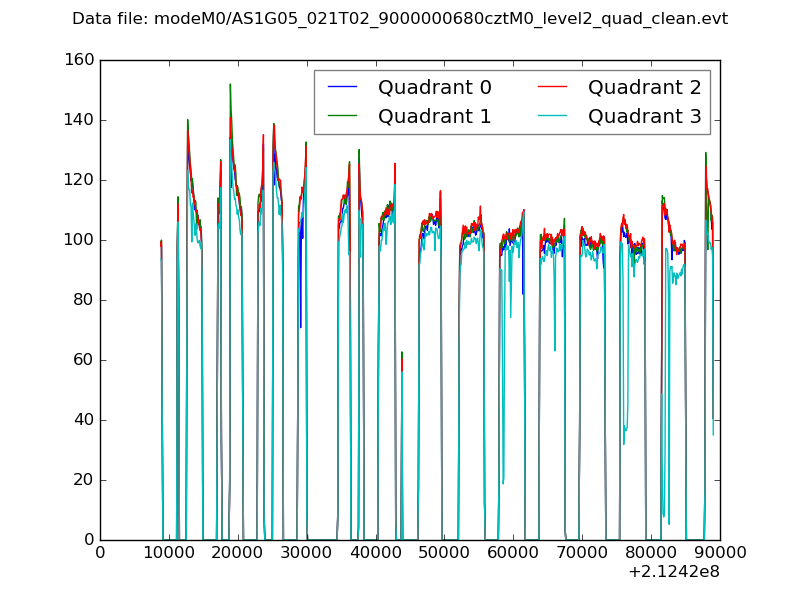 |
|
| Module-wise count rates for Quadrant A Data is divided into 100 sec bins |
 |
 |
| Module-wise count rates for Quadrant B Data is divided into 100 sec bins |
 |
 |
| Module-wise count rates for Quadrant C Data is divided into 100 sec bins |
 |
 |
| Module-wise count rates for Quadrant D Data is divided into 100 sec bins |
 |
 |
| Parameter | Plot |
|---|---|
| CZT HV Monitor |  |
| D_VDD |  |
| Temperature 1 | 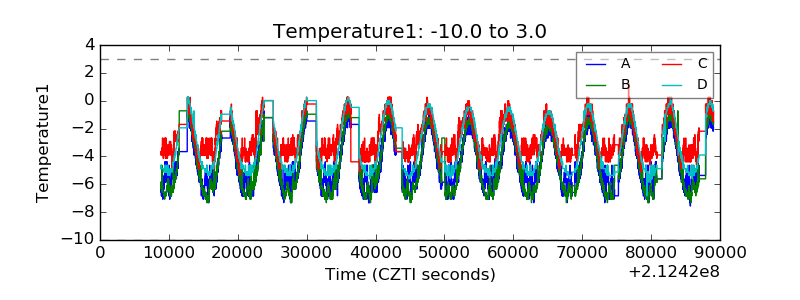 |
| Veto HV Monitor |  |
| Veto LLD | 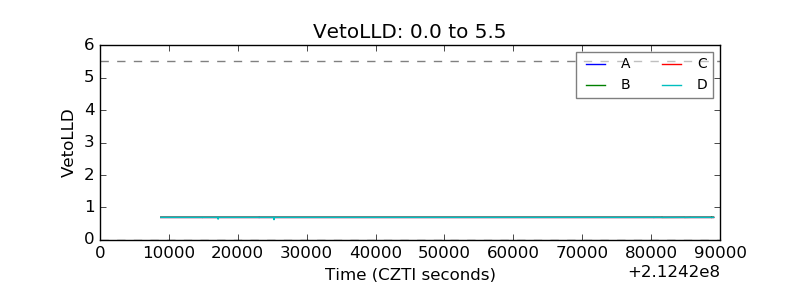 |
| Alpha Counter |  |
| _CPM_Rate |  |
| CZT Counter | 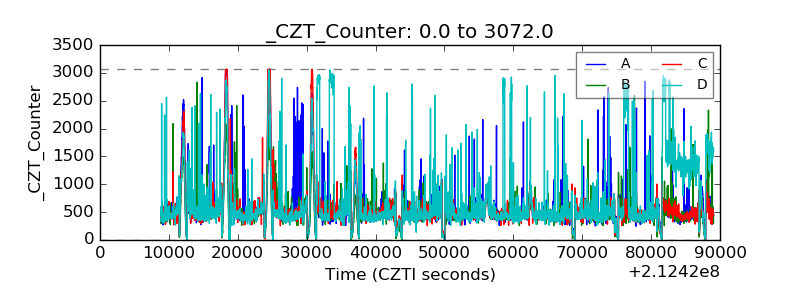 |
| +2.5 Volts monitor |  |
| +5 Volts monitor |  |
| _ROLL_ROT |  |
| _Roll_DEC |  |
| _Roll_RA |  |
| Veto Counter | 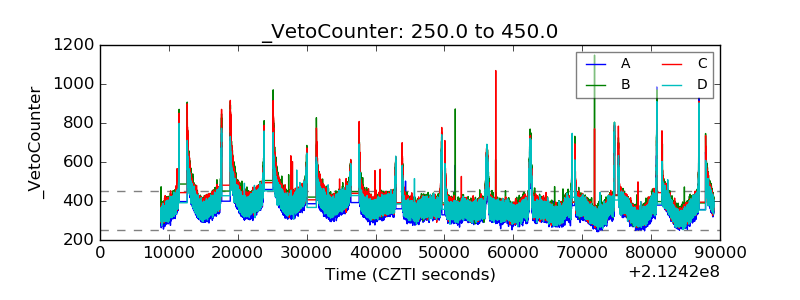 |