| Param | Original file | Final file |
|---|---|---|
| Filename | modeM0/AS1G05_021T02_9000000680_05369cztM0_level2.evt | modeM0/AS1G05_021T02_9000000680_05369cztM0_level2_quad_clean.evt |
| Size (bytes) | 455,054,400 | 78,600,960 |
| Size | 434.0 MB | 75.0 MB |
| Events in quadrant A | 3,277,268 | 485,305 |
| Events in quadrant B | 3,448,004 | 502,364 |
| Events in quadrant C | 3,522,249 | 493,538 |
| Events in quadrant D | 3,110,584 | 464,104 |
| Mode M0 | |||
|---|---|---|---|
| Quadrant | BADHDUFLAG | Total packets | Discarded packets |
| A | 0 | 13872 | 3 |
| B | 0 | 14351 | 2 |
| C | 0 | 14429 | 2 |
| D | 0 | 13525 | 2 |
| Mode SS | |||
|---|---|---|---|
| Quadrant | BADHDUFLAG | Total packets | Discarded packets |
| A | 0 | 126 | 0 |
| B | 0 | 126 | 0 |
| C | 0 | 126 | 0 |
| D | 0 | 126 | 0 |
| Mode M9 | |||
|---|---|---|---|
| Quadrant | BADHDUFLAG | Total packets | Discarded packets |
| A | 0 | 18 | 0 |
| B | 0 | 18 | 0 |
| C | 0 | 18 | 0 |
| D | 0 | 19 | 0 |
| Quadrant | Total seconds | Saturated seconds | Saturation percentage |
|---|---|---|---|
| A | 6231 | 145 | 2.327074% |
| B | 6231 | 81 | 1.299952% |
| C | 6231 | 50 | 0.802439% |
| D | 6231 | 60 | 0.962927% |
Noise dominated data is calculated using 1-second bins in cleaned event files. If a bin has >2000 counts, and if more than 50% of those come from <1% of pixels, then it is considered to be noise-dominated and hence unusable.
| Quadrant | # 1 sec bins | Bins with >0 counts | Bins with >2000 counts | High rate bins dominated by noise | Noise dominated (total time) | Noise dominated (detector-on time) | Marked lightcurve |
|---|---|---|---|---|---|---|---|
| A | 7536 | 6231 | 65 | 65 | 0.86% | 1.04% | 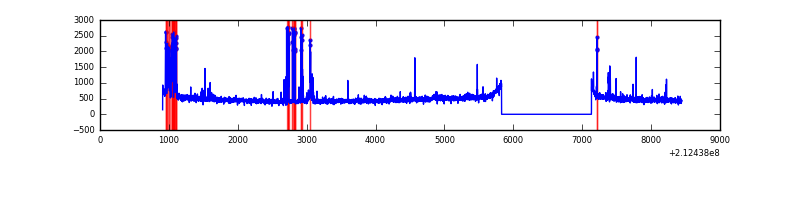 |
| B | 7536 | 6231 | 12 | 12 | 0.16% | 0.19% | 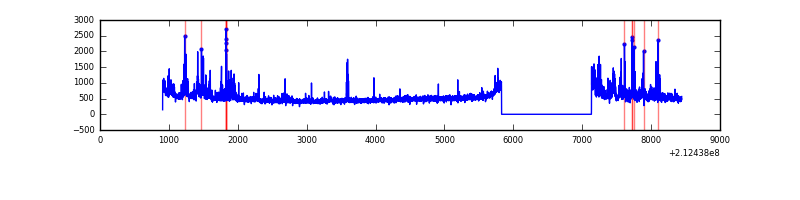 |
| C | 7536 | 6231 | 4 | 4 | 0.05% | 0.06% | 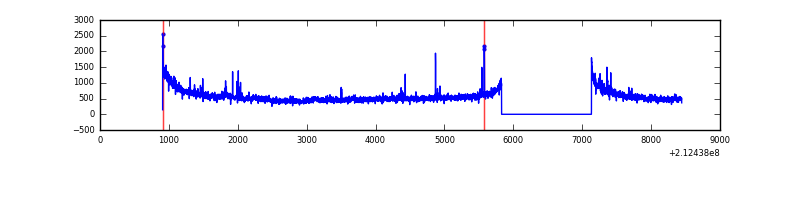 |
| D | 7536 | 6232 | 29 | 29 | 0.38% | 0.47% | 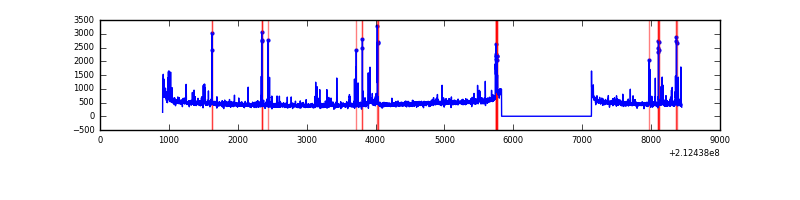 |
Top three noisy pixels from each quadrant. If the there are fewer than three noisy pixels in the level2.evt file, extra rows are filled as -1
| Pixel properties | Quadrant properties | ||||||
|---|---|---|---|---|---|---|---|
| Quadrant | DetID | PixID | Counts | Sigma | Mean | Median | Sigma |
| A | 0 | 50 | 226615 | 1458.52 | 754 | 740 | 154.9 |
| A | 15 | 174 | 76870 | 491.59 | 754 | 740 | 154.9 |
| A | 13 | 251 | 40740 | 258.29 | 754 | 740 | 154.9 |
| B | 4 | 80 | 202381 | 1375.02 | 774 | 757 | 146.6 |
| B | 0 | 219 | 71625 | 483.3 | 774 | 757 | 146.6 |
| B | 11 | 51 | 51227 | 344.19 | 774 | 757 | 146.6 |
| C | 1 | 16 | 559630 | 3313.39 | 736 | 743 | 168.7 |
| C | 9 | 247 | 75543 | 443.46 | 736 | 743 | 168.7 |
| C | 14 | 67 | 10079 | 55.35 | 736 | 743 | 168.7 |
| D | 4 | 95 | 143207 | 803.61 | 724 | 703 | 177.3 |
| D | 8 | 195 | 81708 | 456.8 | 724 | 703 | 177.3 |
| D | 2 | 14 | 49650 | 276.02 | 724 | 703 | 177.3 |
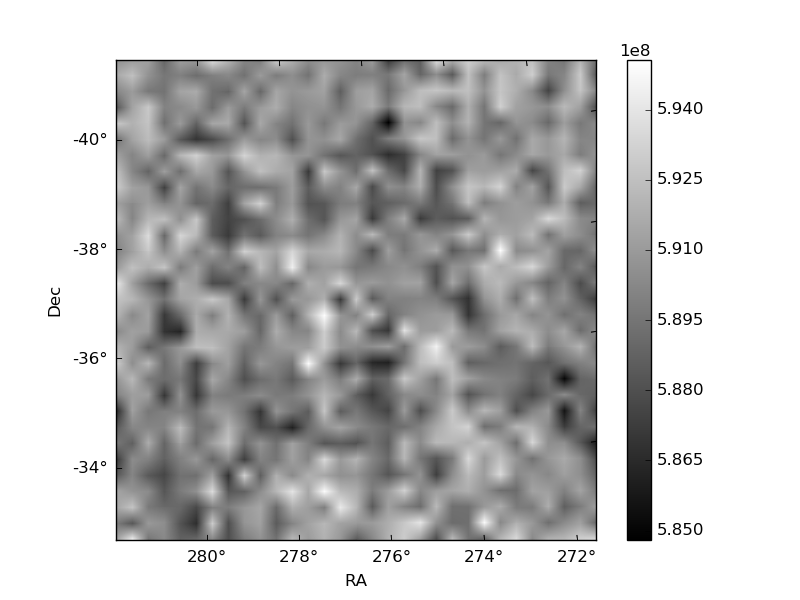
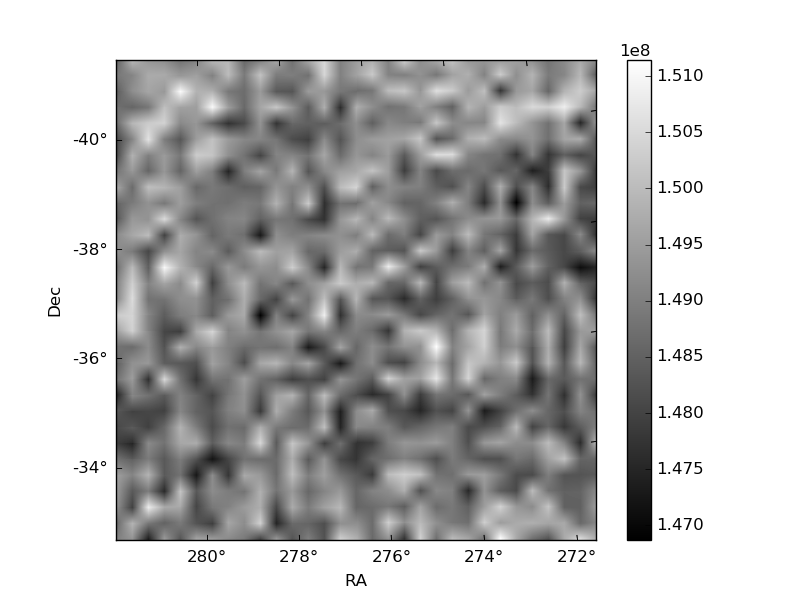
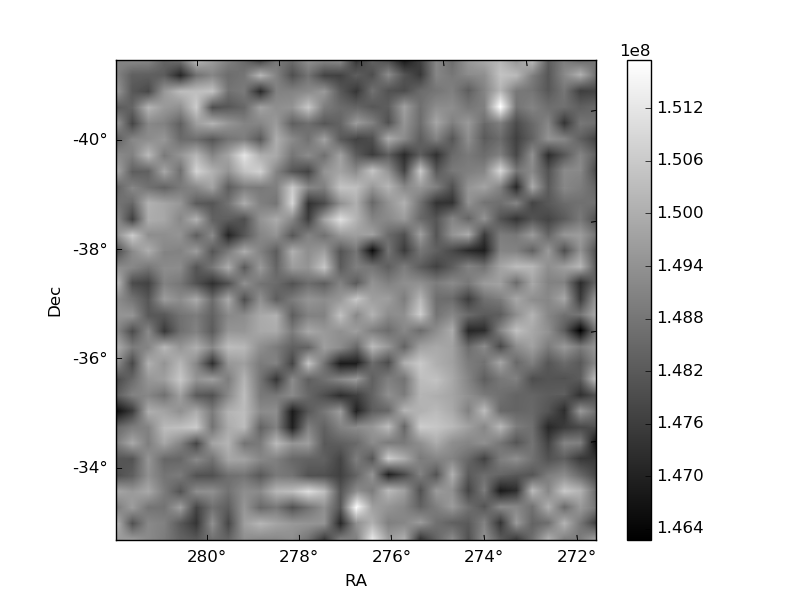
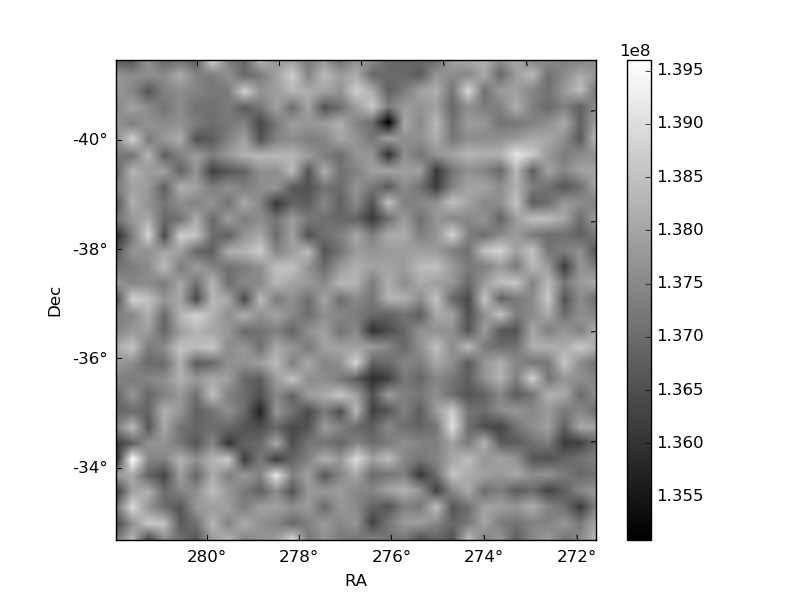
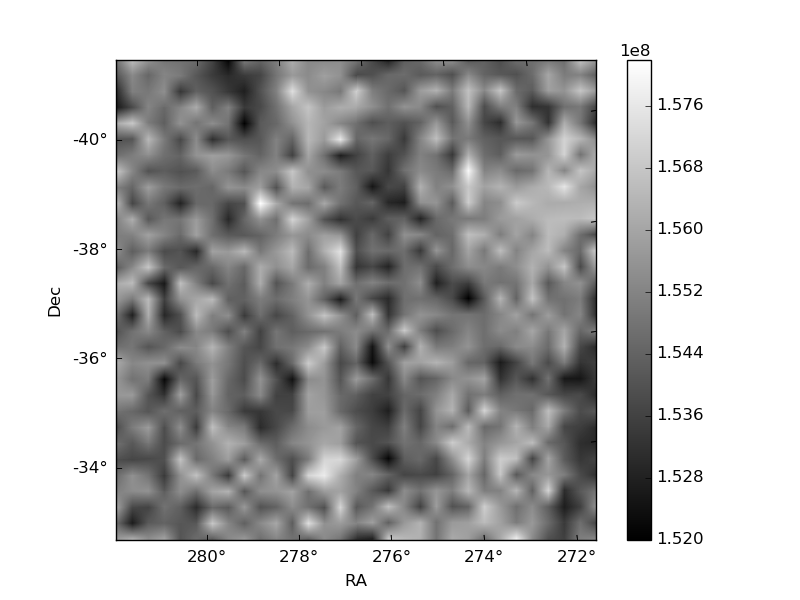
Histogram calculated using DETX and DETY for each event in the final _common_clean file
| Quadrant A | 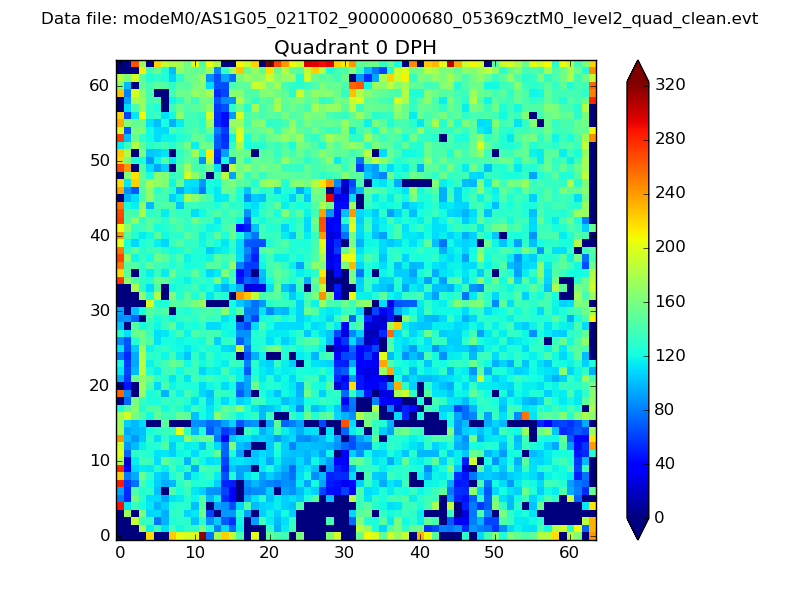 |
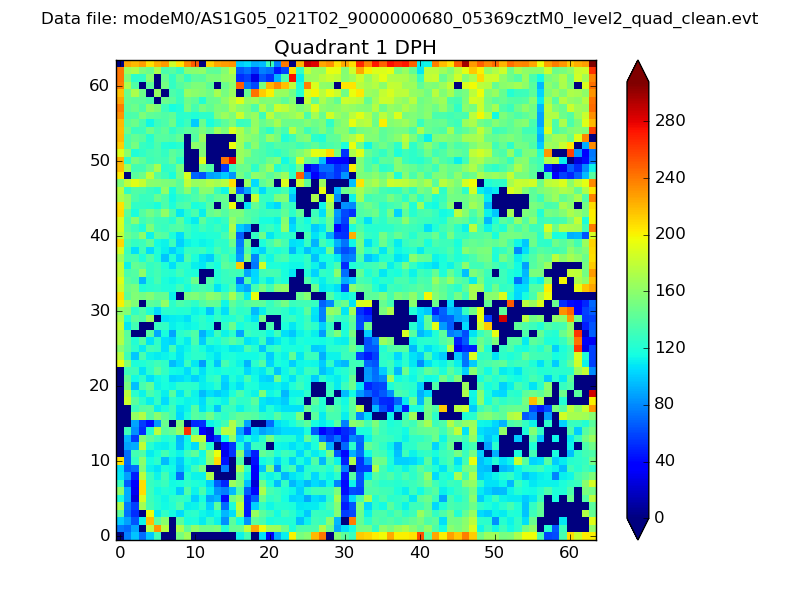 |
Quadrant B |
|---|---|---|---|
| Quadrant D | 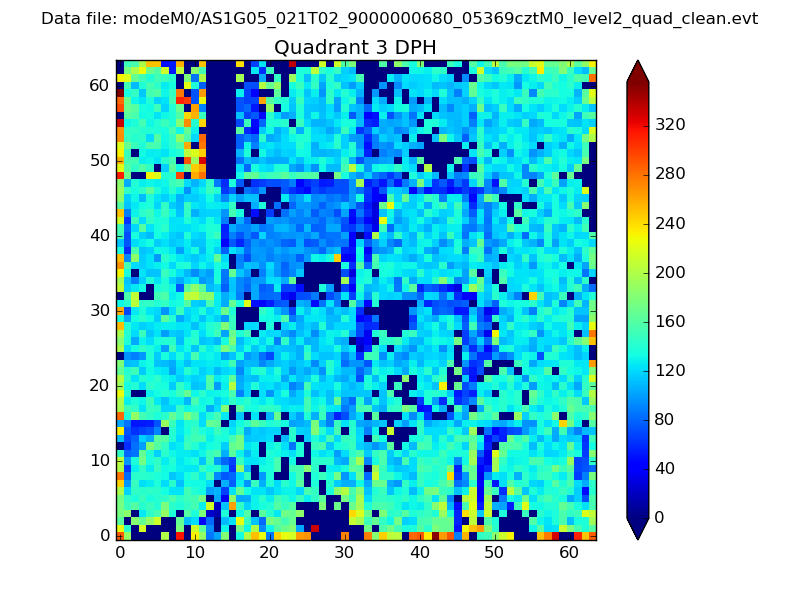 |
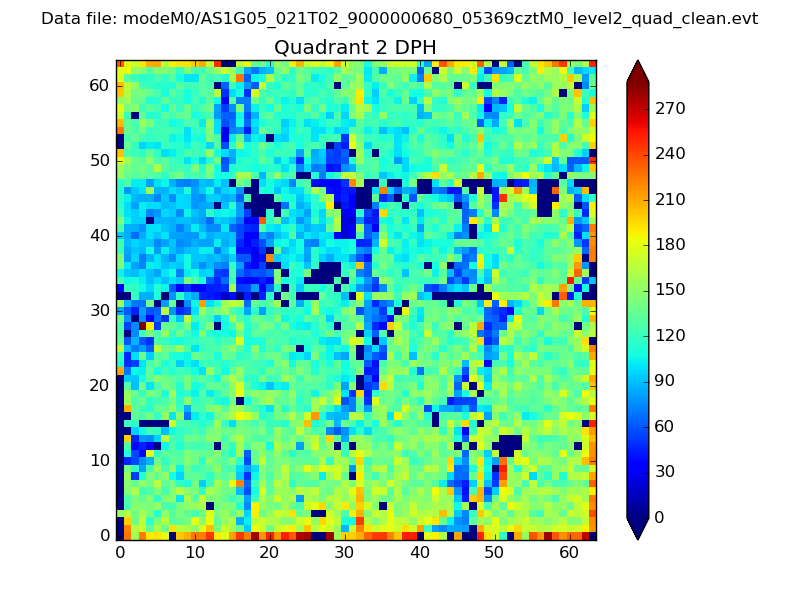 |
Quadrant C |
| Plot type | Count rate plots | Images |
|---|---|---|
| Comparison with Poisson distribution Blue bars denote a histogram of data divided into 1 sec bins. Red curve is a Poisson curve with rate = median count rate of data. |
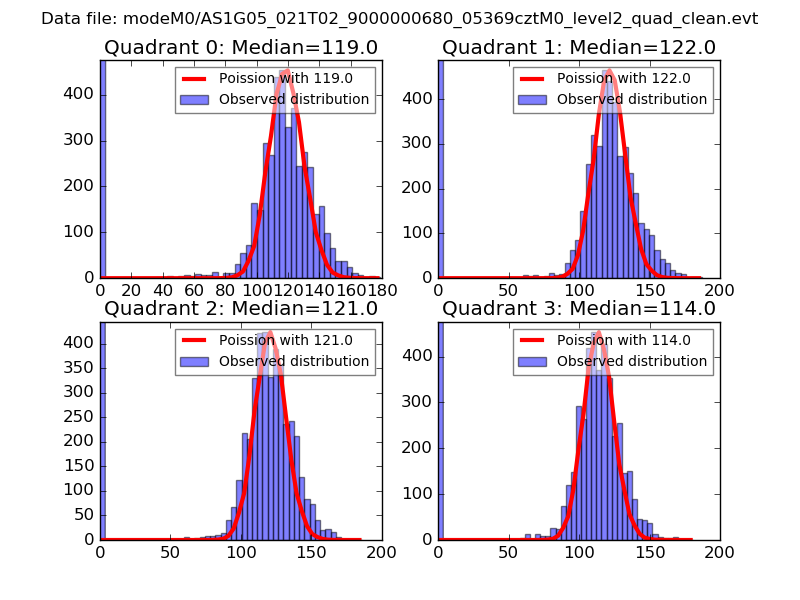 |
 |
| Quadrant-wise count rates Data is divided into 100 sec bins |
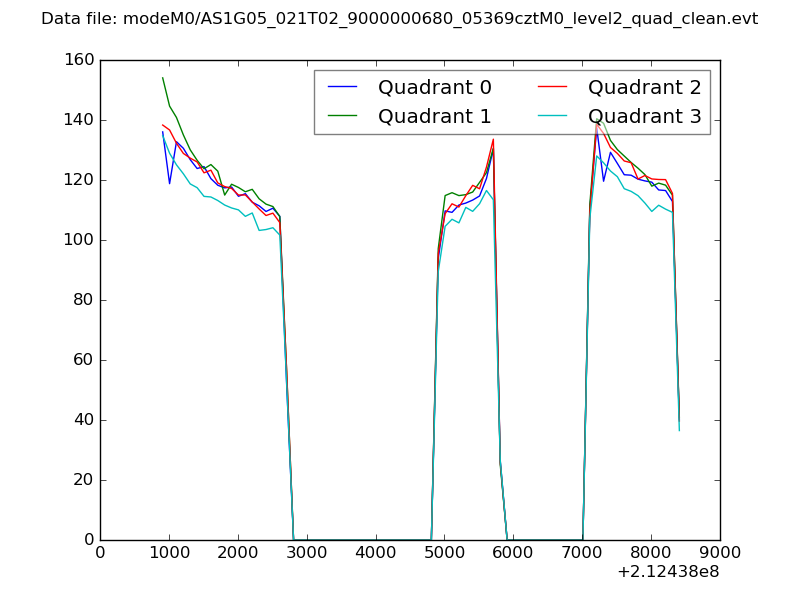 |
|
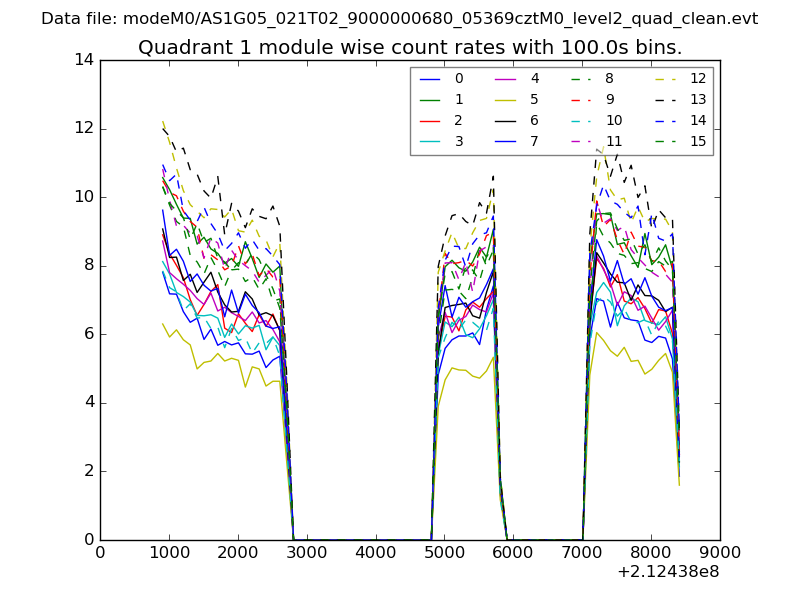
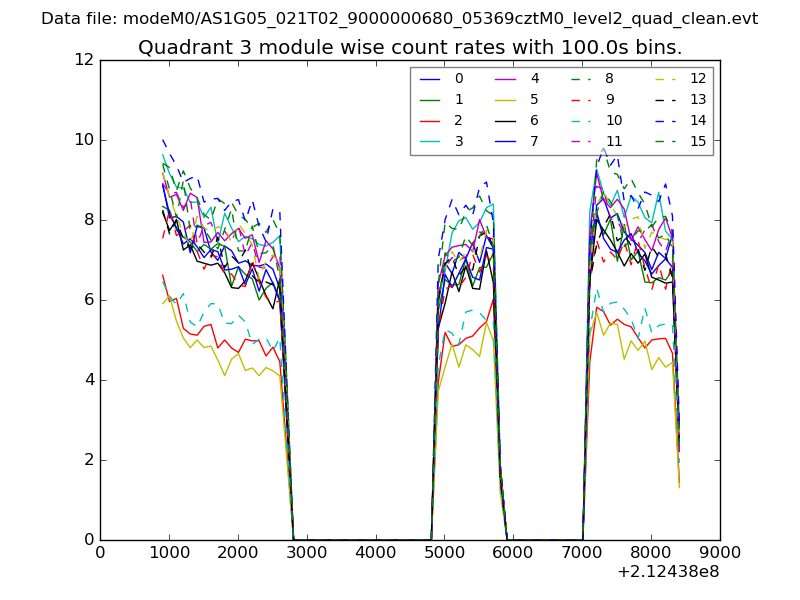
| Module-wise count rates for Quadrant A Data is divided into 100 sec bins |
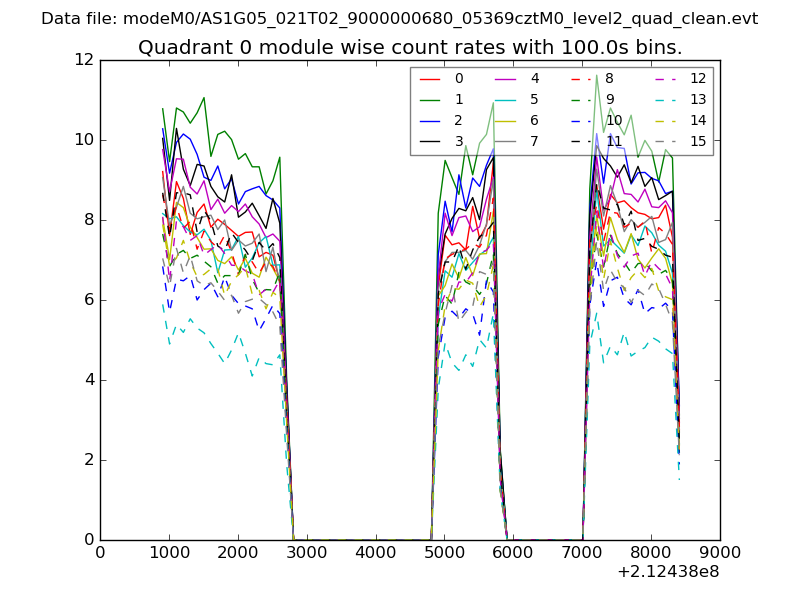 |
 |
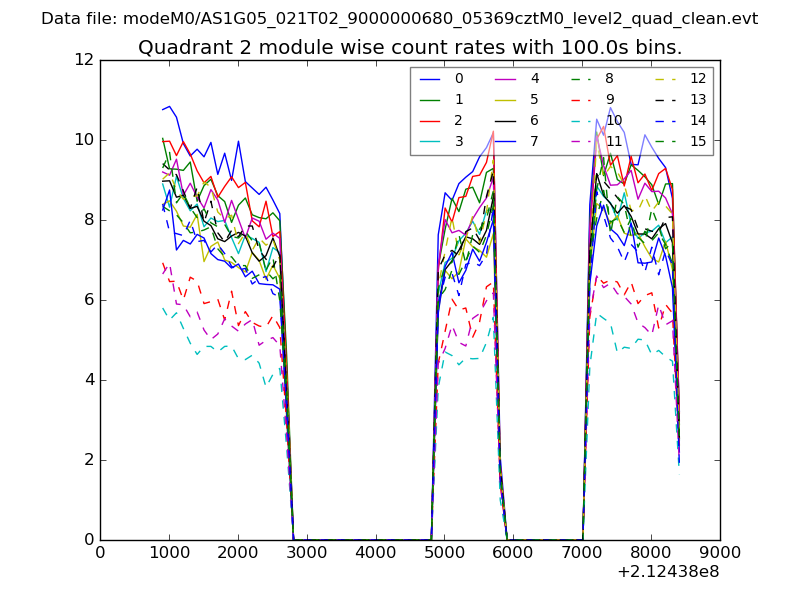
| Module-wise count rates for Quadrant B Data is divided into 100 sec bins |
 |
 |
| Module-wise count rates for Quadrant C Data is divided into 100 sec bins |
 |
 |
| Module-wise count rates for Quadrant D Data is divided into 100 sec bins |
 |
 |
| Parameter | Plot |
|---|---|
| CZT HV Monitor | 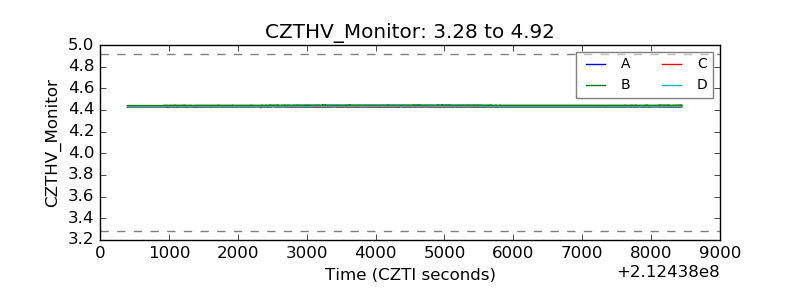 |
| D_VDD | 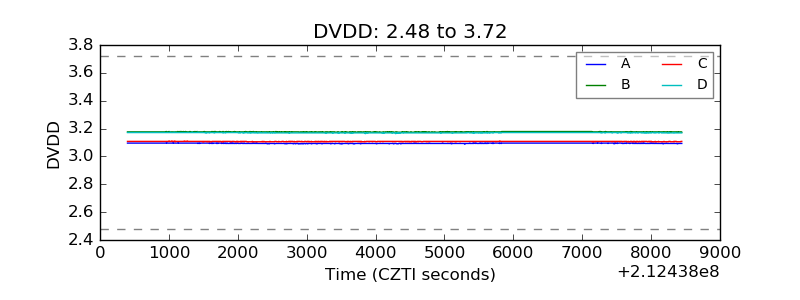 |
| Temperature 1 | 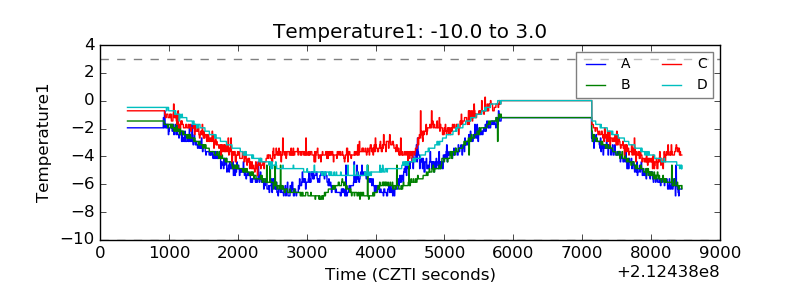 |
| Veto HV Monitor | 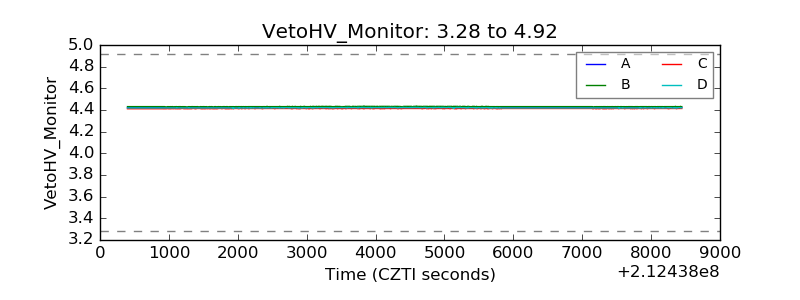 |
| Veto LLD | 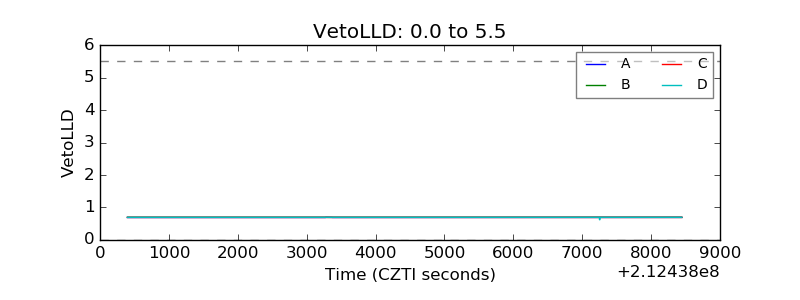 |
| Alpha Counter | 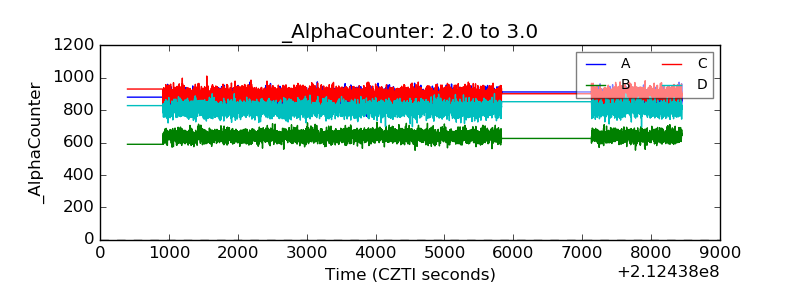 |
| _CPM_Rate | 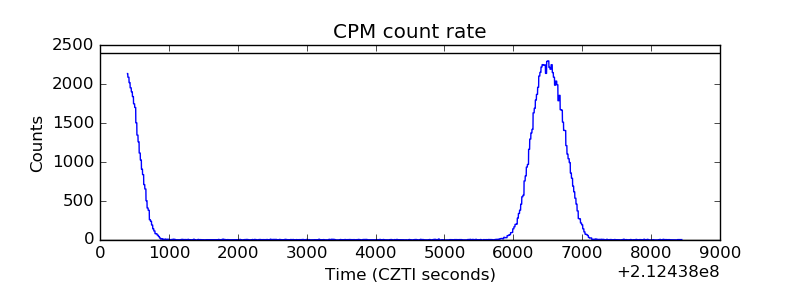 |
| CZT Counter | 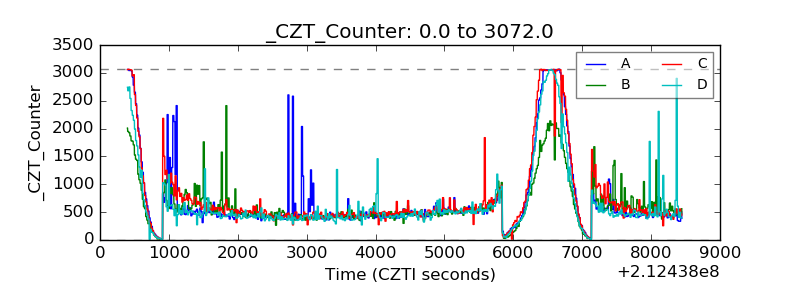 |
| +2.5 Volts monitor |  |
| +5 Volts monitor |  |
| _ROLL_ROT | 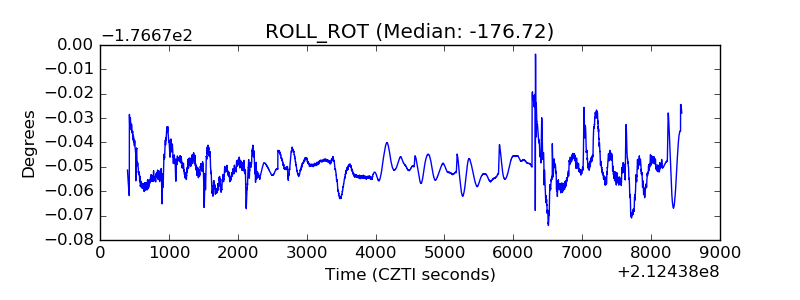 |
| _Roll_DEC | 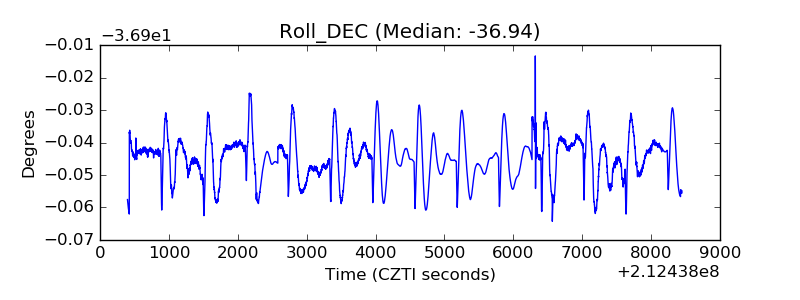 |
| _Roll_RA | 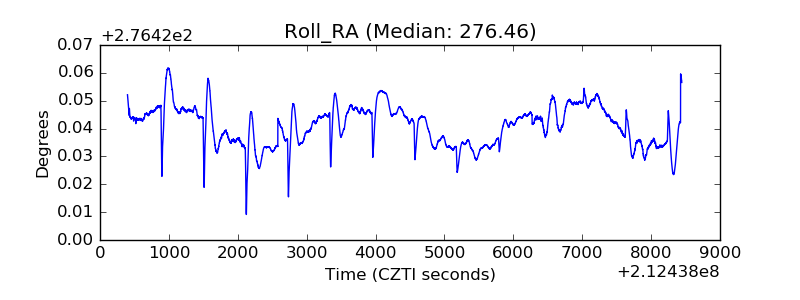 |
| Veto Counter | 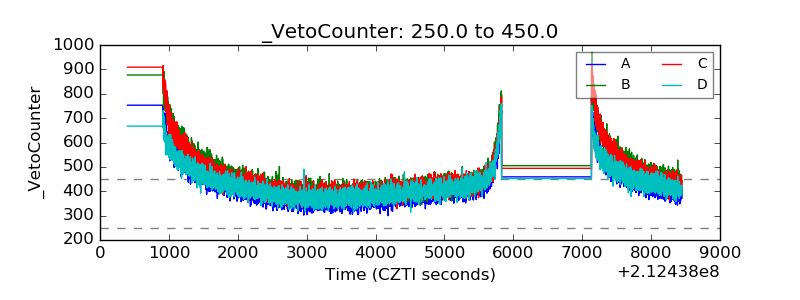 |