| Param | Original file | Final file |
|---|---|---|
| Filename | modeM0/AS1G05_021T02_9000000680_05370cztM0_level2.evt | modeM0/AS1G05_021T02_9000000680_05370cztM0_level2_quad_clean.evt |
| Size (bytes) | 496,811,520 | 71,726,400 |
| Size | 473.8 MB | 68.4 MB |
| Events in quadrant A | 4,046,546 | 436,893 |
| Events in quadrant B | 3,302,072 | 460,140 |
| Events in quadrant C | 3,307,741 | 454,904 |
| Events in quadrant D | 3,968,074 | 386,068 |
| Mode M0 | |||
|---|---|---|---|
| Quadrant | BADHDUFLAG | Total packets | Discarded packets |
| A | 0 | 16220 | 3 |
| B | 0 | 13765 | 2 |
| C | 0 | 13725 | 2 |
| D | 0 | 16156 | 2 |
| Mode SS | |||
|---|---|---|---|
| Quadrant | BADHDUFLAG | Total packets | Discarded packets |
| A | 0 | 126 | 0 |
| B | 0 | 126 | 0 |
| C | 0 | 126 | 0 |
| D | 0 | 126 | 0 |
| Mode M9 | |||
|---|---|---|---|
| Quadrant | BADHDUFLAG | Total packets | Discarded packets |
| A | 0 | 21 | 0 |
| B | 0 | 21 | 0 |
| C | 0 | 21 | 0 |
| D | 0 | 22 | 0 |
| Quadrant | Total seconds | Saturated seconds | Saturation percentage |
|---|---|---|---|
| A | 6211 | 294 | 4.733537% |
| B | 6211 | 40 | 0.644019% |
| C | 6211 | 25 | 0.402512% |
| D | 6211 | 431 | 6.939301% |
Noise dominated data is calculated using 1-second bins in cleaned event files. If a bin has >2000 counts, and if more than 50% of those come from <1% of pixels, then it is considered to be noise-dominated and hence unusable.
| Quadrant | # 1 sec bins | Bins with >0 counts | Bins with >2000 counts | High rate bins dominated by noise | Noise dominated (total time) | Noise dominated (detector-on time) | Marked lightcurve |
|---|---|---|---|---|---|---|---|
| A | 7591 | 6212 | 189 | 189 | 2.49% | 3.04% | 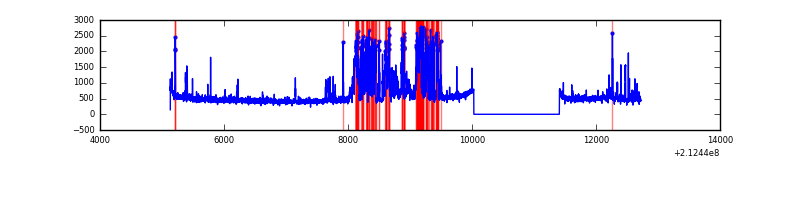 |
| B | 7591 | 6212 | 7 | 7 | 0.09% | 0.11% | 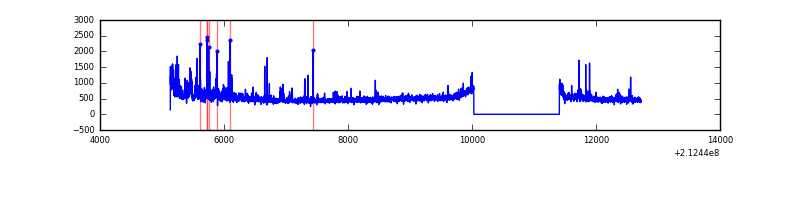 |
| C | 7591 | 6212 | 2 | 2 | 0.03% | 0.03% | 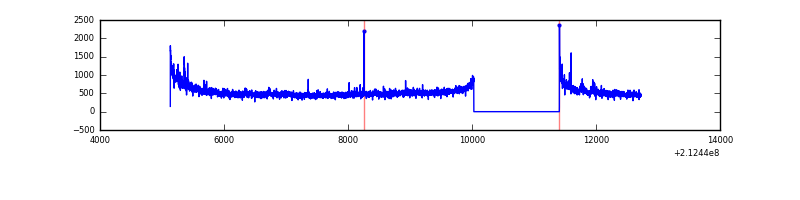 |
| D | 7591 | 6212 | 426 | 426 | 5.61% | 6.86% | 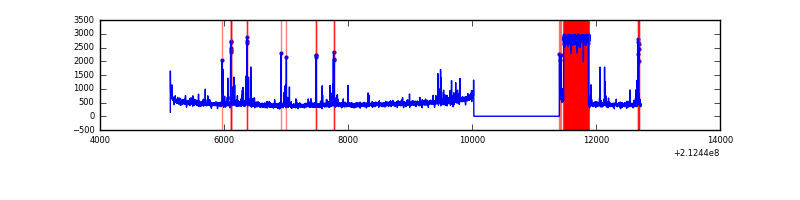 |
Top three noisy pixels from each quadrant. If the there are fewer than three noisy pixels in the level2.evt file, extra rows are filled as -1
| Pixel properties | Quadrant properties | ||||||
|---|---|---|---|---|---|---|---|
| Quadrant | DetID | PixID | Counts | Sigma | Mean | Median | Sigma |
| A | 15 | 174 | 1100954 | 7376.22 | 734 | 720 | 149.2 |
| A | 13 | 251 | 51853 | 342.81 | 734 | 720 | 149.2 |
| A | 14 | 111 | 38682 | 254.51 | 734 | 720 | 149.2 |
| B | 4 | 80 | 123697 | 841.97 | 764 | 747 | 146.0 |
| B | 4 | 81 | 62694 | 424.22 | 764 | 747 | 146.0 |
| B | 11 | 51 | 49439 | 333.45 | 764 | 747 | 146.0 |
| C | 1 | 16 | 403167 | 2392.26 | 728 | 734 | 168.2 |
| C | 9 | 247 | 53514 | 313.75 | 728 | 734 | 168.2 |
| C | 13 | 61 | 5976 | 31.16 | 728 | 734 | 168.2 |
| D | 7 | 237 | 1094608 | 6506.71 | 678 | 655 | 168.1 |
| D | 4 | 95 | 111070 | 656.74 | 678 | 655 | 168.1 |
| D | 2 | 136 | 84294 | 497.48 | 678 | 655 | 168.1 |
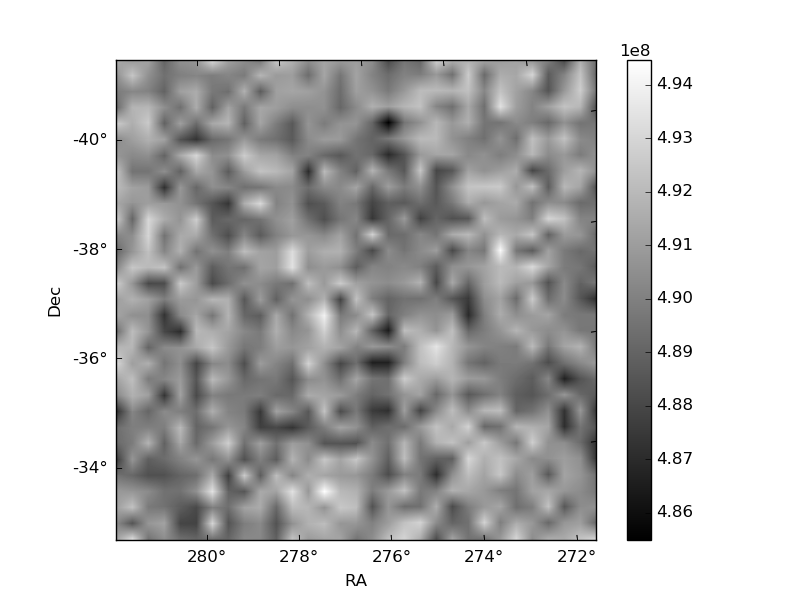
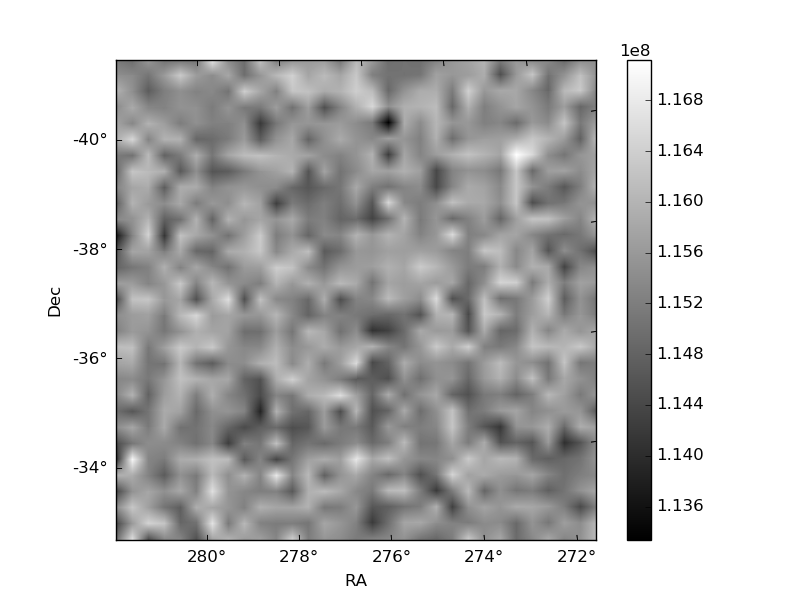
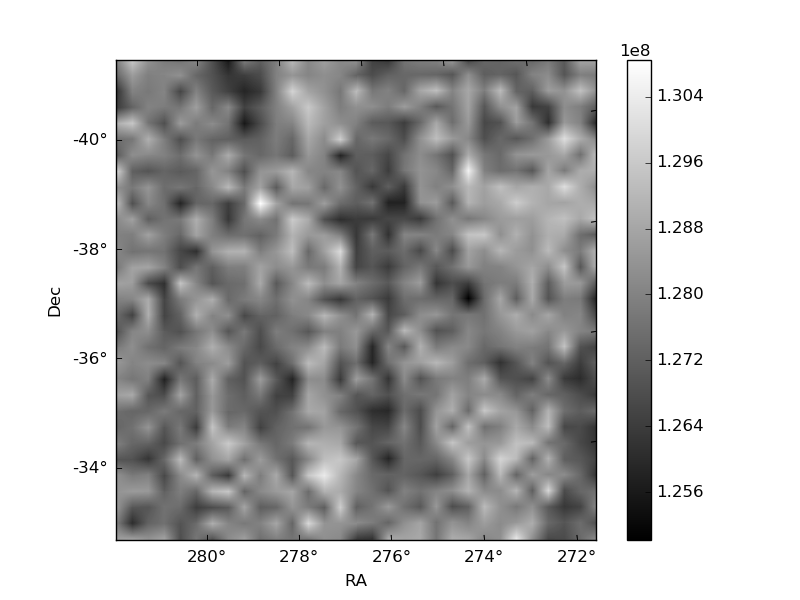
Histogram calculated using DETX and DETY for each event in the final _common_clean file
| Quadrant A | 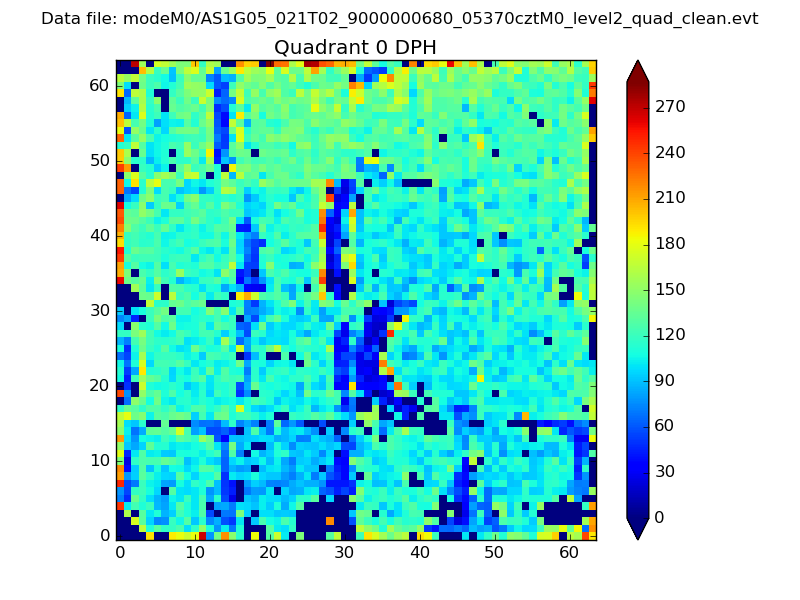 |
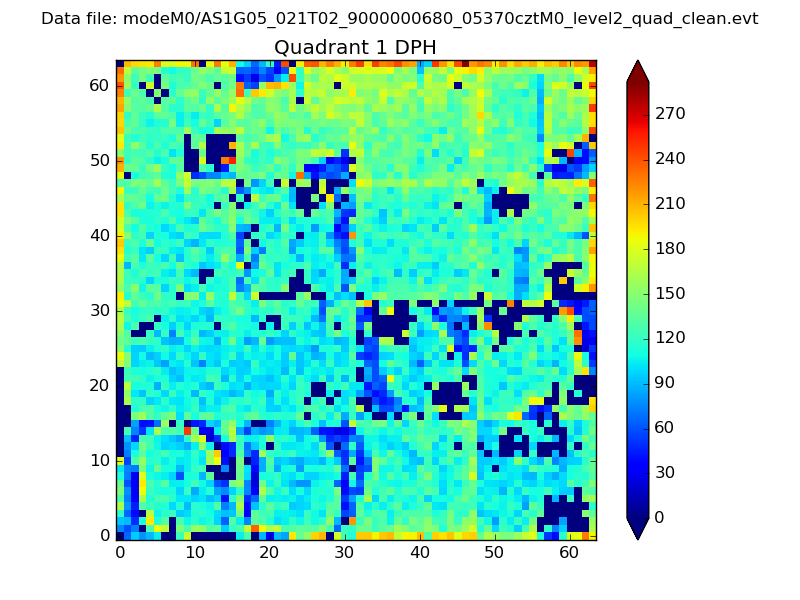 |
Quadrant B |
|---|---|---|---|
| Quadrant D | 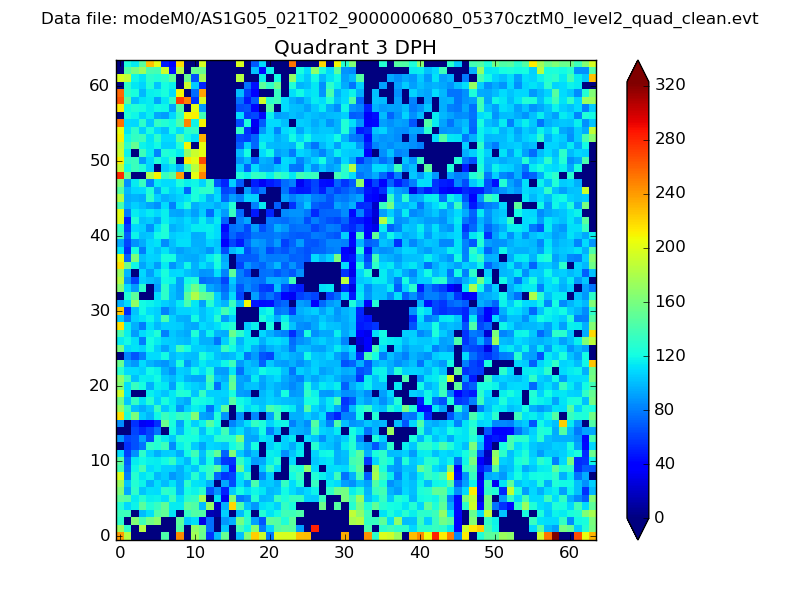 |
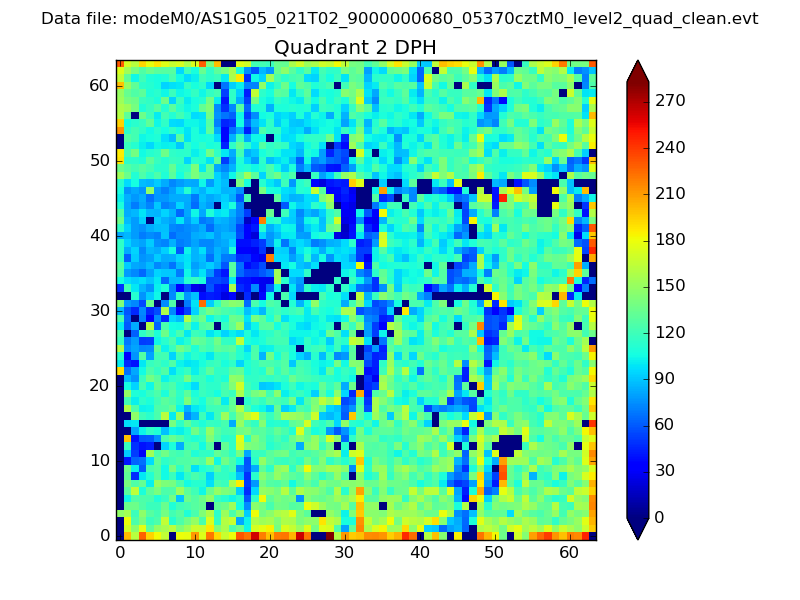 |
Quadrant C |
| Plot type | Count rate plots | Images |
|---|---|---|
| Comparison with Poisson distribution Blue bars denote a histogram of data divided into 1 sec bins. Red curve is a Poisson curve with rate = median count rate of data. |
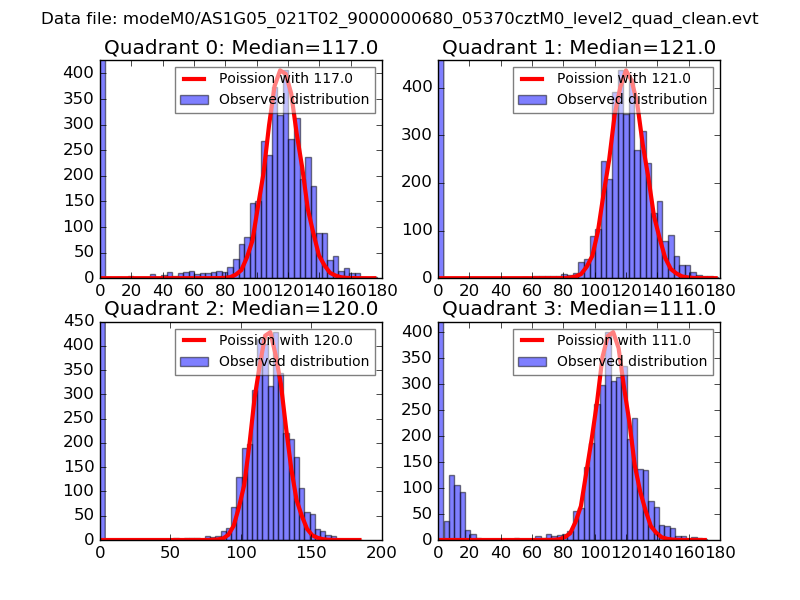 |
 |
| Quadrant-wise count rates Data is divided into 100 sec bins |
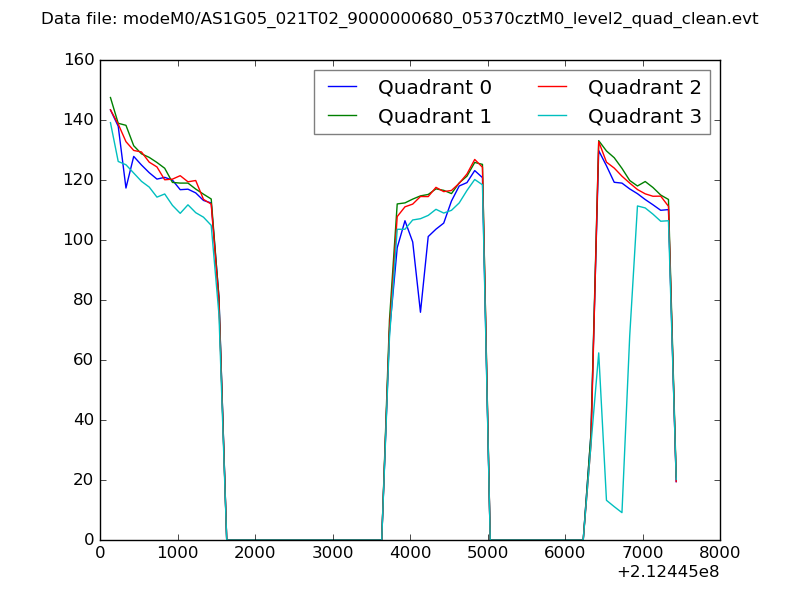 |
|
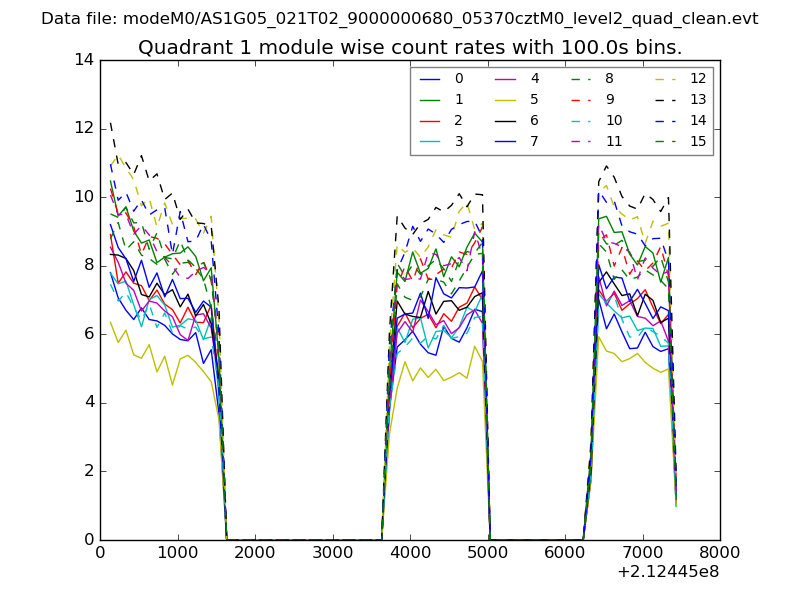
| Module-wise count rates for Quadrant A Data is divided into 100 sec bins |
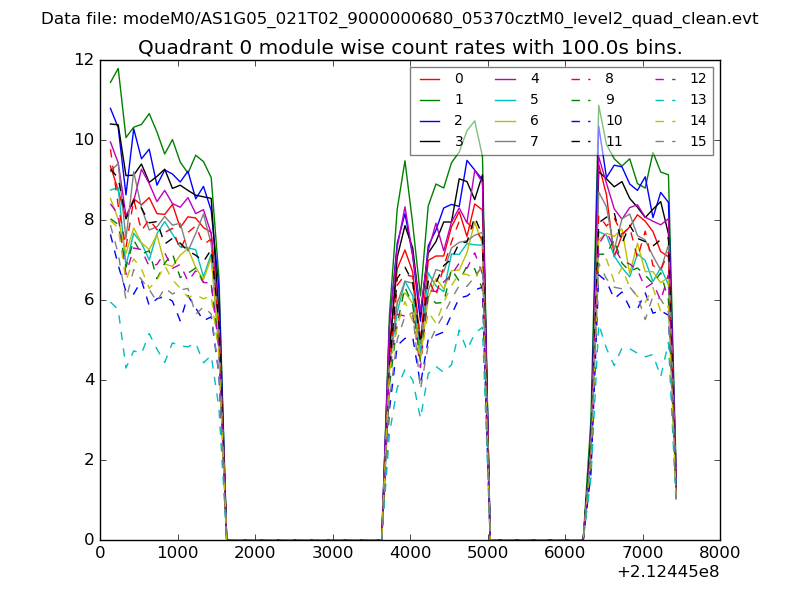 |
 |
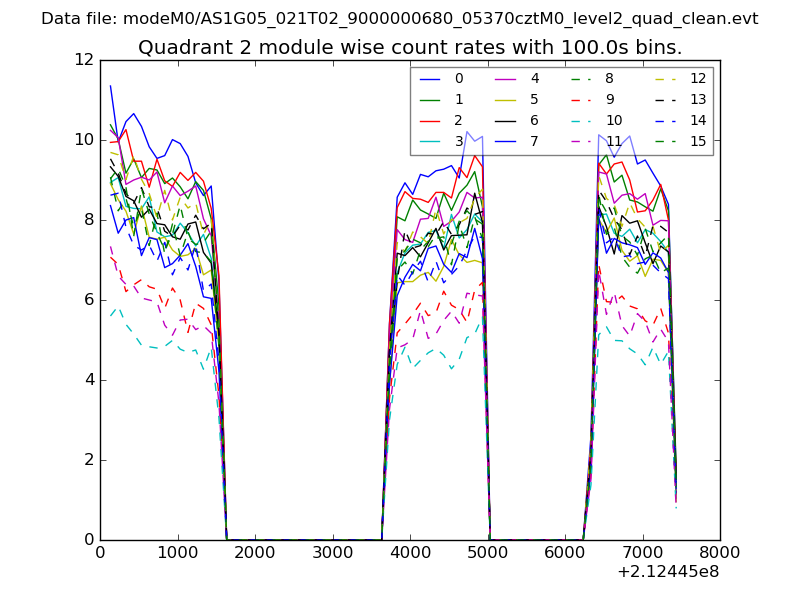
| Module-wise count rates for Quadrant B Data is divided into 100 sec bins |
 |
 |
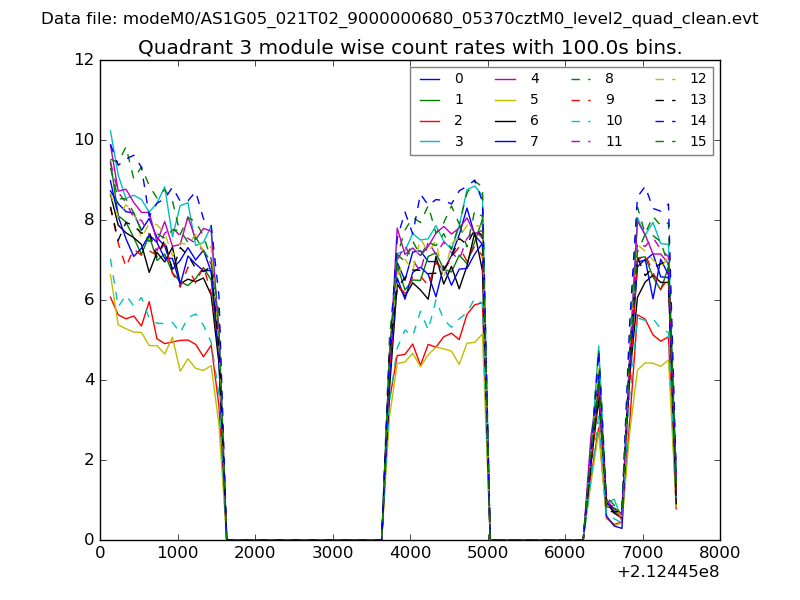
| Module-wise count rates for Quadrant C Data is divided into 100 sec bins |
 |
 |
| Module-wise count rates for Quadrant D Data is divided into 100 sec bins |
 |
 |
| Parameter | Plot |
|---|---|
| CZT HV Monitor | 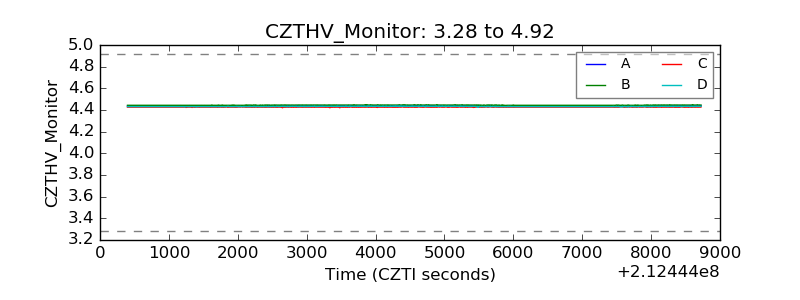 |
| D_VDD | 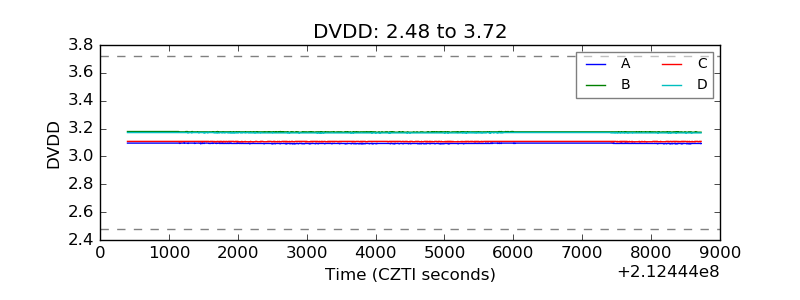 |
| Temperature 1 | 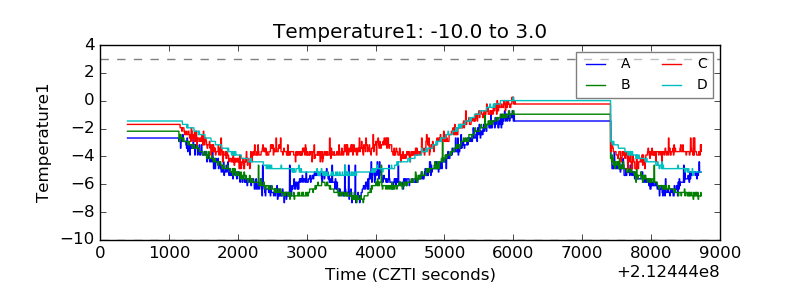 |
| Veto HV Monitor | 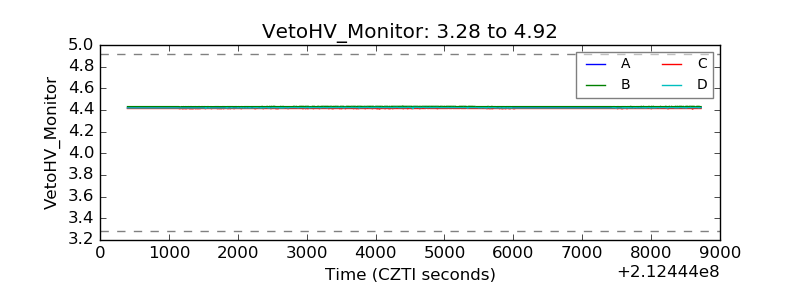 |
| Veto LLD | 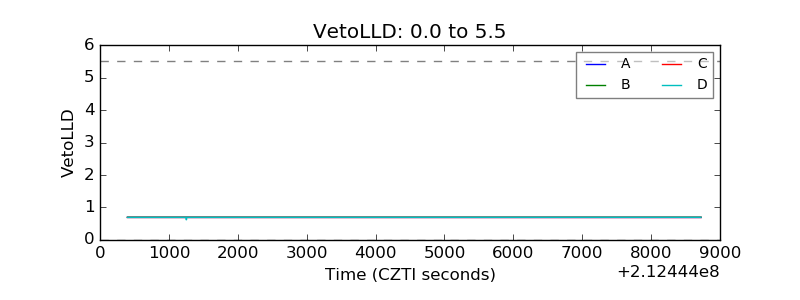 |
| Alpha Counter | 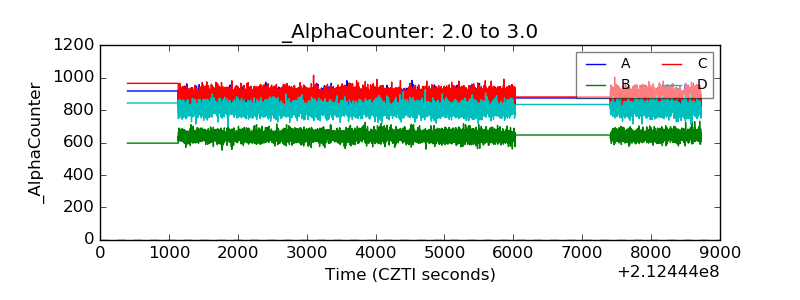 |
| _CPM_Rate | 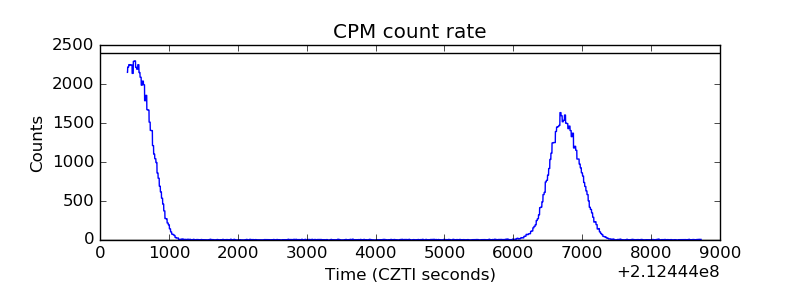 |
| CZT Counter | 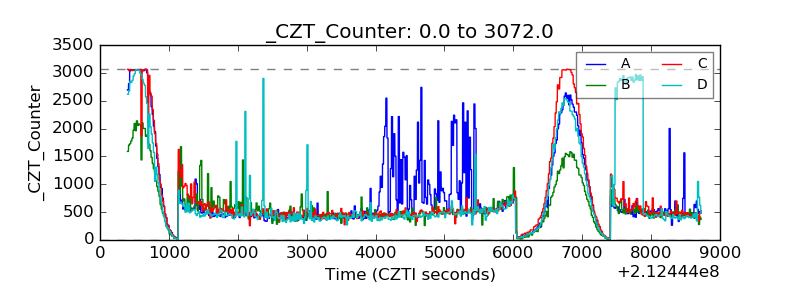 |
| +2.5 Volts monitor |  |
| +5 Volts monitor |  |
| _ROLL_ROT | 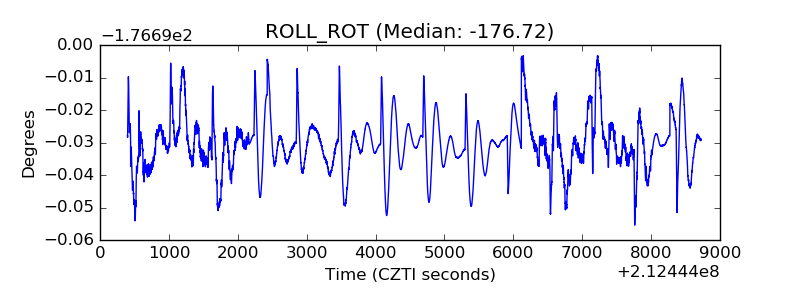 |
| _Roll_DEC | 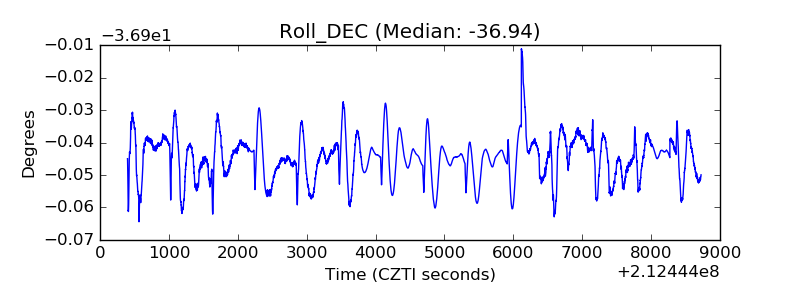 |
| _Roll_RA | 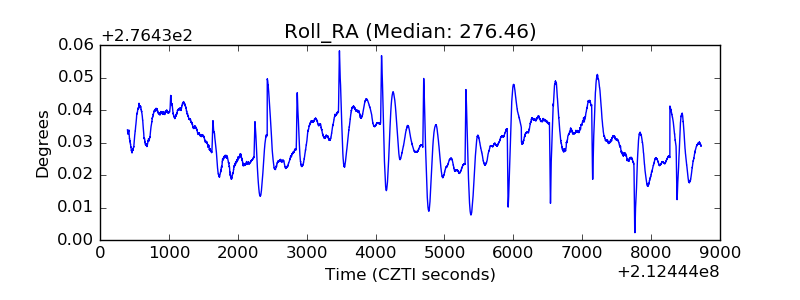 |
| Veto Counter | 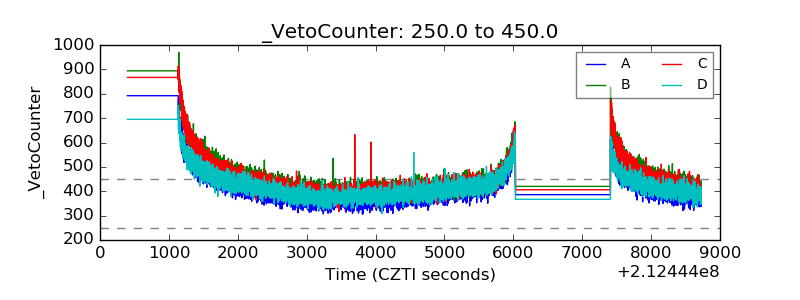 |