| Param | Original file | Final file |
|---|---|---|
| Filename | modeM0/AS1G05_021T02_9000000680_05373cztM0_level2.evt | modeM0/AS1G05_021T02_9000000680_05373cztM0_level2_quad_clean.evt |
| Size (bytes) | 509,728,320 | 66,006,720 |
| Size | 486.1 MB | 62.9 MB |
| Events in quadrant A | 3,568,982 | 370,751 |
| Events in quadrant B | 3,595,903 | 378,227 |
| Events in quadrant C | 3,645,123 | 380,116 |
| Events in quadrant D | 4,129,171 | 358,930 |
| Mode M0 | |||
|---|---|---|---|
| Quadrant | BADHDUFLAG | Total packets | Discarded packets |
| A | 0 | 15802 | 2 |
| B | 0 | 15481 | 1 |
| C | 0 | 15319 | 1 |
| D | 0 | 17607 | 1 |
| Mode SS | |||
|---|---|---|---|
| Quadrant | BADHDUFLAG | Total packets | Discarded packets |
| A | 0 | 148 | 0 |
| B | 0 | 148 | 0 |
| C | 0 | 148 | 0 |
| D | 0 | 148 | 0 |
| Mode M9 | |||
|---|---|---|---|
| Quadrant | BADHDUFLAG | Total packets | Discarded packets |
| A | 0 | 4 | 0 |
| B | 0 | 4 | 0 |
| C | 0 | 4 | 0 |
| D | 0 | 4 | 0 |
| Quadrant | Total seconds | Saturated seconds | Saturation percentage |
|---|---|---|---|
| A | 7334 | 100 | 1.363512% |
| B | 7334 | 80 | 1.090810% |
| C | 7334 | 72 | 0.981729% |
| D | 7334 | 275 | 3.749659% |
Noise dominated data is calculated using 1-second bins in cleaned event files. If a bin has >2000 counts, and if more than 50% of those come from <1% of pixels, then it is considered to be noise-dominated and hence unusable.
| Quadrant | # 1 sec bins | Bins with >0 counts | Bins with >2000 counts | High rate bins dominated by noise | Noise dominated (total time) | Noise dominated (detector-on time) | Marked lightcurve |
|---|---|---|---|---|---|---|---|
| A | 7779 | 7334 | 30 | 30 | 0.39% | 0.41% | 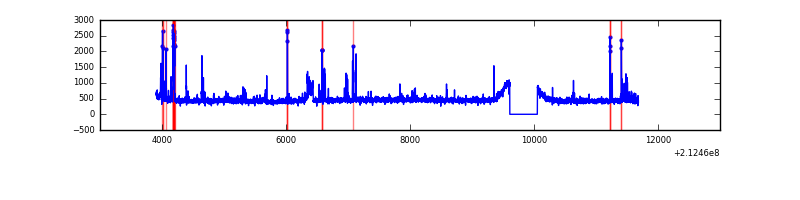 |
| B | 7779 | 7334 | 1 | 1 | 0.01% | 0.01% | 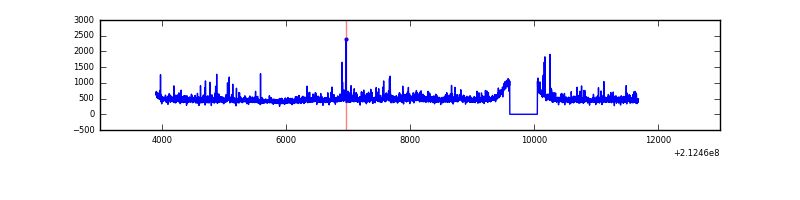 |
| C | 7779 | 7334 | 0 | 0 | 0.00% | 0.00% | 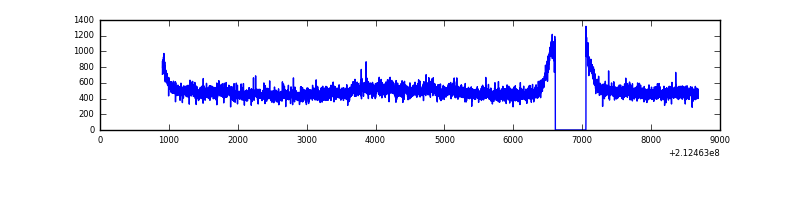 |
| D | 7779 | 7334 | 206 | 206 | 2.65% | 2.81% | 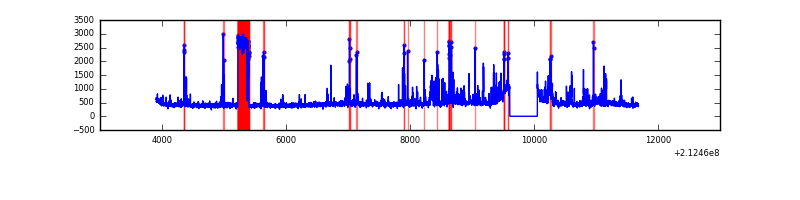 |
Top three noisy pixels from each quadrant. If the there are fewer than three noisy pixels in the level2.evt file, extra rows are filled as -1
| Pixel properties | Quadrant properties | ||||||
|---|---|---|---|---|---|---|---|
| Quadrant | DetID | PixID | Counts | Sigma | Mean | Median | Sigma |
| A | 0 | 50 | 167501 | 946.78 | 849 | 828 | 176.0 |
| A | 15 | 174 | 134528 | 759.48 | 849 | 828 | 176.0 |
| A | 12 | 194 | 8222 | 42.0 | 849 | 828 | 176.0 |
| B | 4 | 81 | 66939 | 395.31 | 867 | 845 | 167.2 |
| B | 4 | 80 | 52982 | 311.83 | 867 | 845 | 167.2 |
| B | 14 | 167 | 41274 | 241.81 | 867 | 845 | 167.2 |
| C | 1 | 16 | 391240 | 1993.29 | 834 | 841 | 195.9 |
| C | 13 | 61 | 6736 | 30.1 | 834 | 841 | 195.9 |
| C | 3 | 202 | 2082 | 6.34 | 834 | 841 | 195.9 |
| D | 7 | 237 | 381424 | 1896.99 | 811 | 786 | 200.7 |
| D | 2 | 136 | 257949 | 1281.63 | 811 | 786 | 200.7 |
| D | 4 | 95 | 134052 | 664.16 | 811 | 786 | 200.7 |
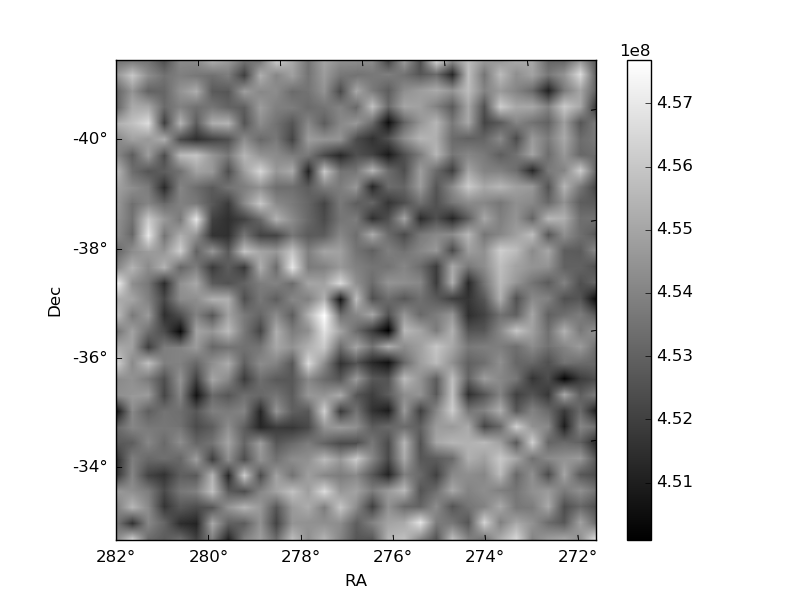
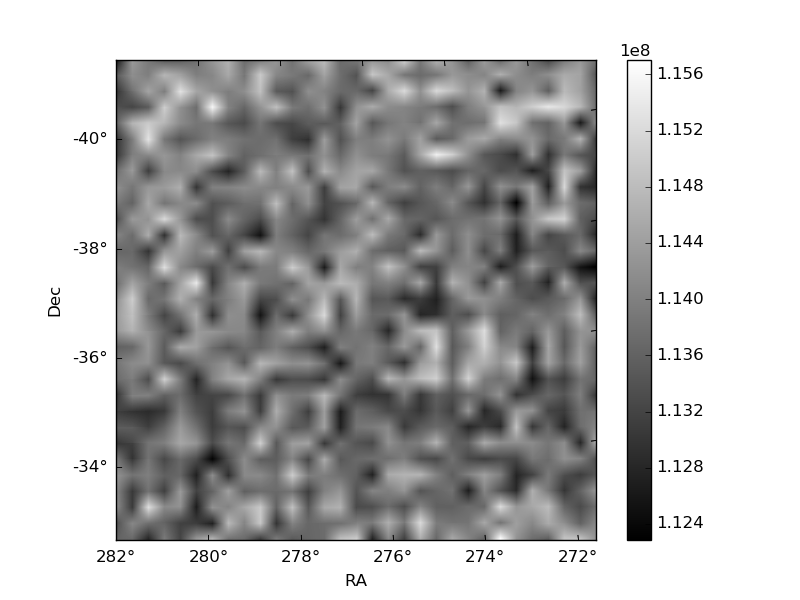
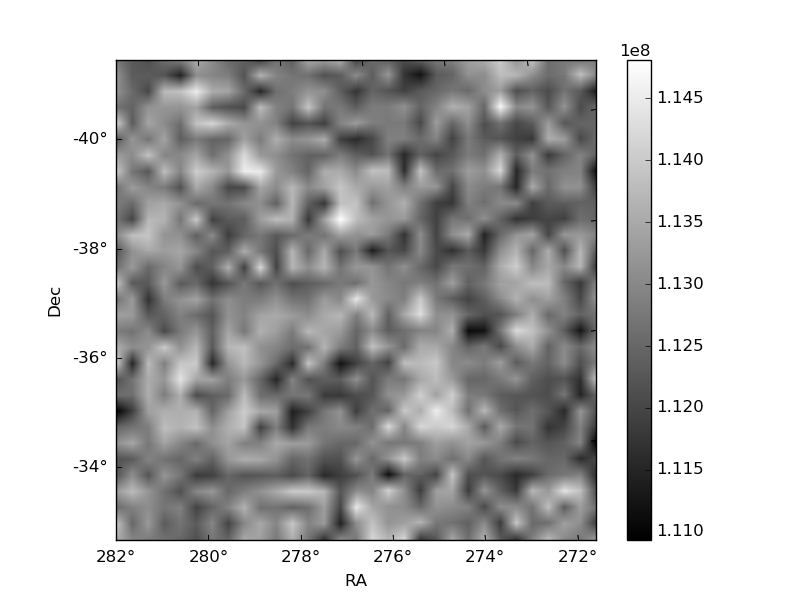
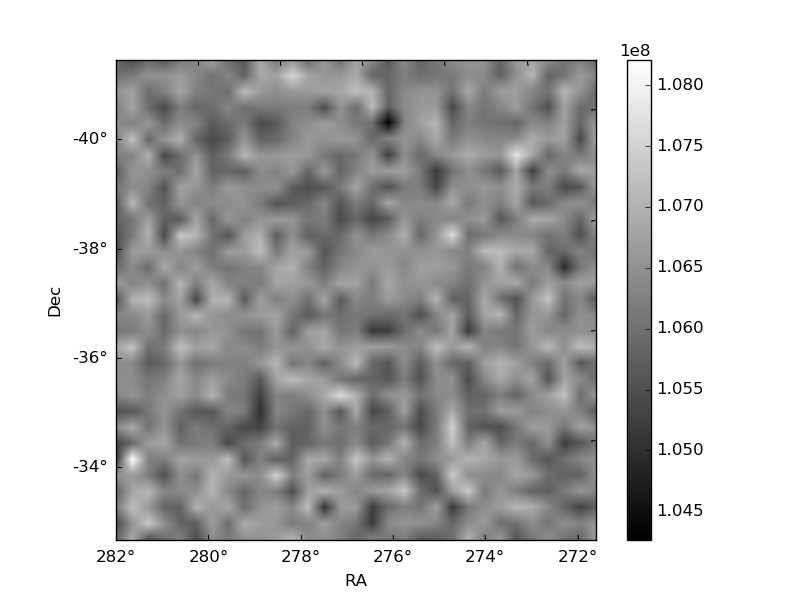
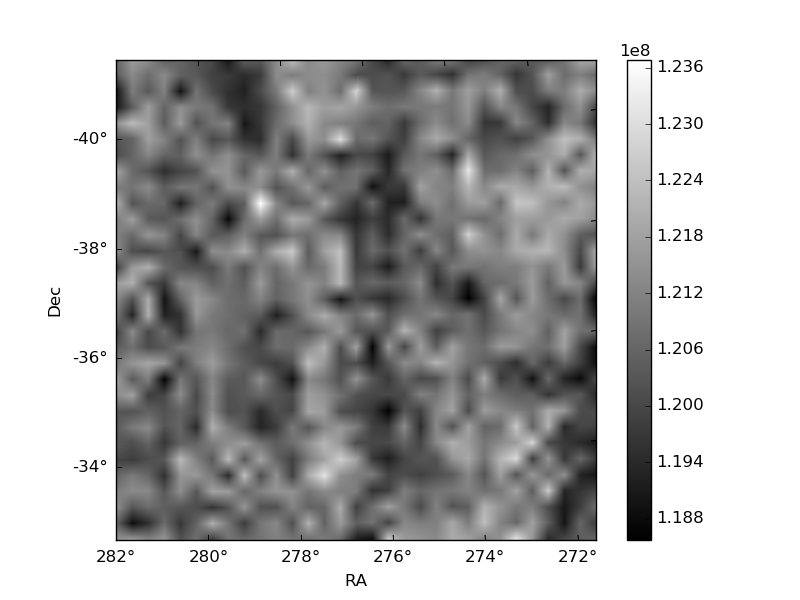
Histogram calculated using DETX and DETY for each event in the final _common_clean file
| Quadrant A | 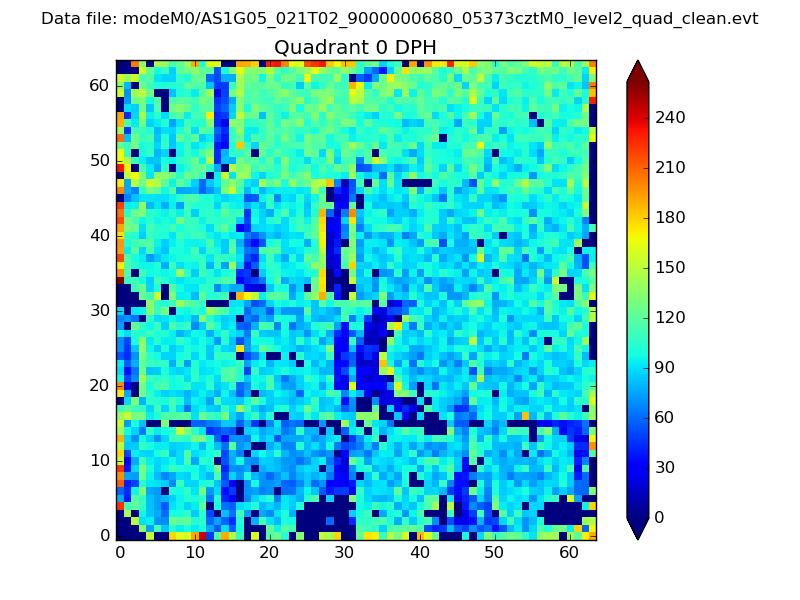 |
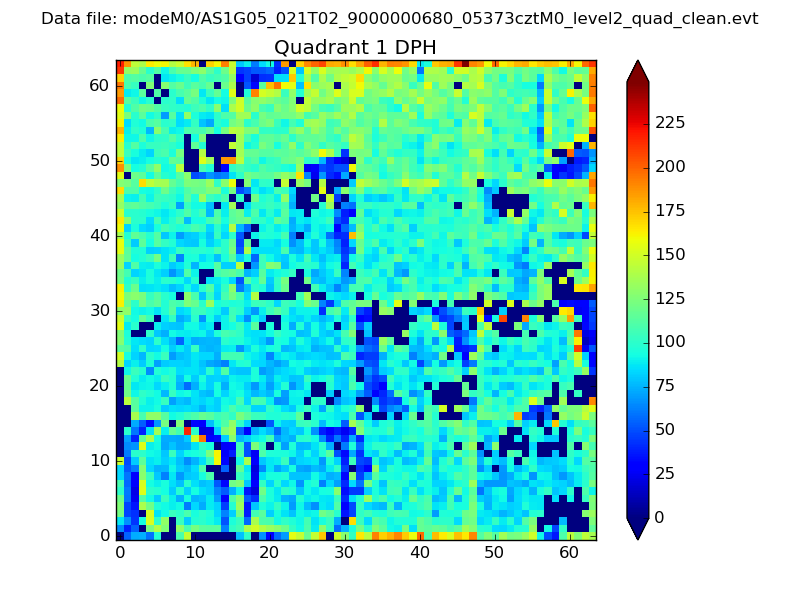 |
Quadrant B |
|---|---|---|---|
| Quadrant D | 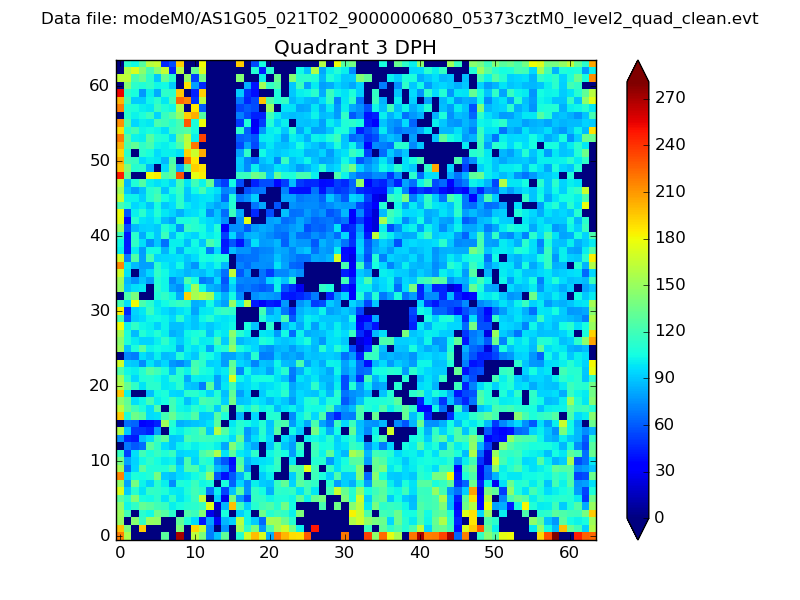 |
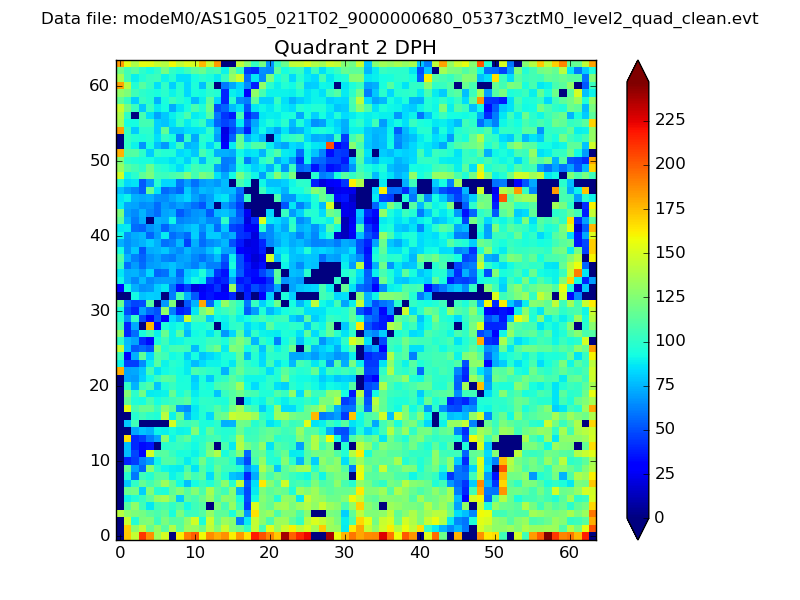 |
Quadrant C |
| Plot type | Count rate plots | Images |
|---|---|---|
| Comparison with Poisson distribution Blue bars denote a histogram of data divided into 1 sec bins. Red curve is a Poisson curve with rate = median count rate of data. |
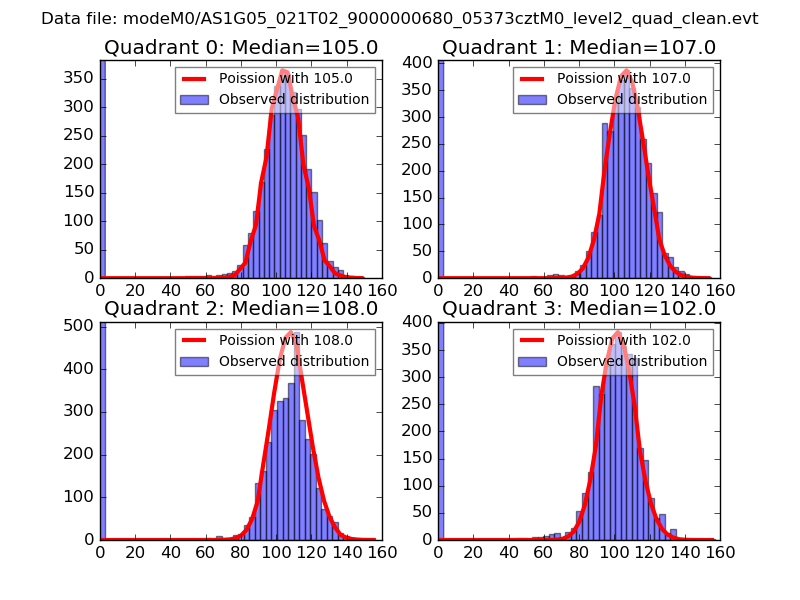 |
 |
| Quadrant-wise count rates Data is divided into 100 sec bins |
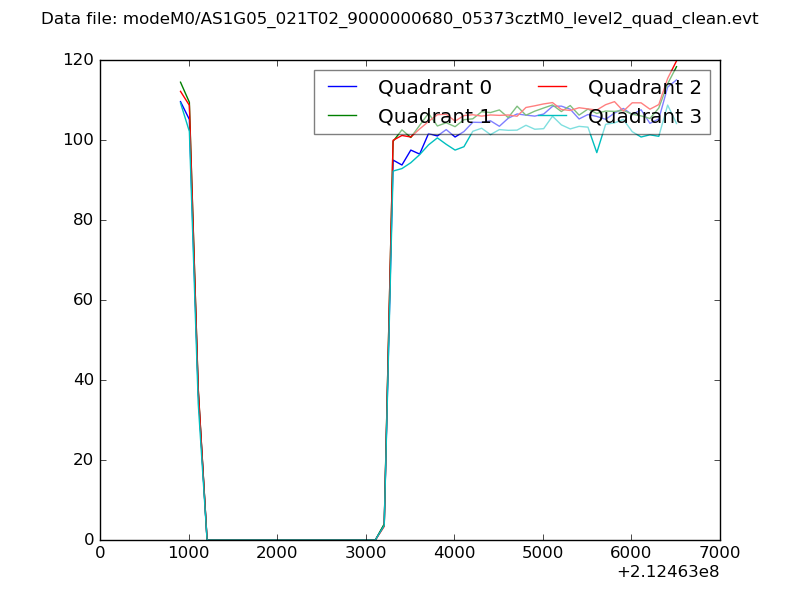 |
|
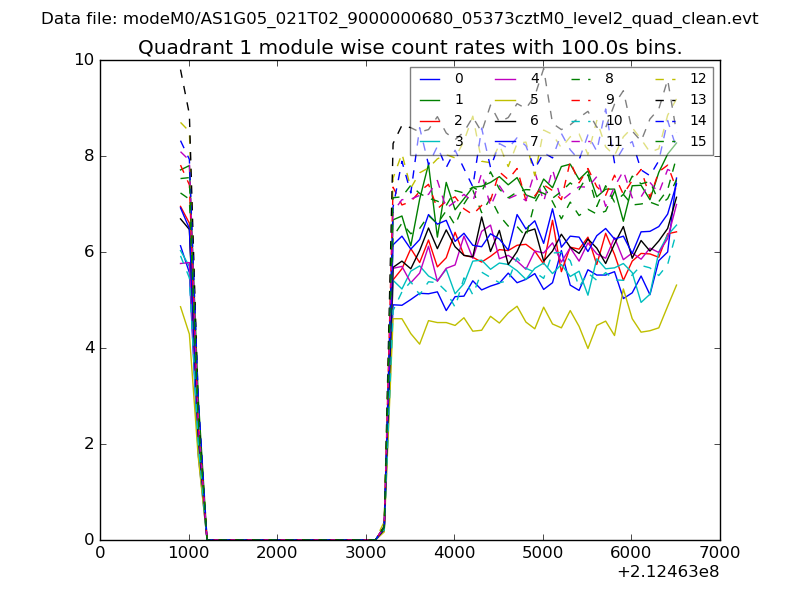
| Module-wise count rates for Quadrant A Data is divided into 100 sec bins |
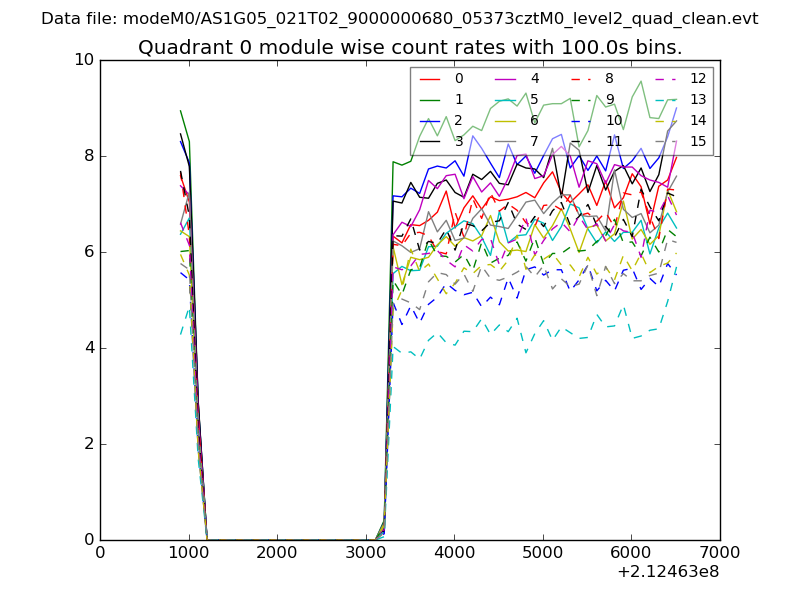 |
 |
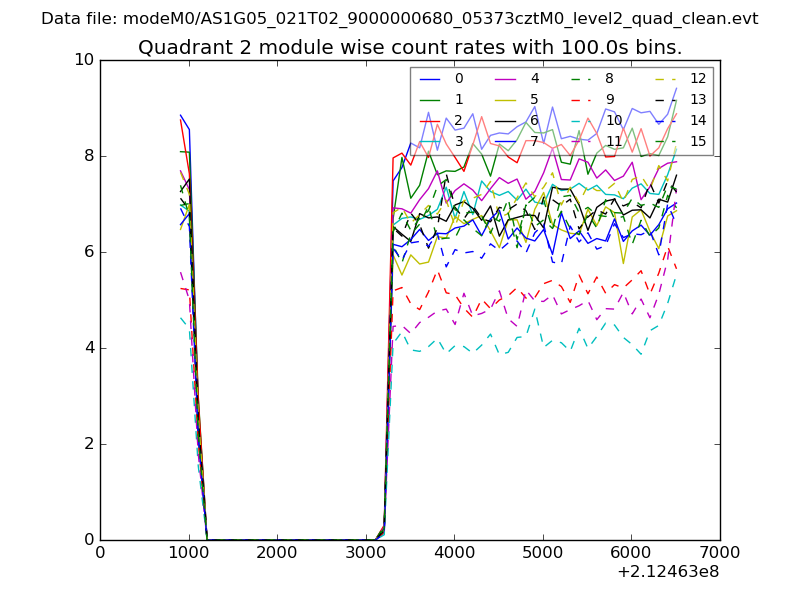
| Module-wise count rates for Quadrant B Data is divided into 100 sec bins |
 |
 |
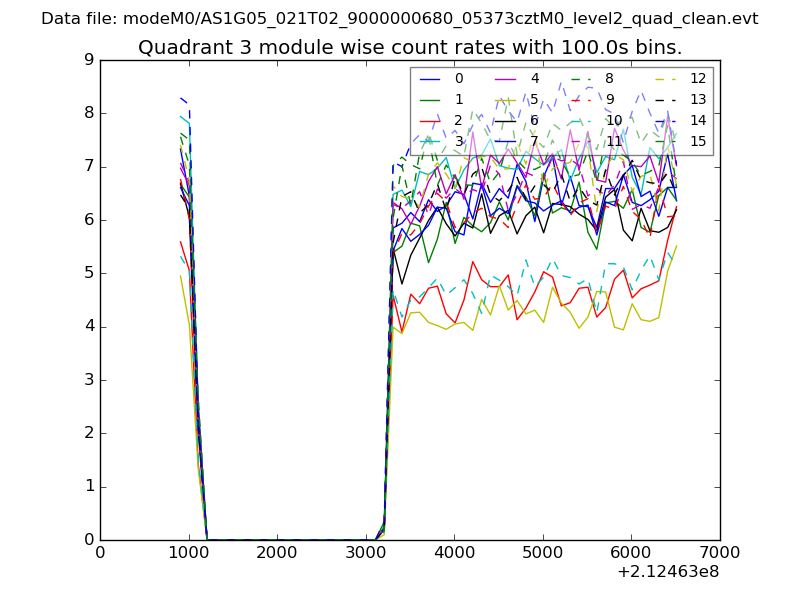
| Module-wise count rates for Quadrant C Data is divided into 100 sec bins |
 |
 |
| Module-wise count rates for Quadrant D Data is divided into 100 sec bins |
 |
 |
| Parameter | Plot |
|---|---|
| CZT HV Monitor | 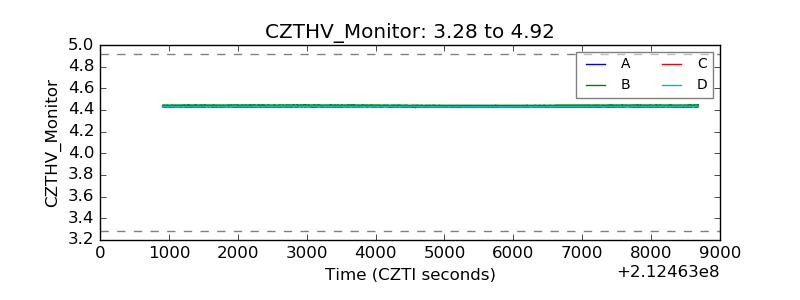 |
| D_VDD | 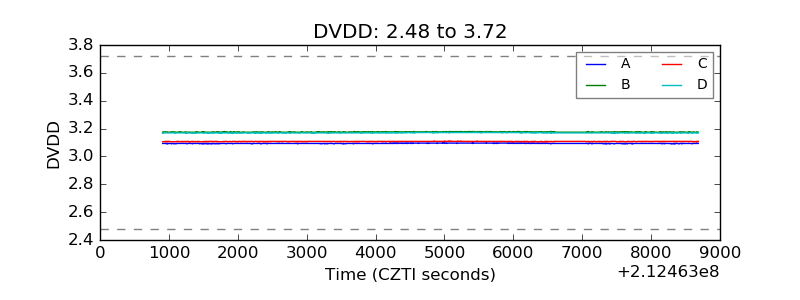 |
| Temperature 1 | 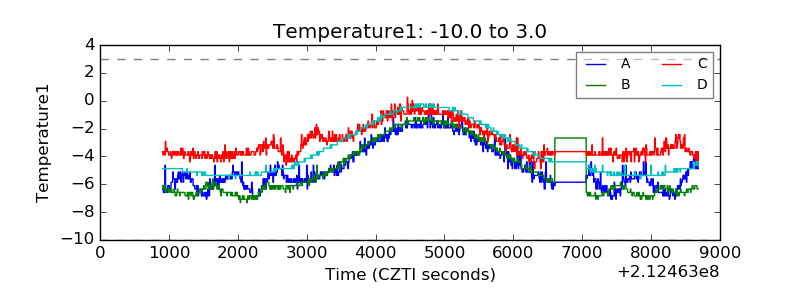 |
| Veto HV Monitor | 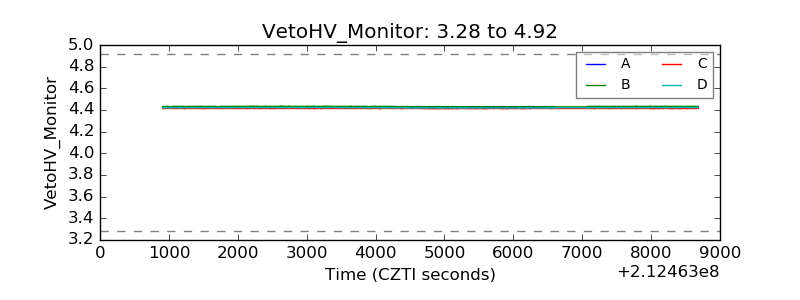 |
| Veto LLD | 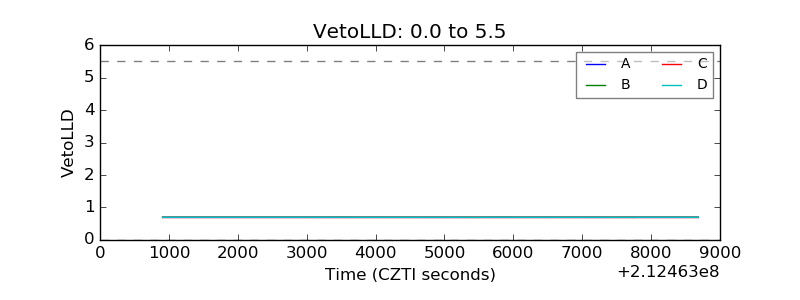 |
| Alpha Counter | 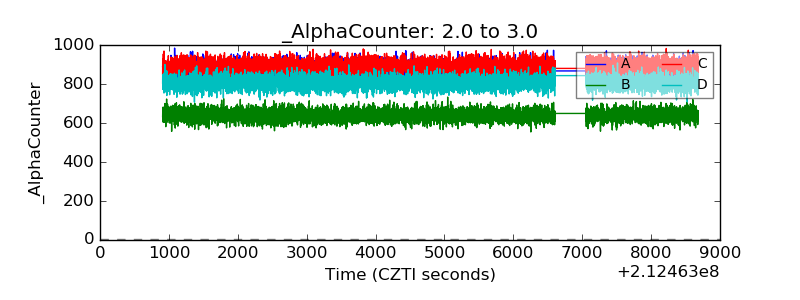 |
| _CPM_Rate | 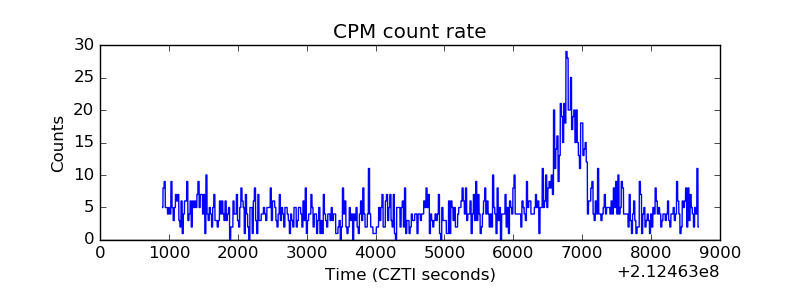 |
| CZT Counter | 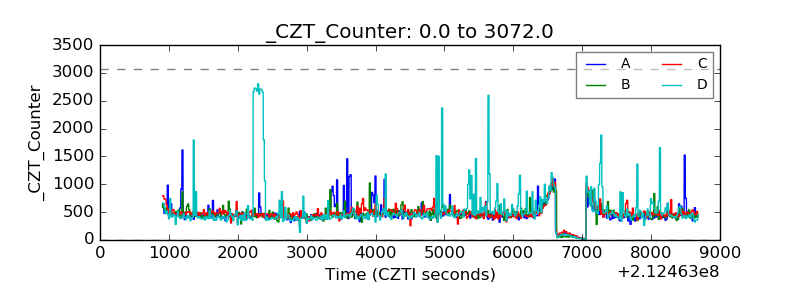 |
| +2.5 Volts monitor |  |
| +5 Volts monitor |  |
| _ROLL_ROT | 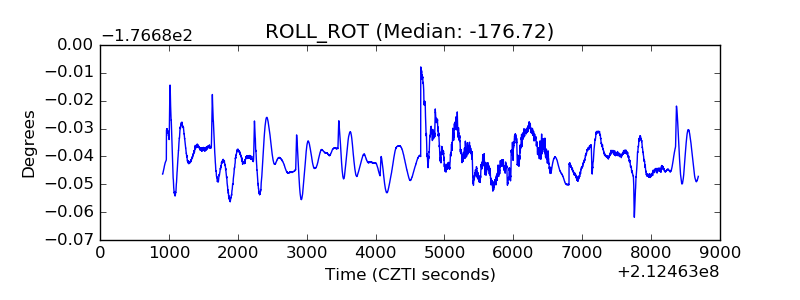 |
| _Roll_DEC | 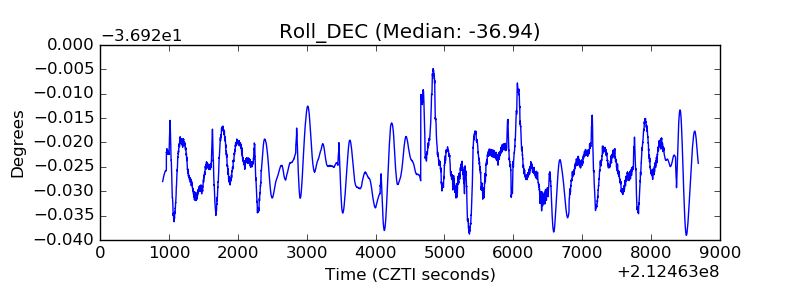 |
| _Roll_RA | 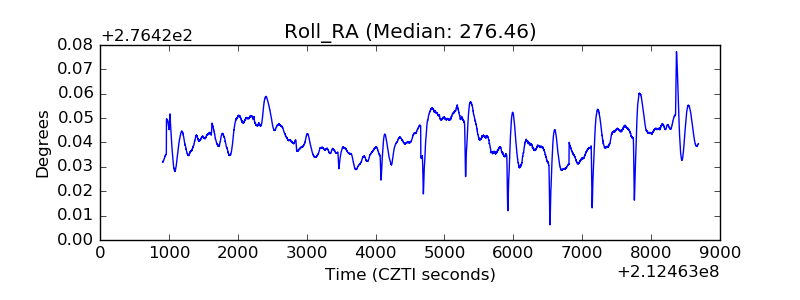 |
| Veto Counter | 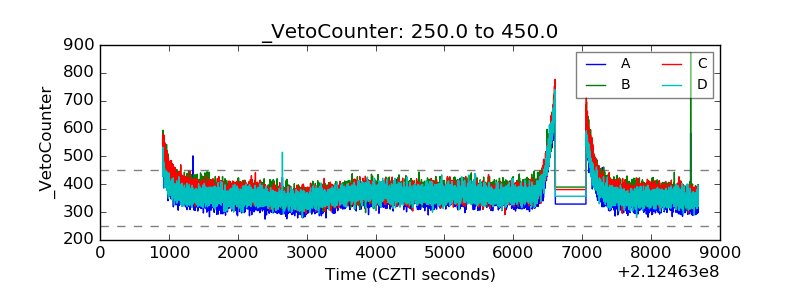 |