| Param | Original file | Final file |
|---|---|---|
| Filename | modeM0/AS1G05_021T02_9000000680_05374cztM0_level2.evt | modeM0/AS1G05_021T02_9000000680_05374cztM0_level2_quad_clean.evt |
| Size (bytes) | 522,915,840 | 67,227,840 |
| Size | 498.7 MB | 64.1 MB |
| Events in quadrant A | 3,764,400 | 375,039 |
| Events in quadrant B | 3,742,768 | 380,545 |
| Events in quadrant C | 3,734,239 | 382,006 |
| Events in quadrant D | 4,072,679 | 362,865 |
| Mode M0 | |||
|---|---|---|---|
| Quadrant | BADHDUFLAG | Total packets | Discarded packets |
| A | 0 | 16554 | 2 |
| B | 0 | 16234 | 1 |
| C | 0 | 16149 | 1 |
| D | 0 | 17595 | 1 |
| Mode SS | |||
|---|---|---|---|
| Quadrant | BADHDUFLAG | Total packets | Discarded packets |
| A | 0 | 154 | 0 |
| B | 0 | 154 | 0 |
| C | 0 | 154 | 0 |
| D | 0 | 154 | 0 |
| Mode M9 | |||
|---|---|---|---|
| Quadrant | BADHDUFLAG | Total packets | Discarded packets |
| A | 1 | 251318637792 | 0 |
| B | 1 | -1 | -1 |
| C | 1 | -1 | -1 |
| D | 1 | -1 | -1 |
| Quadrant | Total seconds | Saturated seconds | Saturation percentage |
|---|---|---|---|
| A | 7689 | 189 | 2.458057% |
| B | 7689 | 192 | 2.497074% |
| C | 7689 | 149 | 1.937833% |
| D | 7689 | 224 | 2.913253% |
Noise dominated data is calculated using 1-second bins in cleaned event files. If a bin has >2000 counts, and if more than 50% of those come from <1% of pixels, then it is considered to be noise-dominated and hence unusable.
| Quadrant | # 1 sec bins | Bins with >0 counts | Bins with >2000 counts | High rate bins dominated by noise | Noise dominated (total time) | Noise dominated (detector-on time) | Marked lightcurve |
|---|---|---|---|---|---|---|---|
| A | 7689 | 7689 | 15 | 15 | 0.20% | 0.20% | 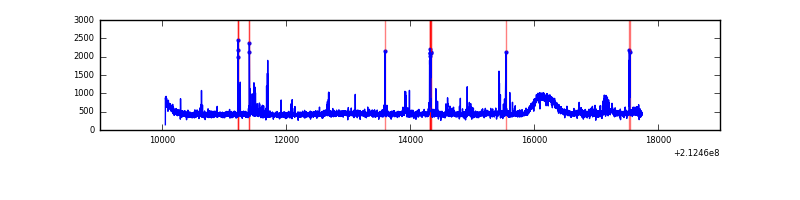 |
| B | 7689 | 7689 | 0 | 0 | 0.00% | 0.00% | 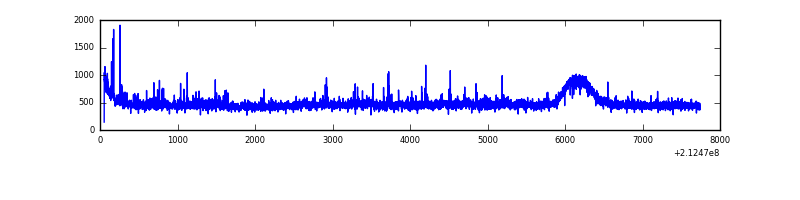 |
| C | 7689 | 7689 | 0 | 0 | 0.00% | 0.00% | 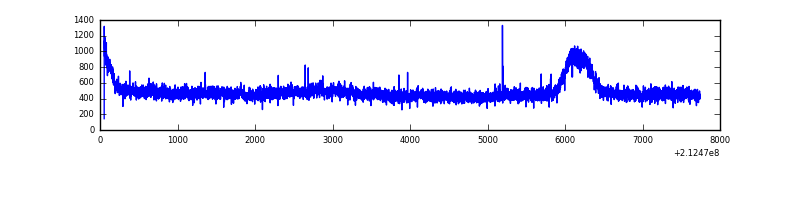 |
| D | 7689 | 7689 | 42 | 42 | 0.55% | 0.55% | 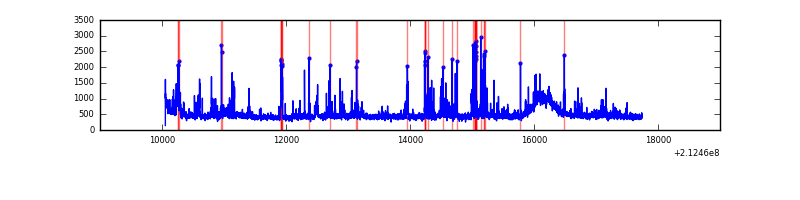 |
Top three noisy pixels from each quadrant. If the there are fewer than three noisy pixels in the level2.evt file, extra rows are filled as -1
| Pixel properties | Quadrant properties | ||||||
|---|---|---|---|---|---|---|---|
| Quadrant | DetID | PixID | Counts | Sigma | Mean | Median | Sigma |
| A | 0 | 50 | 165836 | 866.43 | 913 | 891 | 190.4 |
| A | 15 | 174 | 85314 | 443.46 | 913 | 891 | 190.4 |
| A | 12 | 194 | 9051 | 42.86 | 913 | 891 | 190.4 |
| B | 4 | 81 | 64101 | 348.67 | 929 | 906 | 181.2 |
| B | 15 | 204 | 23838 | 126.53 | 929 | 906 | 181.2 |
| B | 15 | 54 | 19139 | 100.6 | 929 | 906 | 181.2 |
| C | 1 | 16 | 231170 | 1096.96 | 896 | 898 | 209.9 |
| C | 13 | 61 | 7539 | 31.64 | 896 | 898 | 209.9 |
| C | 12 | 4 | 3510 | 12.44 | 896 | 898 | 209.9 |
| D | 2 | 63 | 277821 | 1245.05 | 889 | 858 | 222.5 |
| D | 2 | 136 | 210473 | 942.29 | 889 | 858 | 222.5 |
| D | 4 | 95 | 108688 | 484.73 | 889 | 858 | 222.5 |
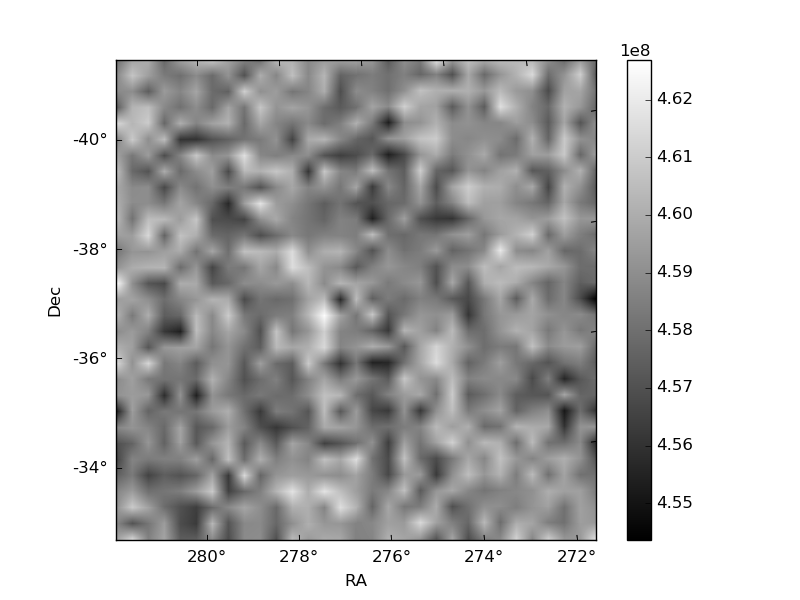
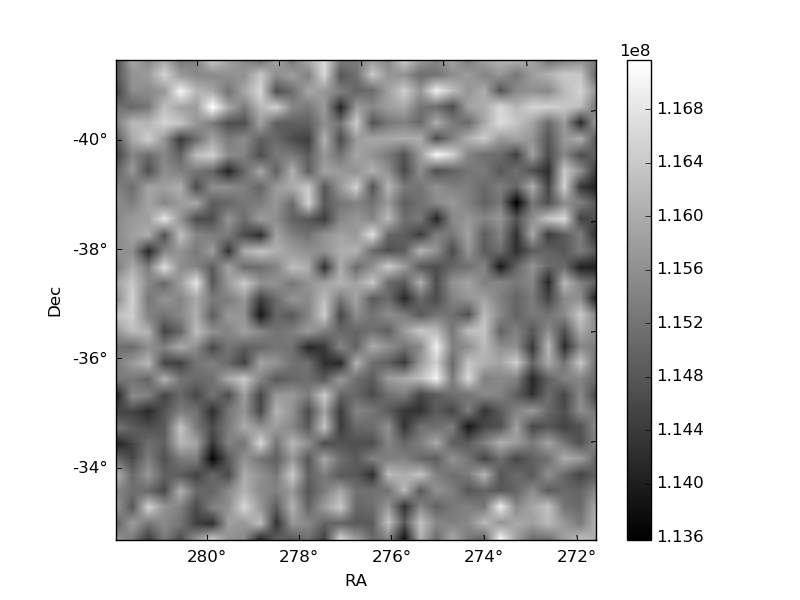
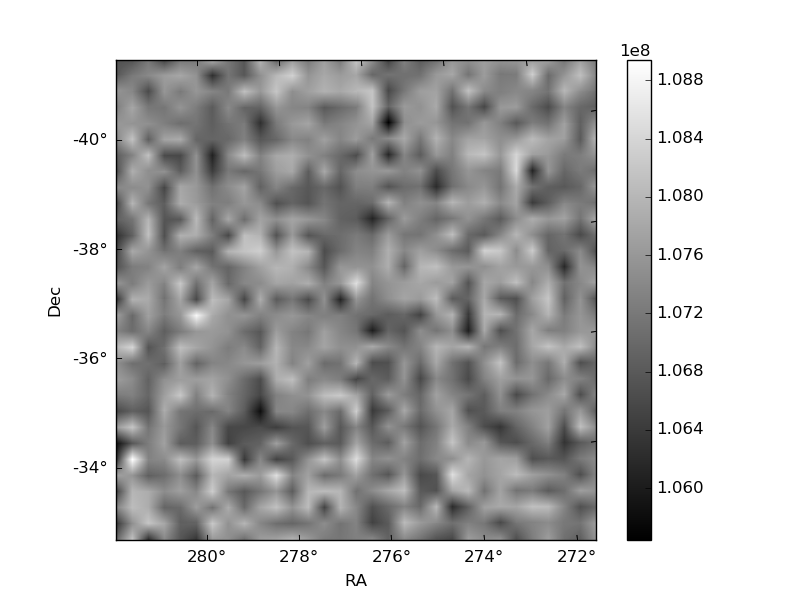
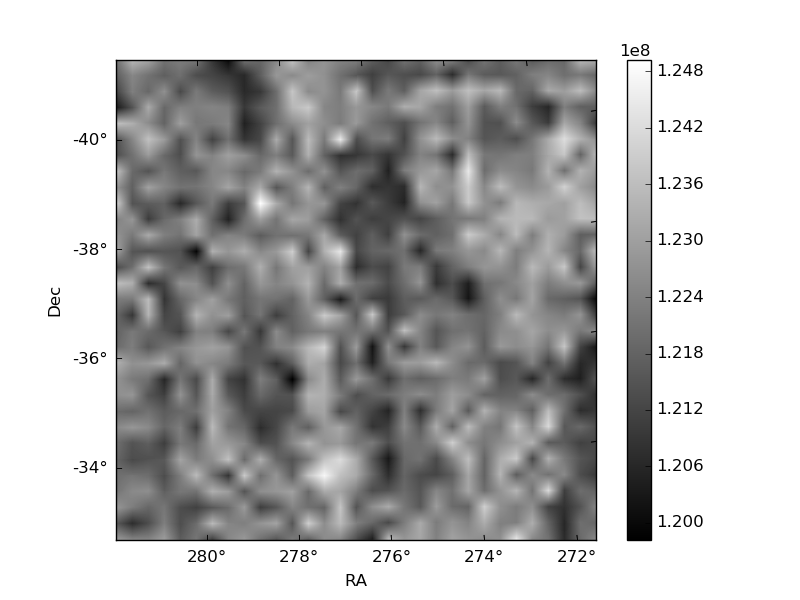
Histogram calculated using DETX and DETY for each event in the final _common_clean file
| Quadrant A | 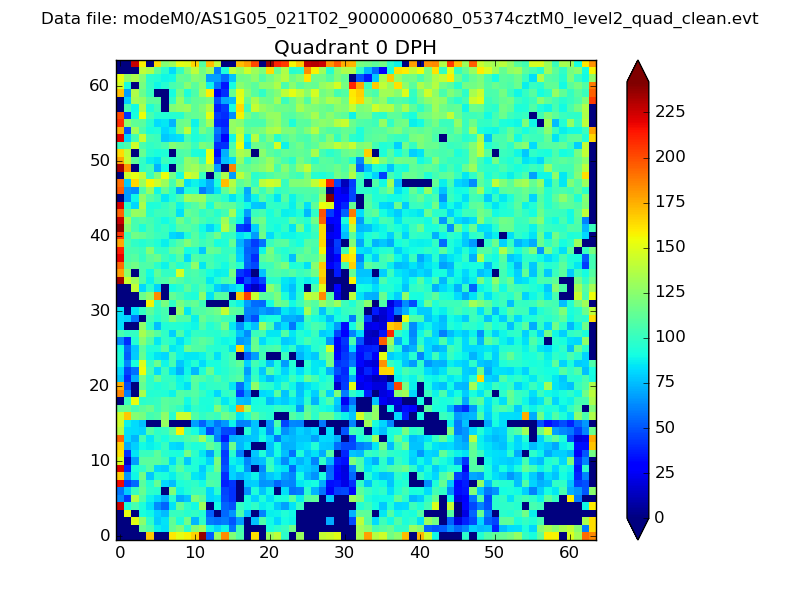 |
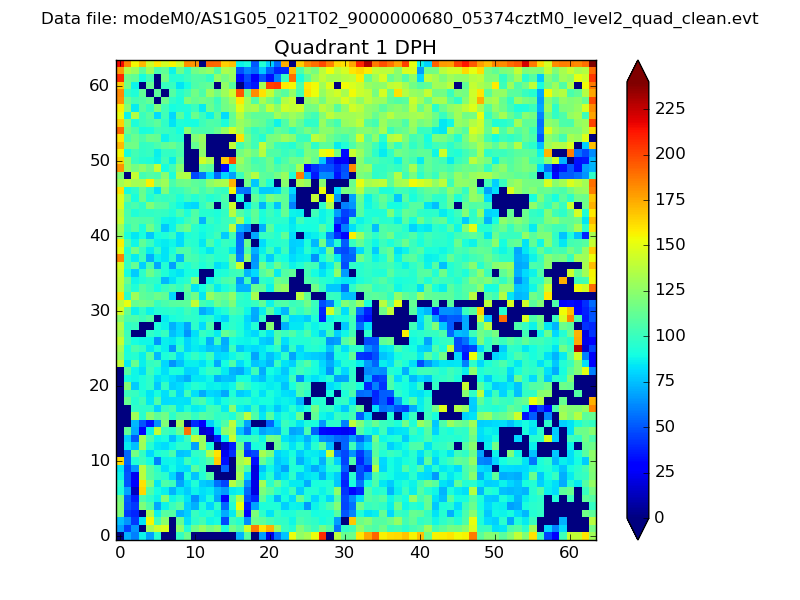 |
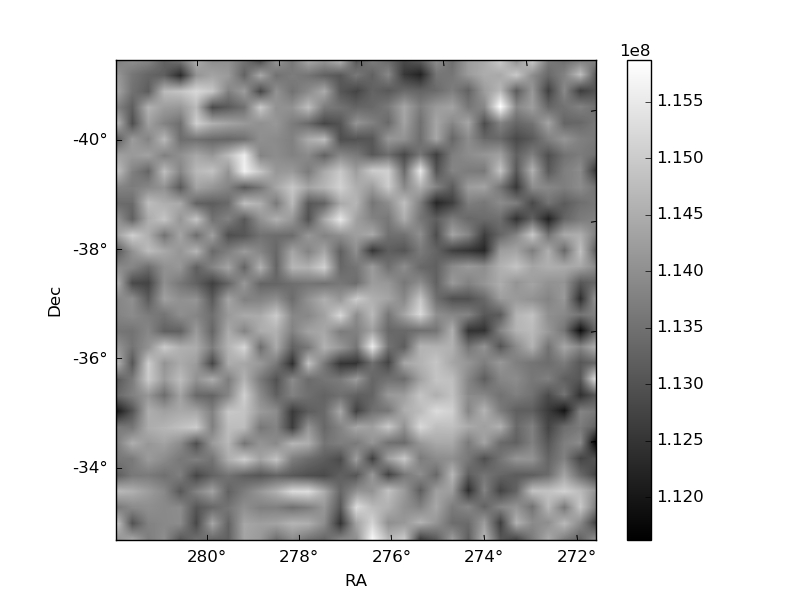
Quadrant B |
|---|---|---|---|
| Quadrant D | 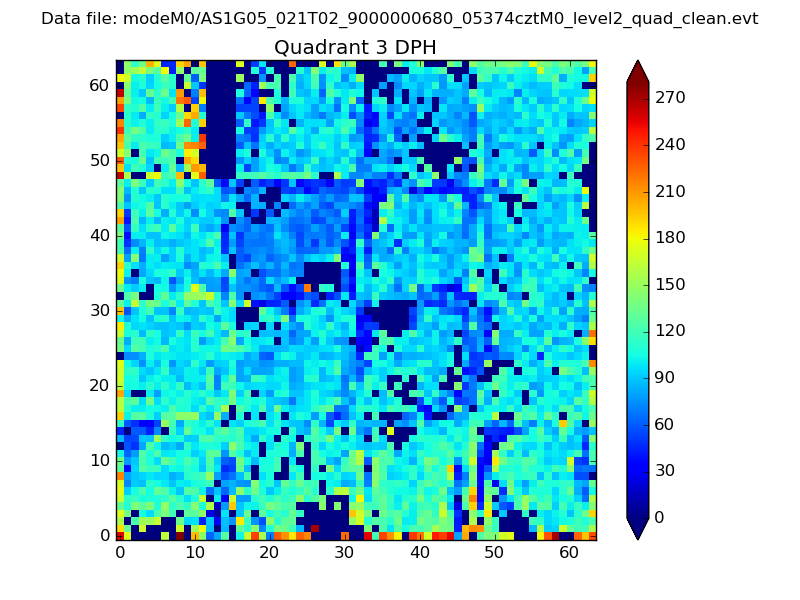 |
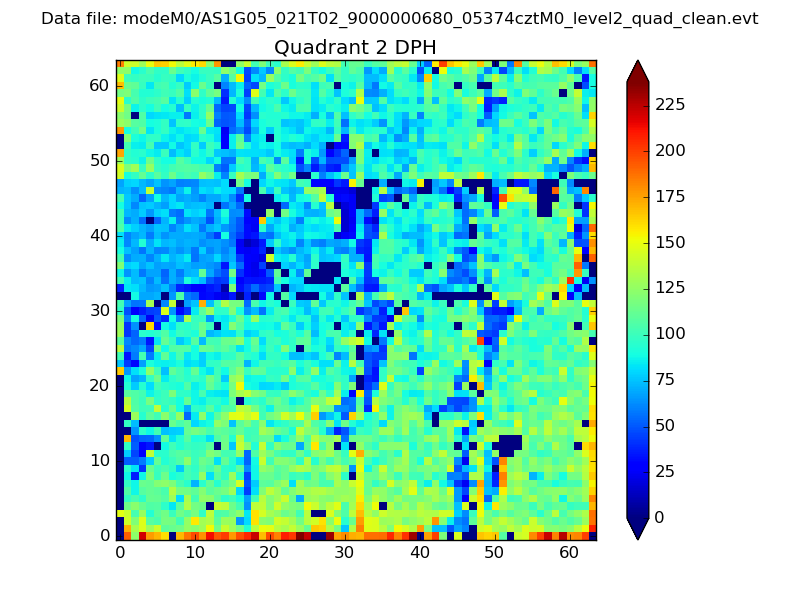 |
Quadrant C |
| Plot type | Count rate plots | Images |
|---|---|---|
| Comparison with Poisson distribution Blue bars denote a histogram of data divided into 1 sec bins. Red curve is a Poisson curve with rate = median count rate of data. |
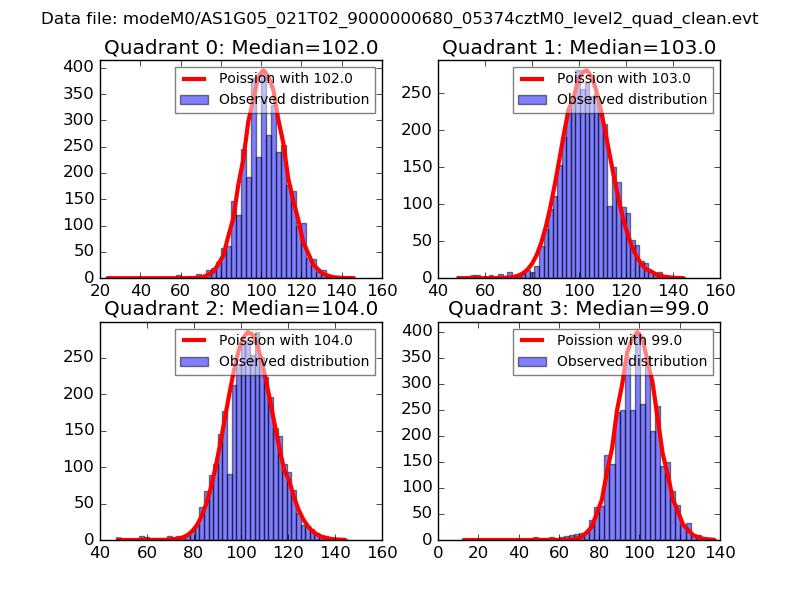 |
 |
| Quadrant-wise count rates Data is divided into 100 sec bins |
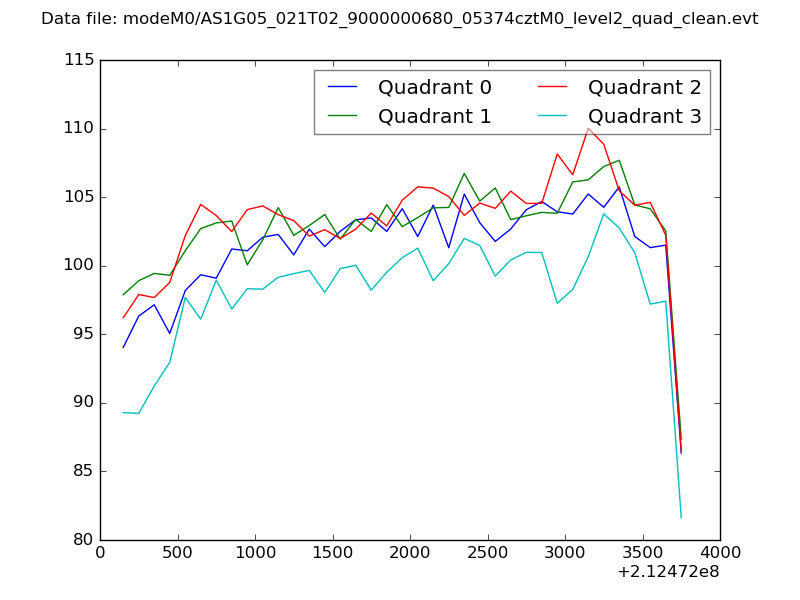 |
|
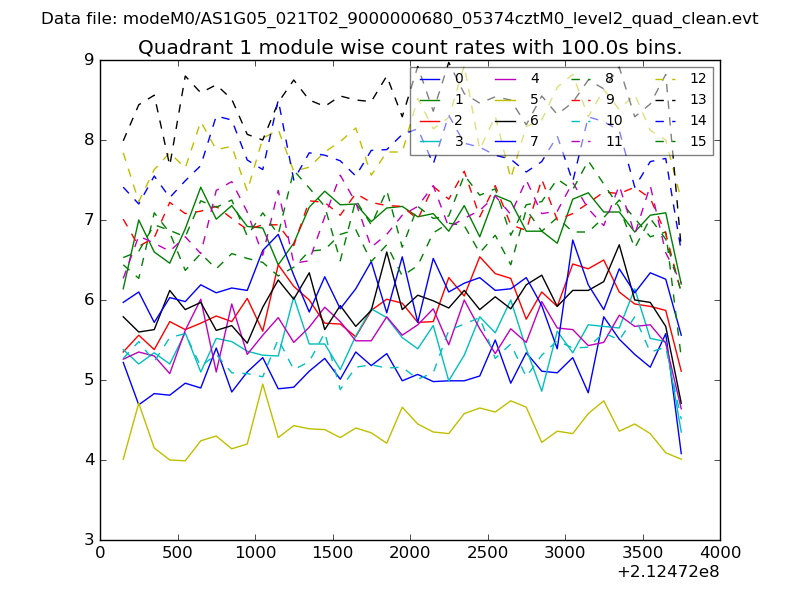
| Module-wise count rates for Quadrant A Data is divided into 100 sec bins |
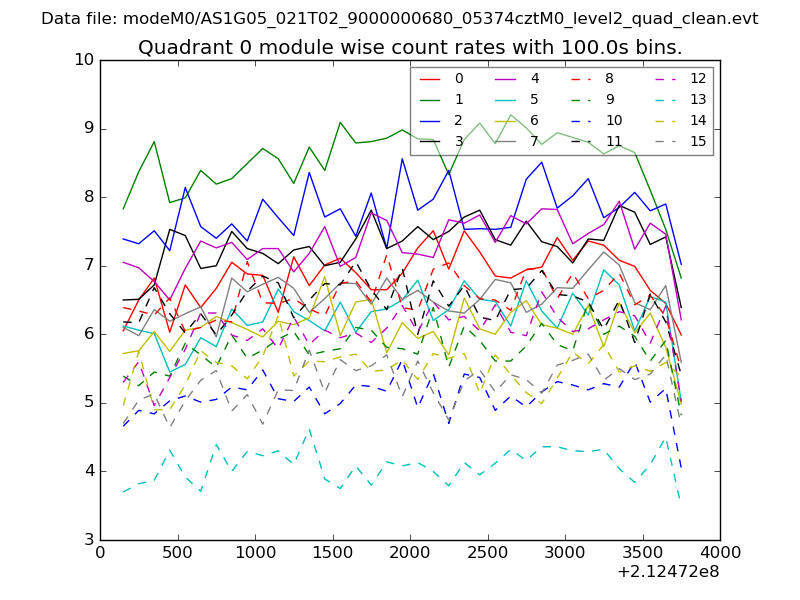 |
 |
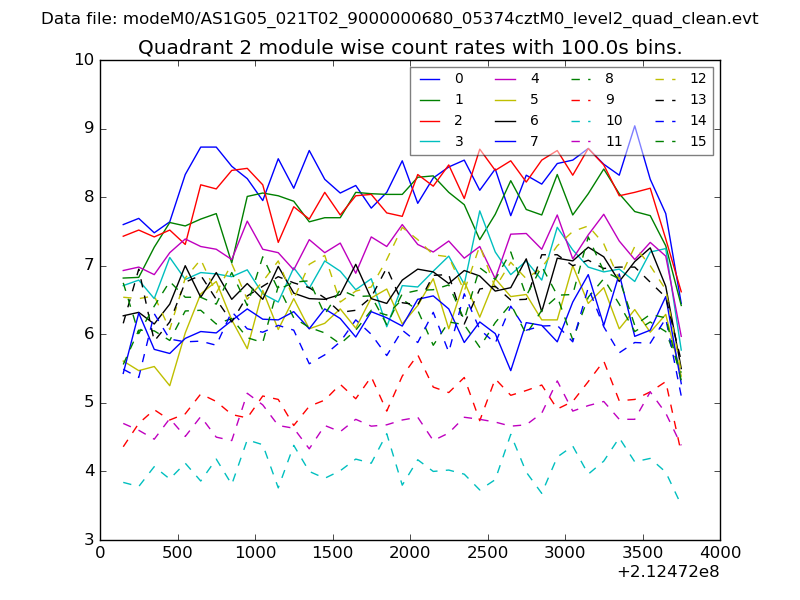
| Module-wise count rates for Quadrant B Data is divided into 100 sec bins |
 |
 |
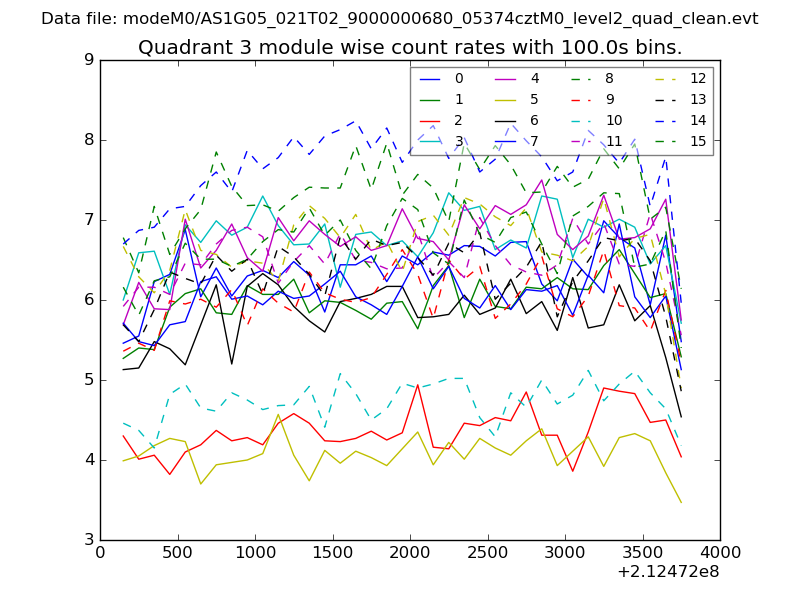
| Module-wise count rates for Quadrant C Data is divided into 100 sec bins |
 |
 |
| Module-wise count rates for Quadrant D Data is divided into 100 sec bins |
 |
 |
| Parameter | Plot |
|---|---|
| CZT HV Monitor | 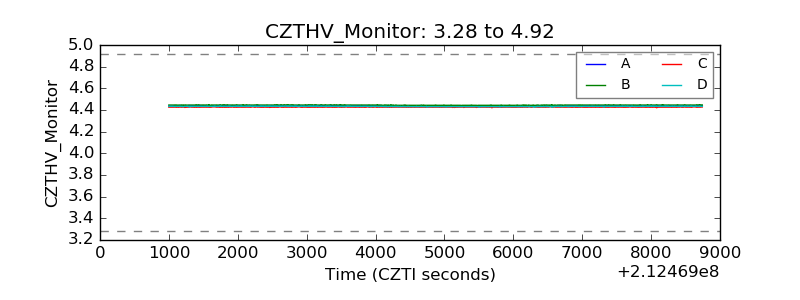 |
| D_VDD | 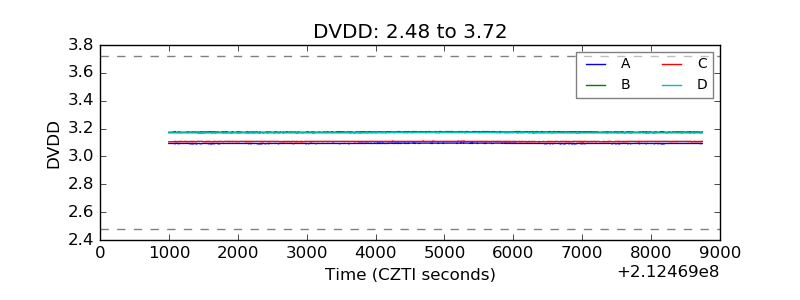 |
| Temperature 1 | 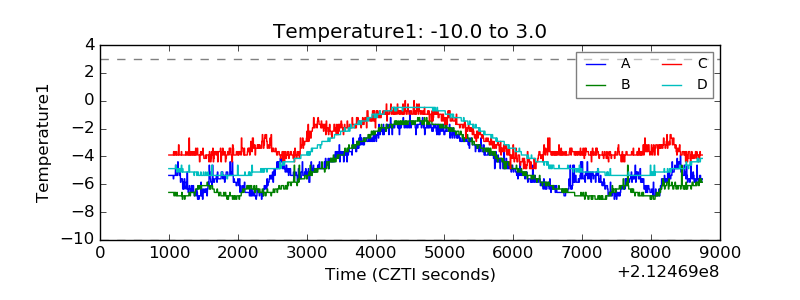 |
| Veto HV Monitor | 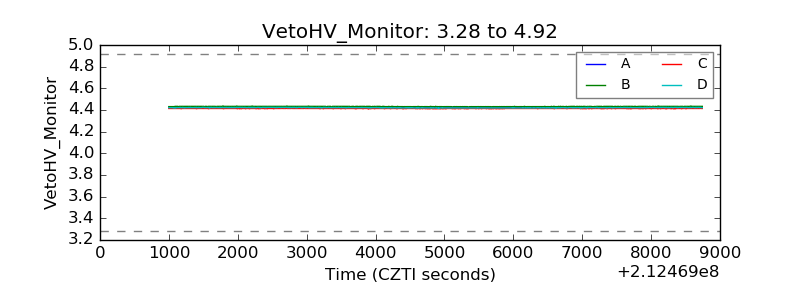 |
| Veto LLD | 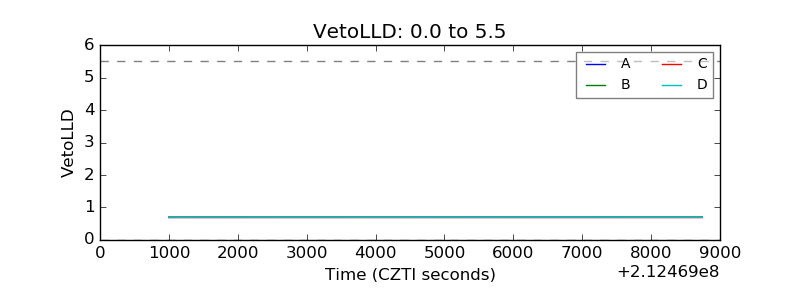 |
| Alpha Counter | 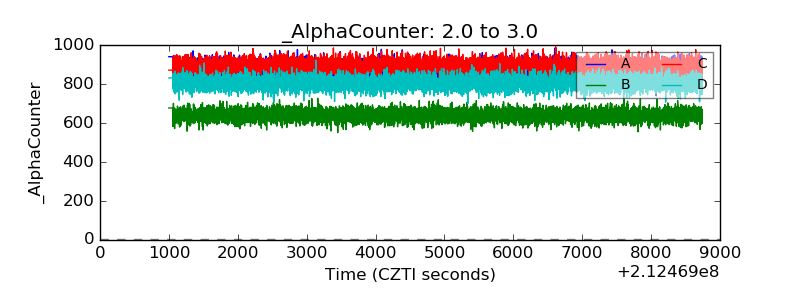 |
| _CPM_Rate | 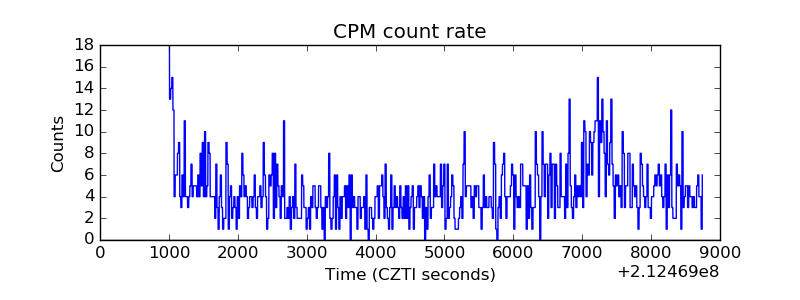 |
| CZT Counter | 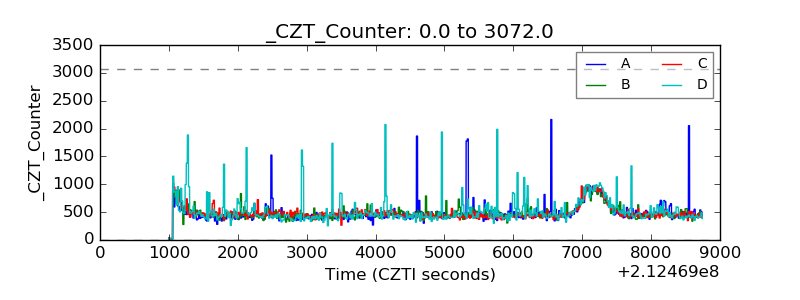 |
| +2.5 Volts monitor | 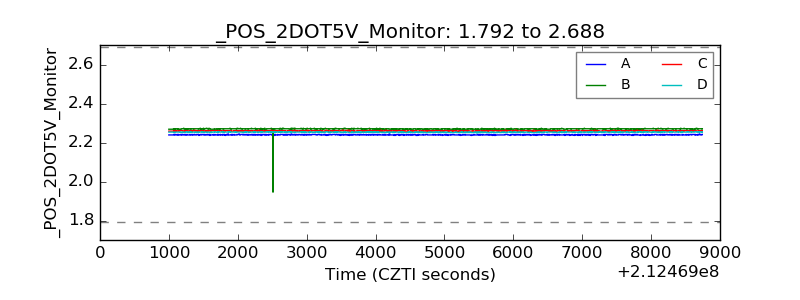 |
| +5 Volts monitor |  |
| _ROLL_ROT | 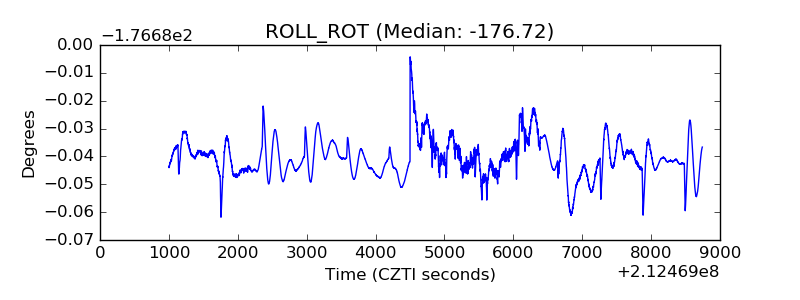 |
| _Roll_DEC | 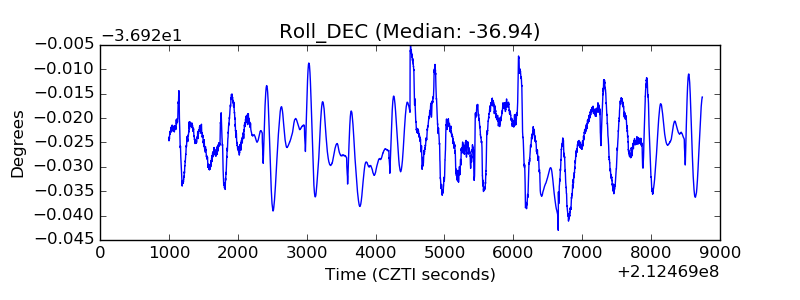 |
| _Roll_RA | 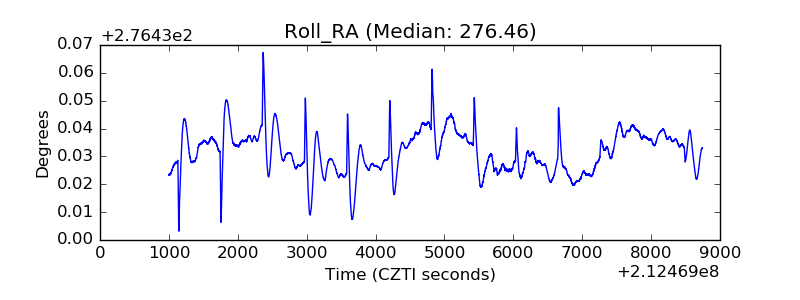 |
| Veto Counter | 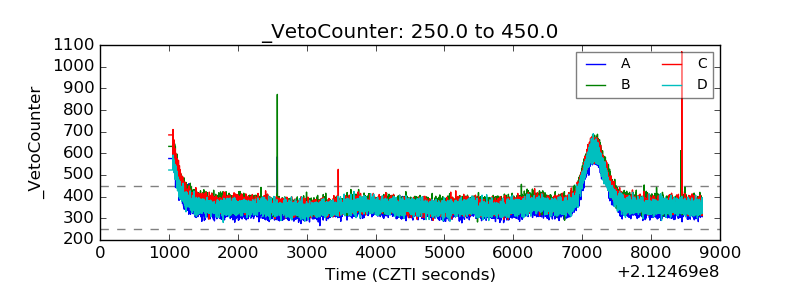 |