| Param | Original file | Final file |
|---|---|---|
| Filename | modeM0/AS1G05_021T02_9000000680_05375cztM0_level2.evt | modeM0/AS1G05_021T02_9000000680_05375cztM0_level2_quad_clean.evt |
| Size (bytes) | 589,412,160 | 72,178,560 |
| Size | 562.1 MB | 68.8 MB |
| Events in quadrant A | 4,070,375 | 406,058 |
| Events in quadrant B | 4,073,990 | 415,906 |
| Events in quadrant C | 4,085,804 | 417,169 |
| Events in quadrant D | 5,059,104 | 372,474 |
| Mode M0 | |||
|---|---|---|---|
| Quadrant | BADHDUFLAG | Total packets | Discarded packets |
| A | 0 | 17891 | 25 |
| B | 0 | 17618 | 12 |
| C | 0 | 17653 | 25 |
| D | 0 | 21049 | 61 |
| Mode SS | |||
|---|---|---|---|
| Quadrant | BADHDUFLAG | Total packets | Discarded packets |
| A | 0 | 166 | 0 |
| B | 0 | 166 | 0 |
| C | 0 | 166 | 0 |
| D | 0 | 166 | 0 |
| Quadrant | Total seconds | Saturated seconds | Saturation percentage |
|---|---|---|---|
| A | 8251 | 483 | 5.853836% |
| B | 8256 | 485 | 5.874516% |
| C | 8251 | 396 | 4.799418% |
| D | 8247 | 820 | 9.943010% |
Noise dominated data is calculated using 1-second bins in cleaned event files. If a bin has >2000 counts, and if more than 50% of those come from <1% of pixels, then it is considered to be noise-dominated and hence unusable.
| Quadrant | # 1 sec bins | Bins with >0 counts | Bins with >2000 counts | High rate bins dominated by noise | Noise dominated (total time) | Noise dominated (detector-on time) | Marked lightcurve |
|---|---|---|---|---|---|---|---|
| A | 8262 | 8261 | 28 | 28 | 0.34% | 0.34% | 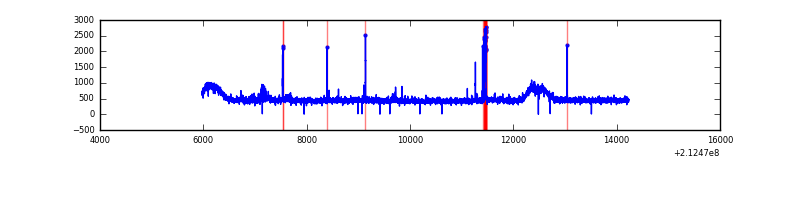 |
| B | 8262 | 8262 | 0 | 0 | 0.00% | 0.00% | 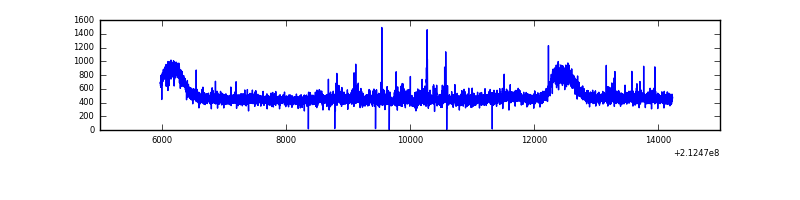 |
| C | 8262 | 8261 | 8 | 8 | 0.10% | 0.10% | 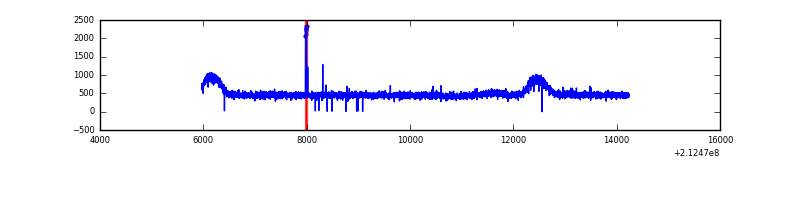 |
| D | 8262 | 8257 | 431 | 431 | 5.22% | 5.22% | 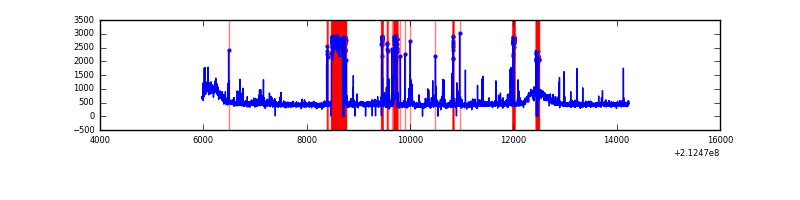 |
Top three noisy pixels from each quadrant. If the there are fewer than three noisy pixels in the level2.evt file, extra rows are filled as -1
| Pixel properties | Quadrant properties | ||||||
|---|---|---|---|---|---|---|---|
| Quadrant | DetID | PixID | Counts | Sigma | Mean | Median | Sigma |
| A | 0 | 50 | 141682 | 669.62 | 1008 | 982 | 210.1 |
| A | 15 | 174 | 48398 | 225.66 | 1008 | 982 | 210.1 |
| A | 12 | 194 | 10114 | 43.46 | 1008 | 982 | 210.1 |
| B | 4 | 80 | 25831 | 123.16 | 1026 | 996 | 201.6 |
| B | 15 | 204 | 19581 | 92.17 | 1026 | 996 | 201.6 |
| B | 12 | 111 | 18767 | 88.13 | 1026 | 996 | 201.6 |
| C | 1 | 16 | 168221 | 719.66 | 995 | 996 | 232.4 |
| C | 9 | 247 | 29000 | 120.52 | 995 | 996 | 232.4 |
| C | 13 | 61 | 8208 | 31.04 | 995 | 996 | 232.4 |
| D | 7 | 237 | 891126 | 3720.17 | 957 | 923 | 239.3 |
| D | 2 | 33 | 205486 | 854.87 | 957 | 923 | 239.3 |
| D | 2 | 136 | 124760 | 517.52 | 957 | 923 | 239.3 |
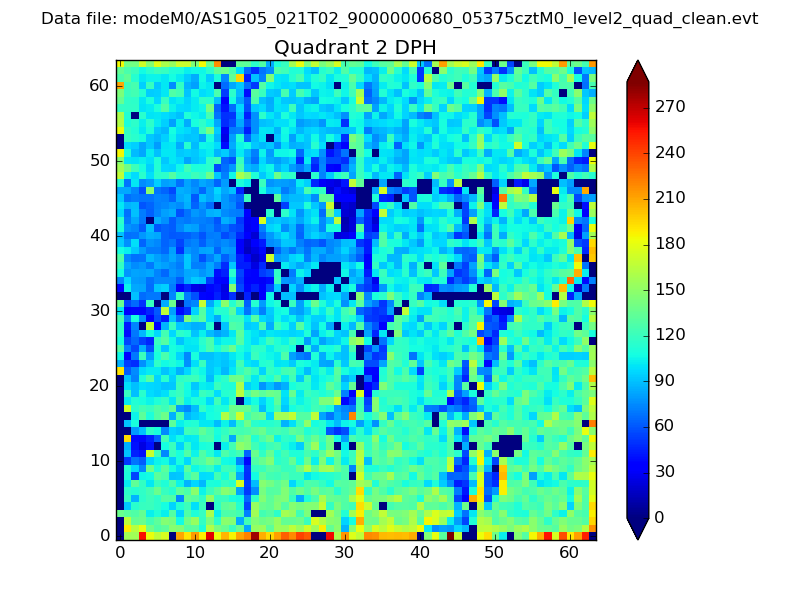
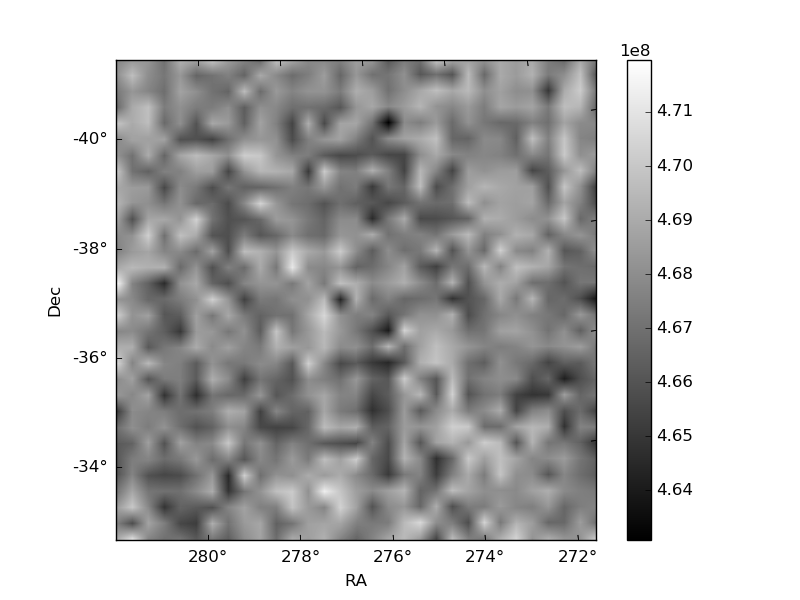
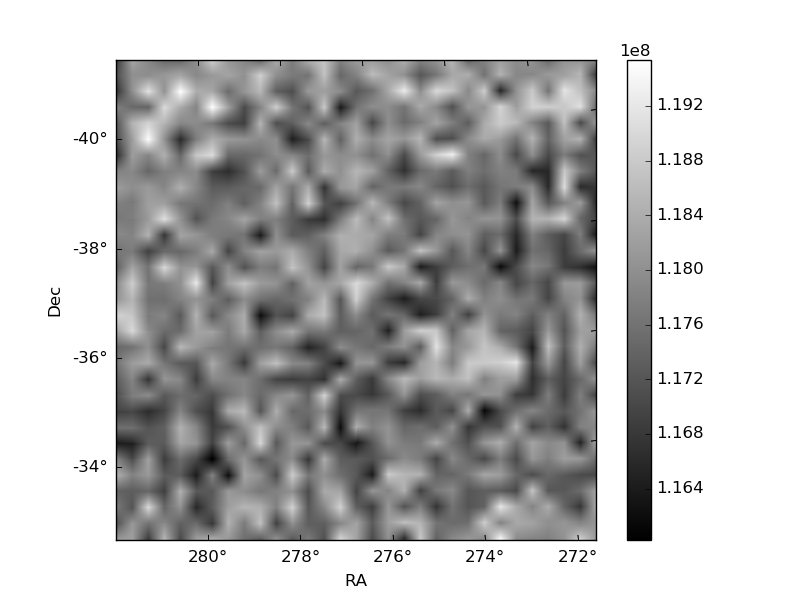
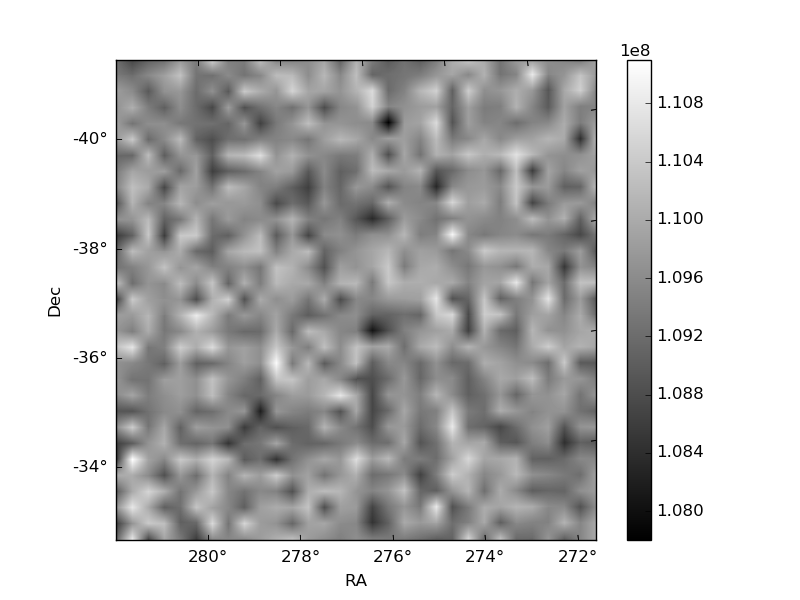
Histogram calculated using DETX and DETY for each event in the final _common_clean file
| Quadrant A | 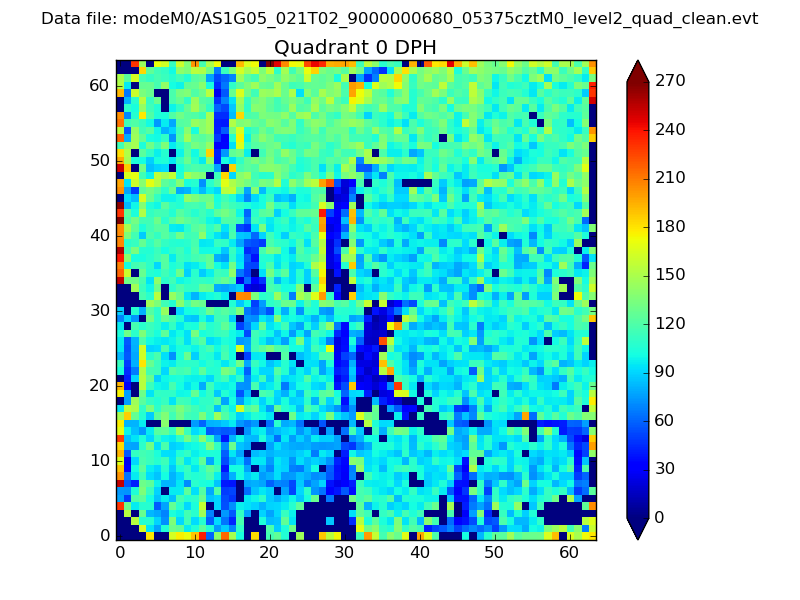 |
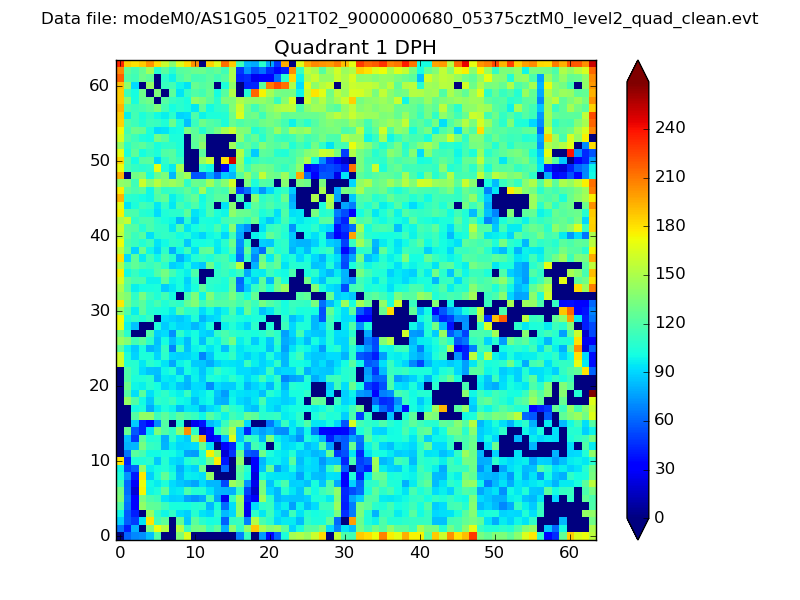 |
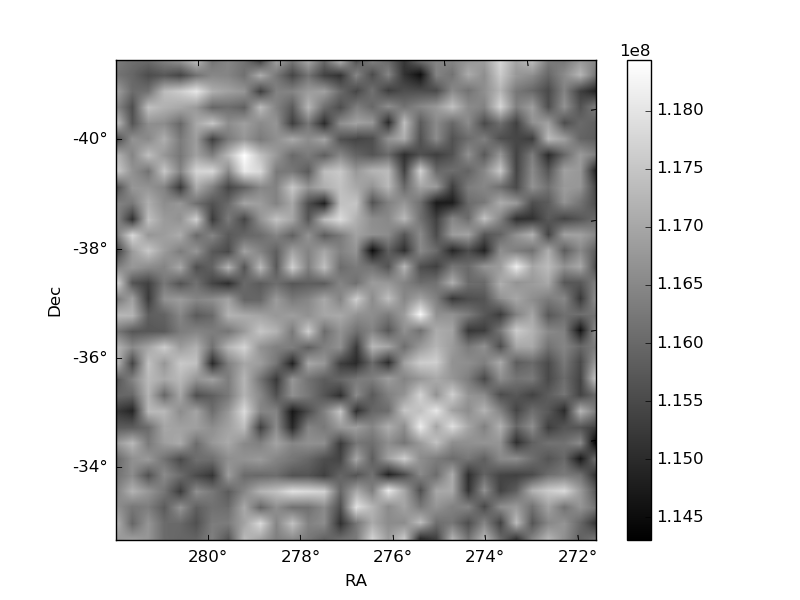
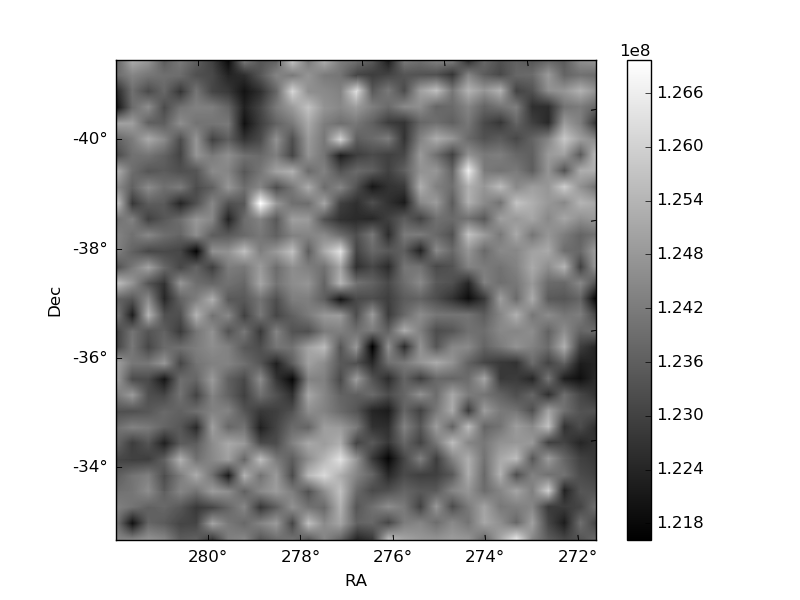
Quadrant B |
|---|---|---|---|
| Quadrant D | 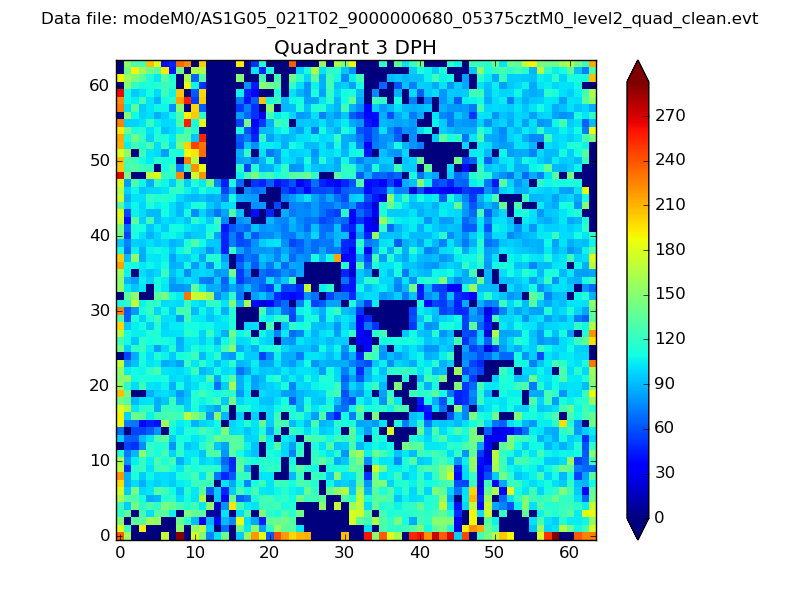 |
 |
Quadrant C |
| Plot type | Count rate plots | Images |
|---|---|---|
| Comparison with Poisson distribution Blue bars denote a histogram of data divided into 1 sec bins. Red curve is a Poisson curve with rate = median count rate of data. |
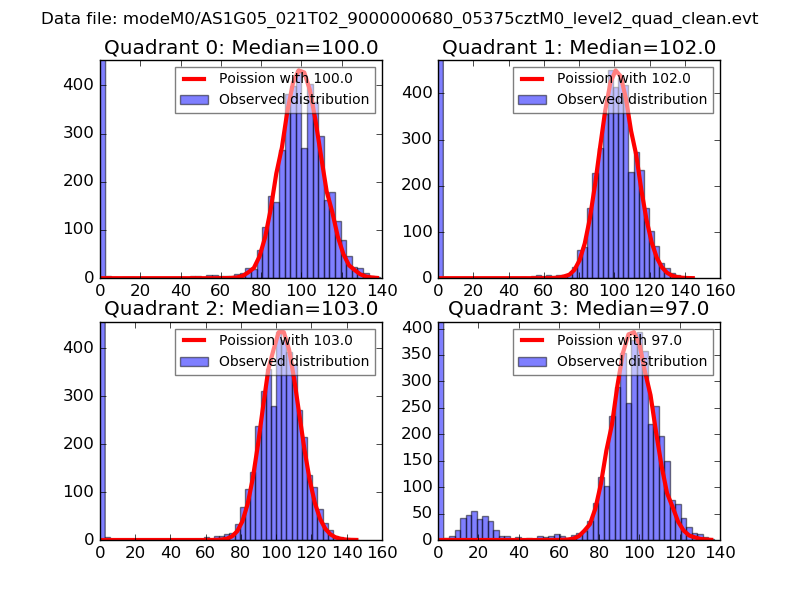 |
 |
| Quadrant-wise count rates Data is divided into 100 sec bins |
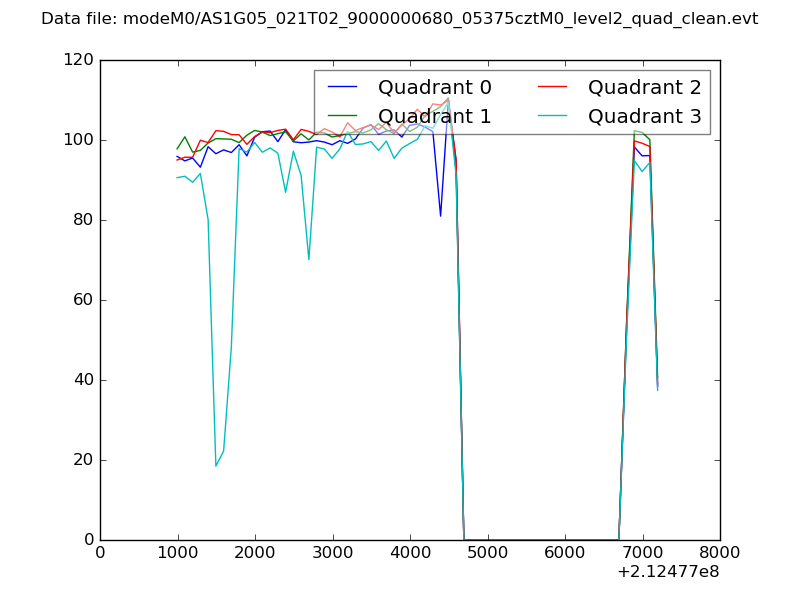 |
|
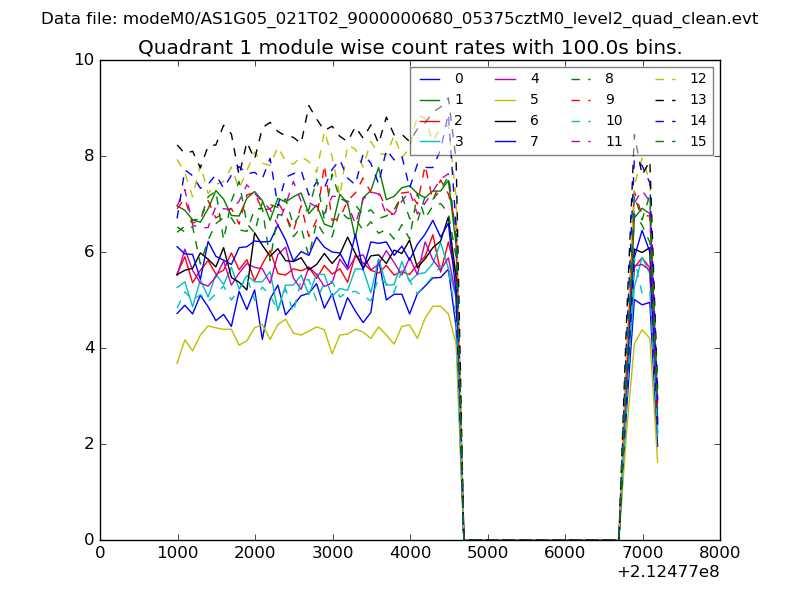
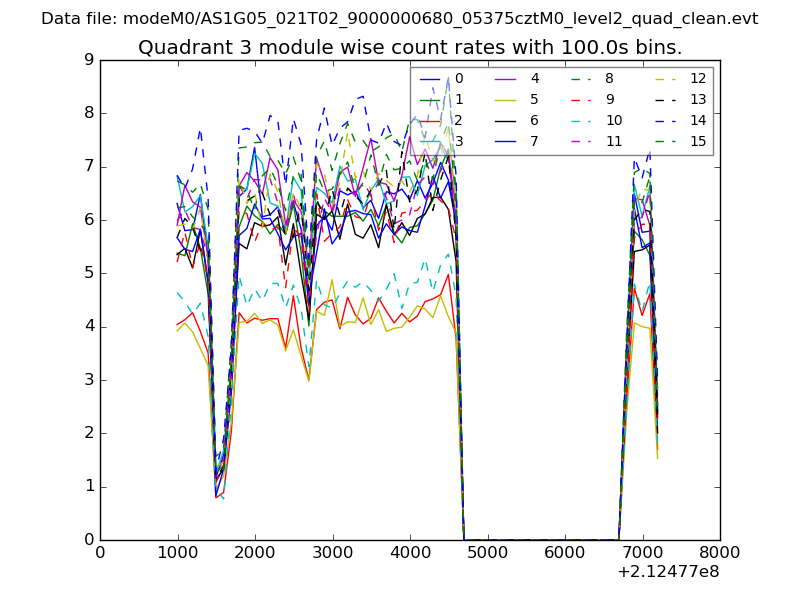
| Module-wise count rates for Quadrant A Data is divided into 100 sec bins |
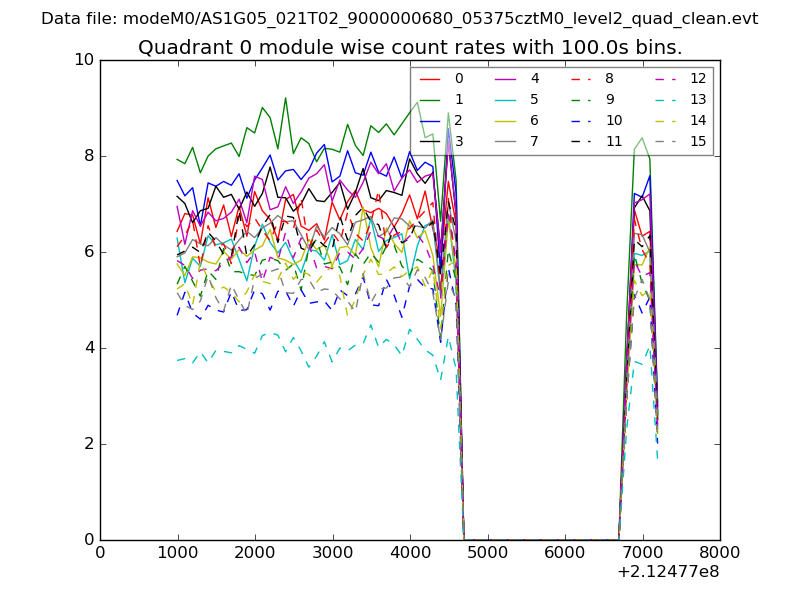 |
 |
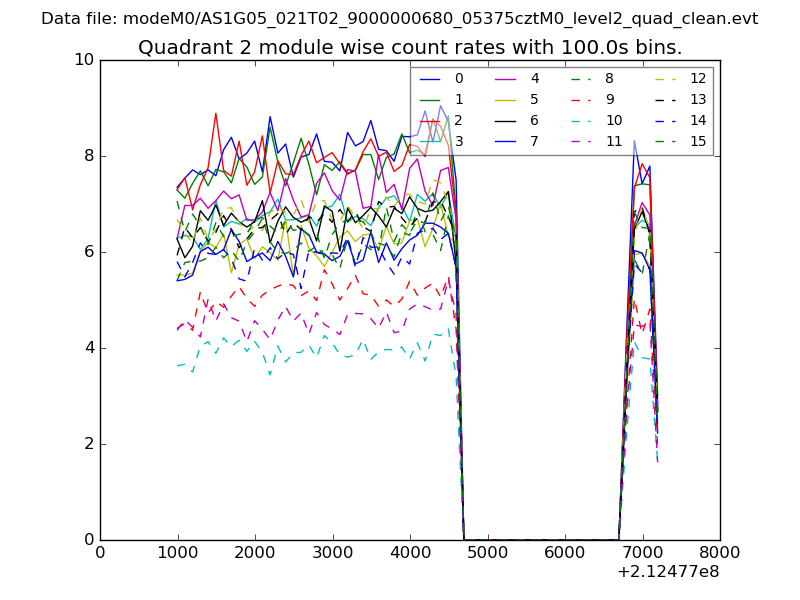
| Module-wise count rates for Quadrant B Data is divided into 100 sec bins |
 |
 |
| Module-wise count rates for Quadrant C Data is divided into 100 sec bins |
 |
 |
| Module-wise count rates for Quadrant D Data is divided into 100 sec bins |
 |
 |
| Parameter | Plot |
|---|---|
| CZT HV Monitor | 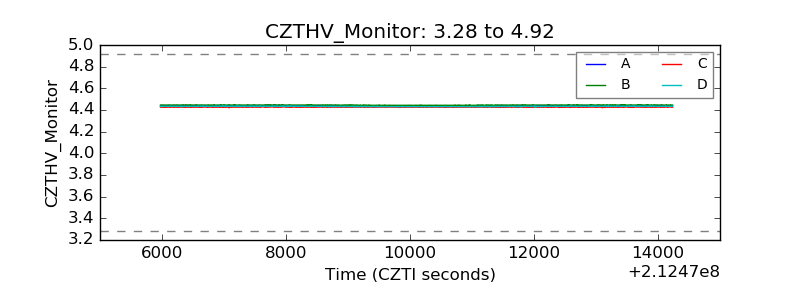 |
| D_VDD | 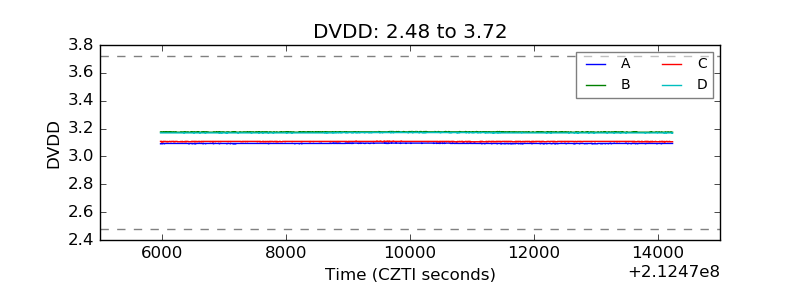 |
| Temperature 1 |  |
| Veto HV Monitor | 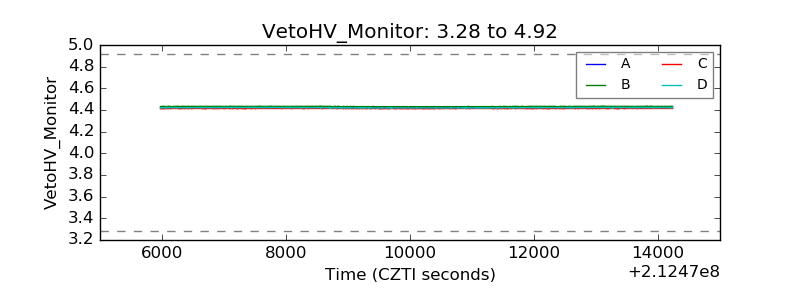 |
| Veto LLD | 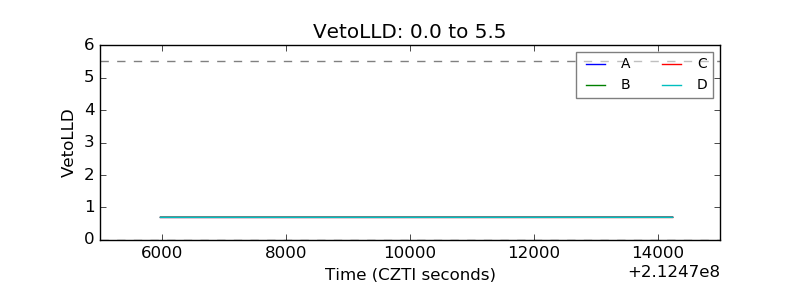 |
| Alpha Counter | 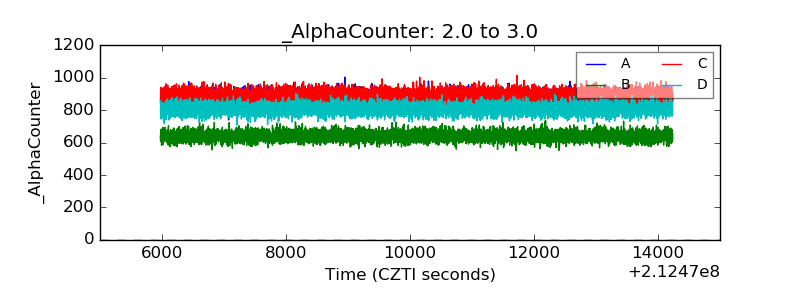 |
| _CPM_Rate | 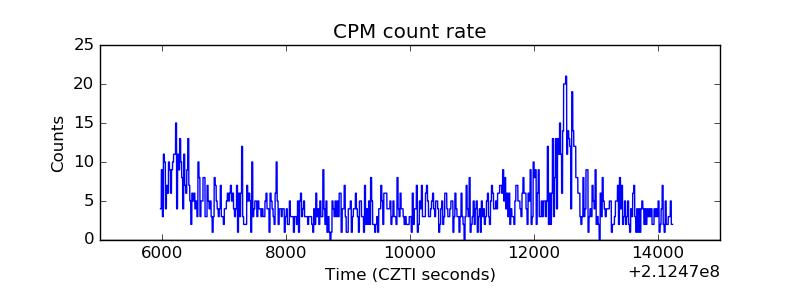 |
| CZT Counter | 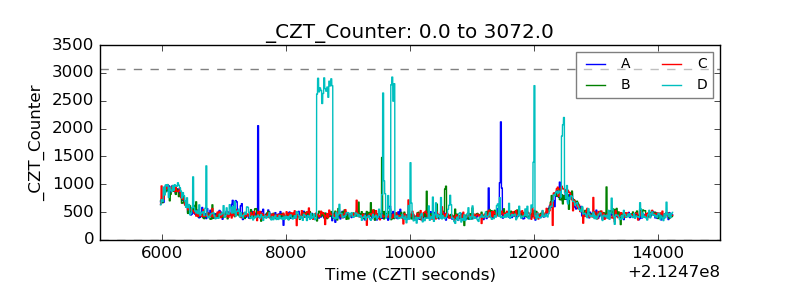 |
| +2.5 Volts monitor |  |
| +5 Volts monitor | 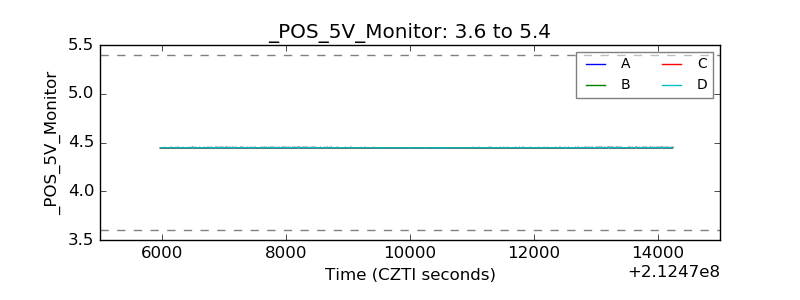 |
| _ROLL_ROT | 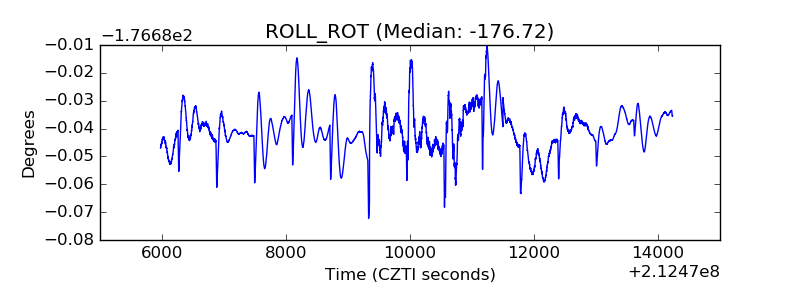 |
| _Roll_DEC | 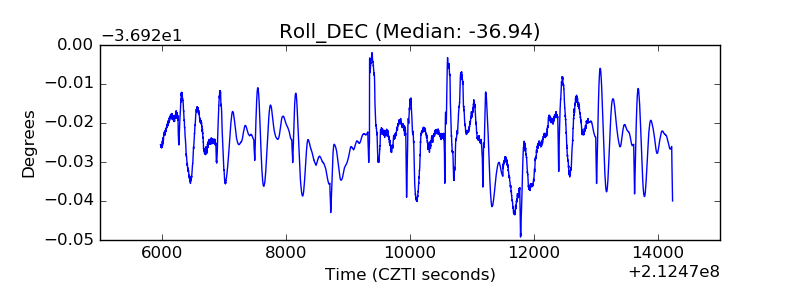 |
| _Roll_RA | 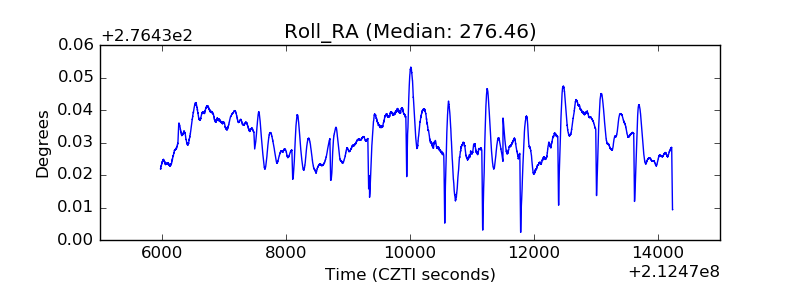 |
| Veto Counter | 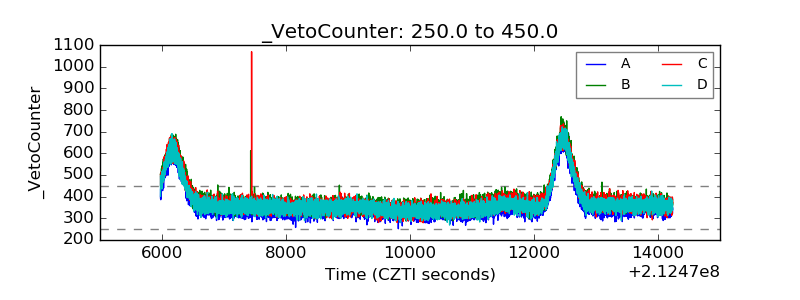 |