| Param | Original file | Final file |
|---|---|---|
| Filename | modeM0/AS1G05_021T02_9000000680_05378cztM0_level2.evt | modeM0/AS1G05_021T02_9000000680_05378cztM0_level2_quad_clean.evt |
| Size (bytes) | 1,204,295,040 | 186,626,880 |
| Size | 1.1 GB | 178.0 MB |
| Events in quadrant A | 8,390,555 | 1,135,191 |
| Events in quadrant B | 8,232,594 | 1,151,651 |
| Events in quadrant C | 8,062,760 | 1,157,809 |
| Events in quadrant D | 10,622,215 | 1,020,970 |
| Mode M0 | |||
|---|---|---|---|
| Quadrant | BADHDUFLAG | Total packets | Discarded packets |
| A | 0 | 37137 | 28 |
| B | 0 | 35928 | 9 |
| C | 0 | 35385 | 18 |
| D | 0 | 44017 | 42 |
| Mode SS | |||
|---|---|---|---|
| Quadrant | BADHDUFLAG | Total packets | Discarded packets |
| A | 0 | 350 | 0 |
| B | 0 | 350 | 0 |
| C | 0 | 350 | 0 |
| D | 0 | 350 | 0 |
| Mode M9 | |||
|---|---|---|---|
| Quadrant | BADHDUFLAG | Total packets | Discarded packets |
| A | 0 | 17 | 0 |
| B | 0 | 17 | 0 |
| C | 0 | 17 | 0 |
| D | 0 | 17 | 0 |
| Quadrant | Total seconds | Saturated seconds | Saturation percentage |
|---|---|---|---|
| A | 17197 | 359 | 2.087573% |
| B | 17206 | 253 | 1.470417% |
| C | 17202 | 197 | 1.145216% |
| D | 17197 | 1406 | 8.175845% |
Noise dominated data is calculated using 1-second bins in cleaned event files. If a bin has >2000 counts, and if more than 50% of those come from <1% of pixels, then it is considered to be noise-dominated and hence unusable.
| Quadrant | # 1 sec bins | Bins with >0 counts | Bins with >2000 counts | High rate bins dominated by noise | Noise dominated (total time) | Noise dominated (detector-on time) | Marked lightcurve |
|---|---|---|---|---|---|---|---|
| A | 18899 | 17209 | 114 | 114 | 0.60% | 0.66% | 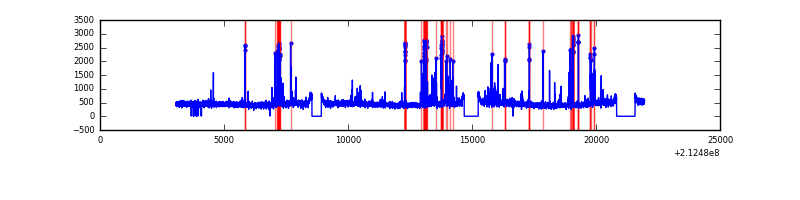 |
| B | 18899 | 17209 | 14 | 14 | 0.07% | 0.08% |  |
| C | 18899 | 17209 | 0 | 0 | 0.00% | 0.00% | 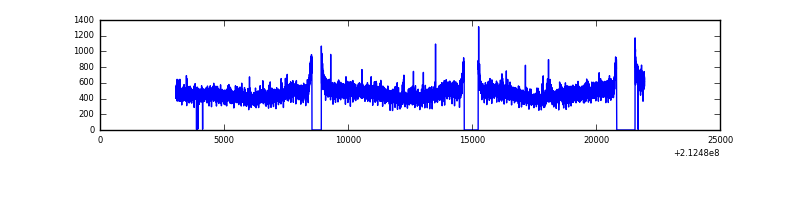 |
| D | 18898 | 17206 | 1170 | 1170 | 6.19% | 6.80% | 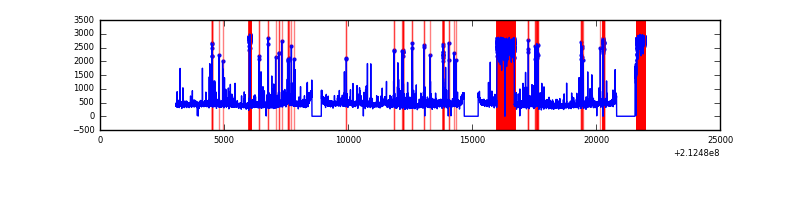 |
Top three noisy pixels from each quadrant. If the there are fewer than three noisy pixels in the level2.evt file, extra rows are filled as -1
| Pixel properties | Quadrant properties | ||||||
|---|---|---|---|---|---|---|---|
| Quadrant | DetID | PixID | Counts | Sigma | Mean | Median | Sigma |
| A | 15 | 174 | 663646 | 1641.9 | 1969 | 1928 | 403.0 |
| A | 0 | 50 | 130881 | 319.97 | 1969 | 1928 | 403.0 |
| A | 0 | 226 | 20230 | 45.41 | 1969 | 1928 | 403.0 |
| B | 4 | 80 | 128936 | 328.88 | 2001 | 1951 | 386.1 |
| B | 15 | 204 | 109336 | 278.11 | 2001 | 1951 | 386.1 |
| B | 10 | 245 | 67388 | 169.47 | 2001 | 1951 | 386.1 |
| C | 1 | 16 | 541381 | 1210.93 | 1922 | 1934 | 445.5 |
| C | 13 | 61 | 15567 | 30.6 | 1922 | 1934 | 445.5 |
| C | 12 | 4 | 12975 | 24.78 | 1922 | 1934 | 445.5 |
| D | 7 | 237 | 2759598 | 6187.79 | 1825 | 1765 | 445.7 |
| D | 2 | 136 | 306115 | 682.87 | 1825 | 1765 | 445.7 |
| D | 2 | 234 | 220071 | 489.82 | 1825 | 1765 | 445.7 |
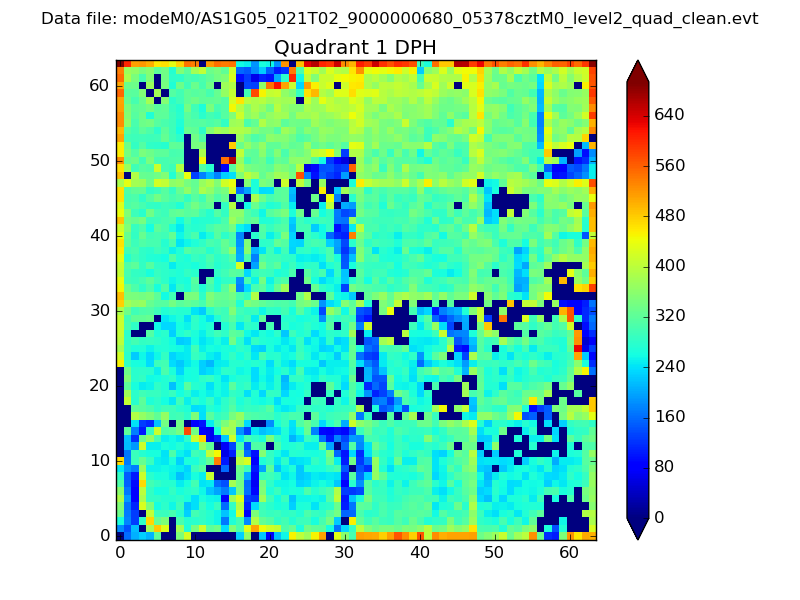
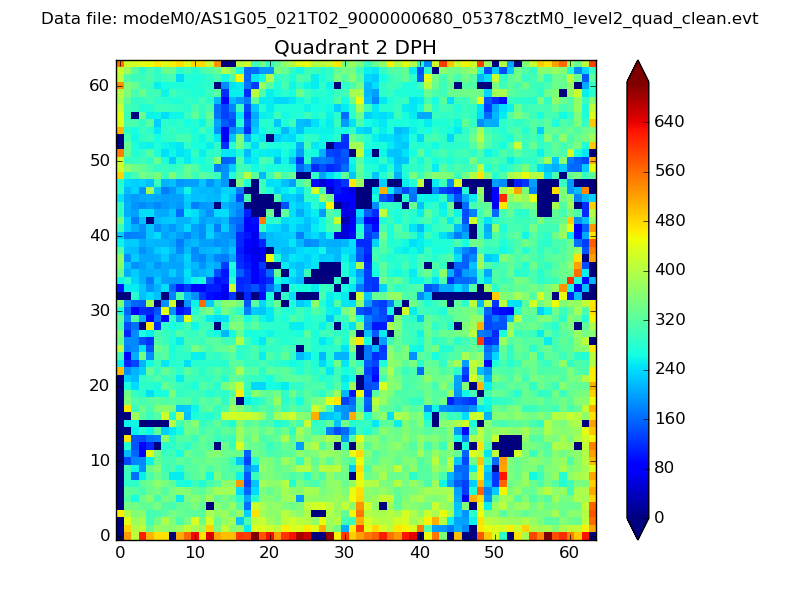
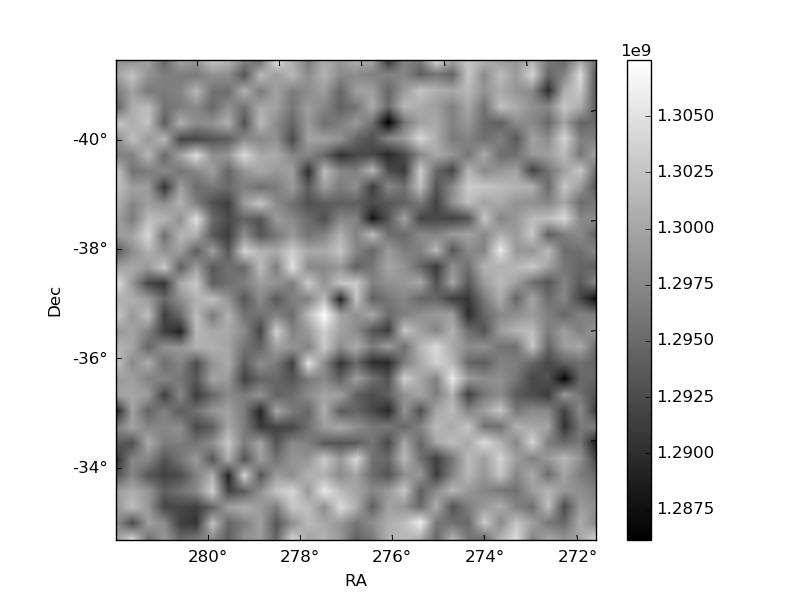
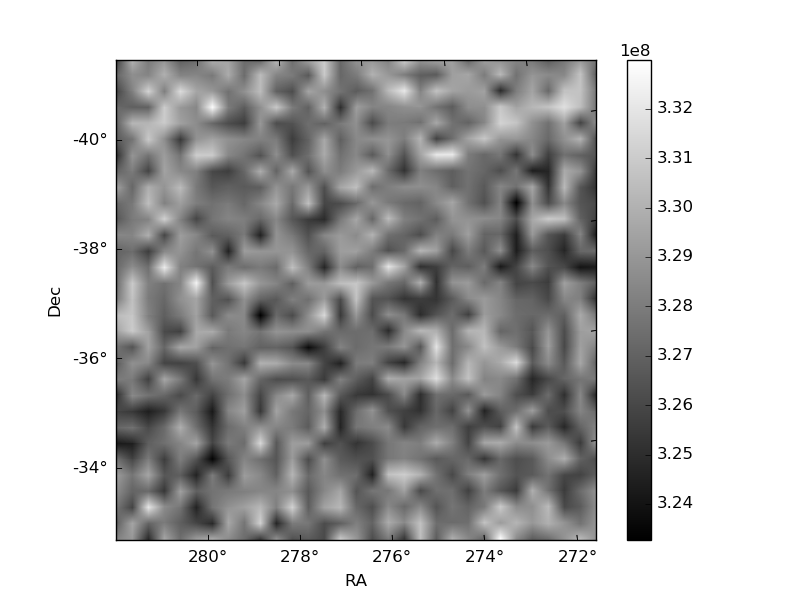
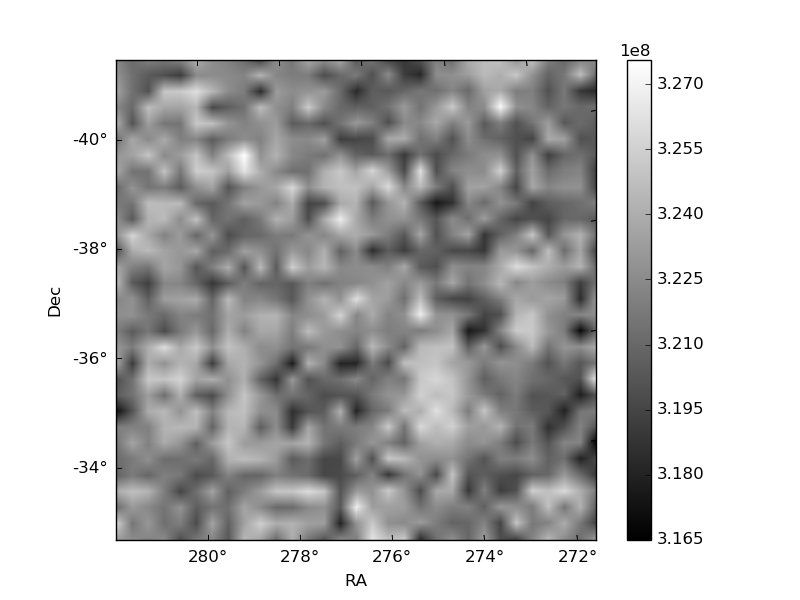
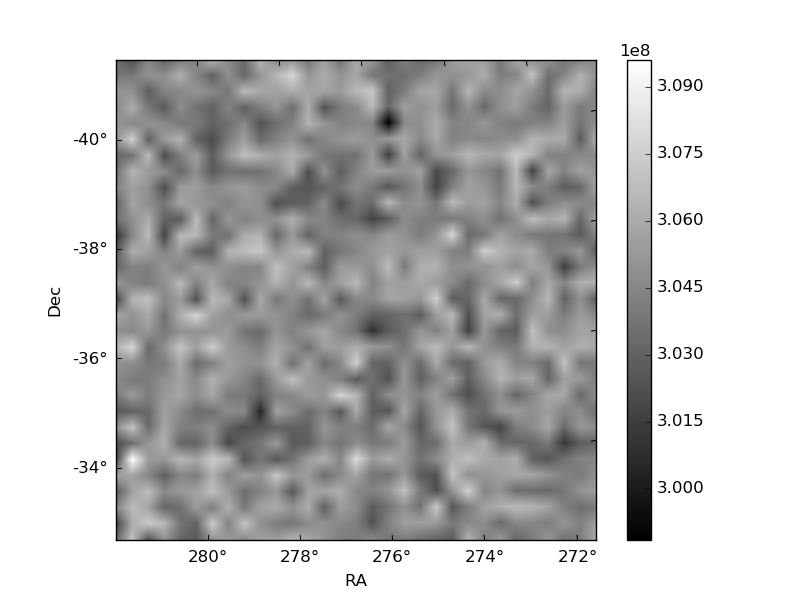
Histogram calculated using DETX and DETY for each event in the final _common_clean file
| Quadrant A | 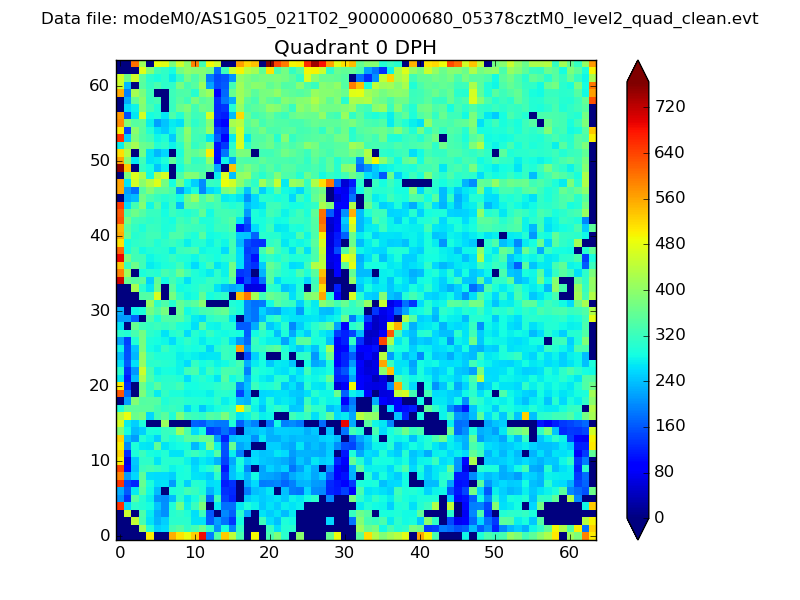 |
 |
Quadrant B |
|---|---|---|---|
| Quadrant D | 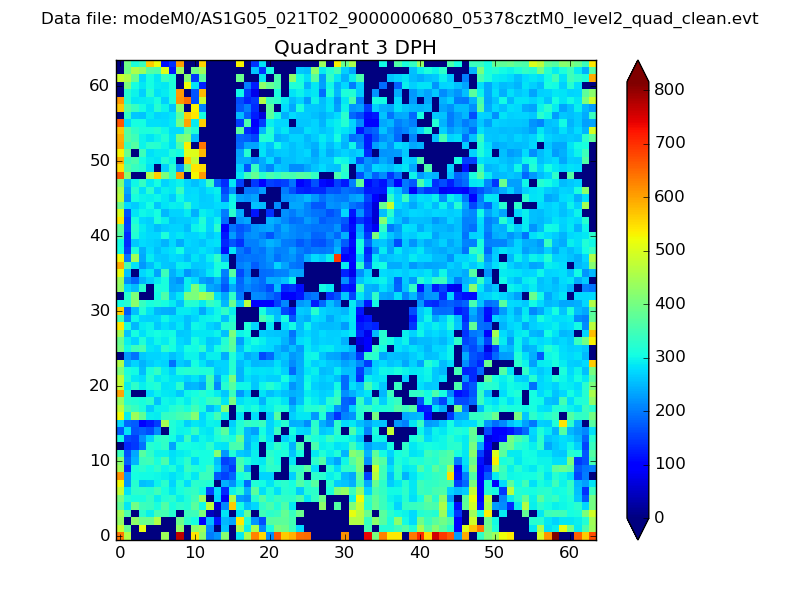 |
 |
Quadrant C |
| Plot type | Count rate plots | Images |
|---|---|---|
| Comparison with Poisson distribution Blue bars denote a histogram of data divided into 1 sec bins. Red curve is a Poisson curve with rate = median count rate of data. |
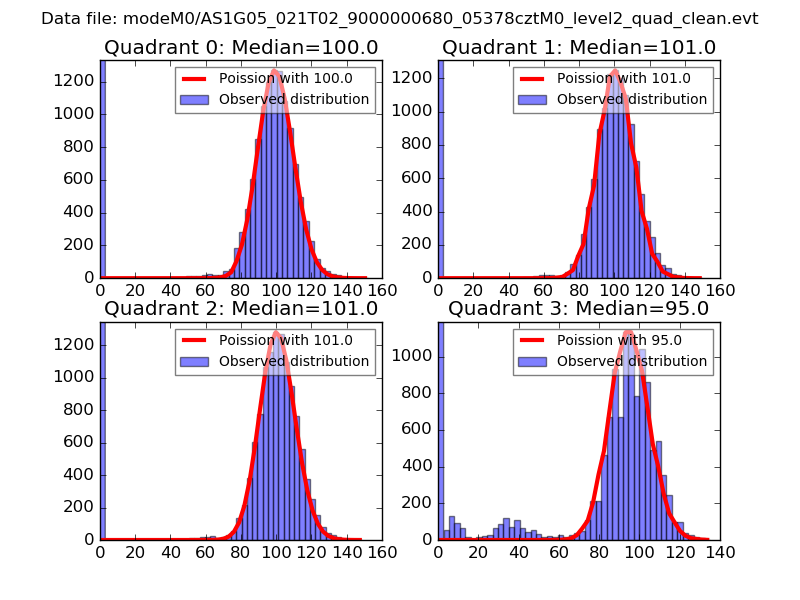 |
 |
| Quadrant-wise count rates Data is divided into 100 sec bins |
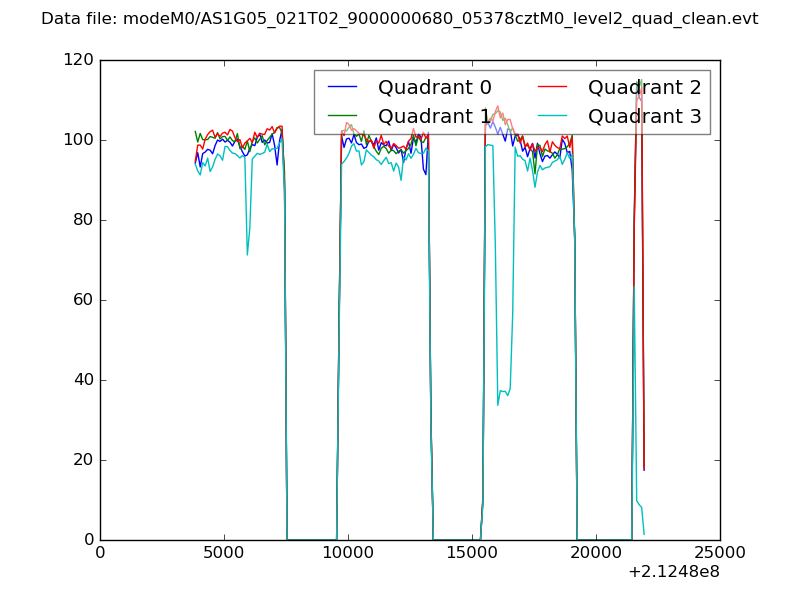 |
|
| Module-wise count rates for Quadrant A Data is divided into 100 sec bins |
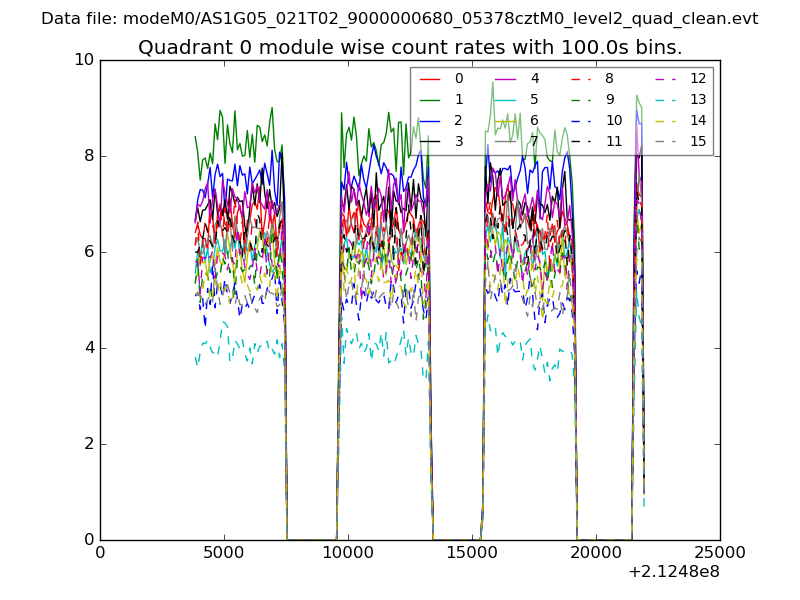 |
 |
| Module-wise count rates for Quadrant B Data is divided into 100 sec bins |
 |
 |
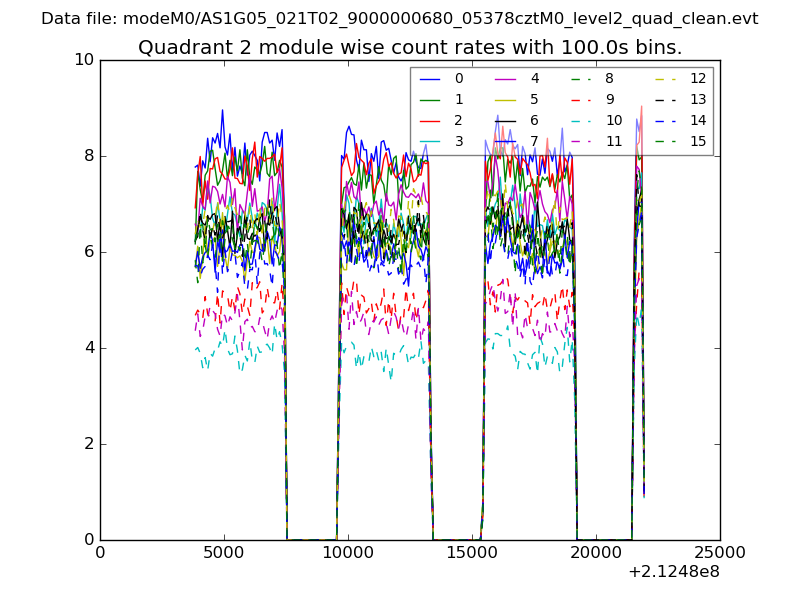
| Module-wise count rates for Quadrant C Data is divided into 100 sec bins |
 |
 |
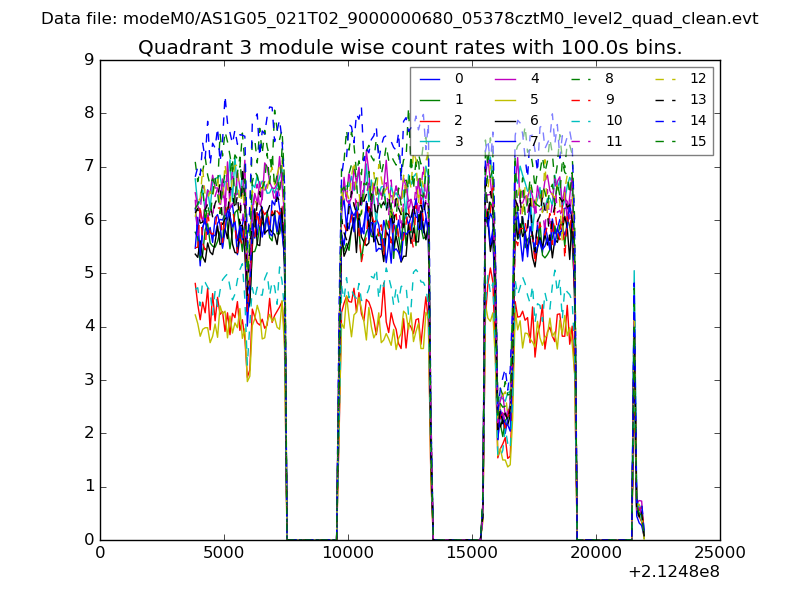
| Module-wise count rates for Quadrant D Data is divided into 100 sec bins |
 |
 |
| Parameter | Plot |
|---|---|
| CZT HV Monitor | 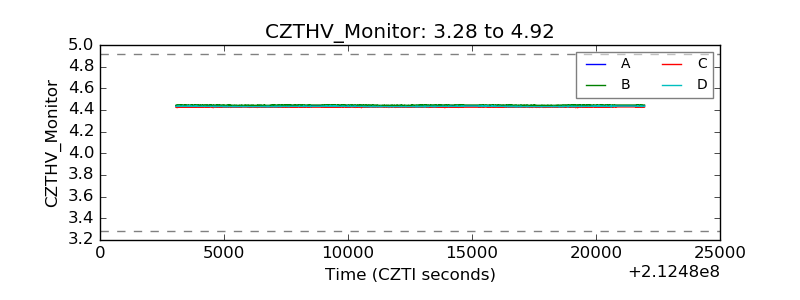 |
| D_VDD | 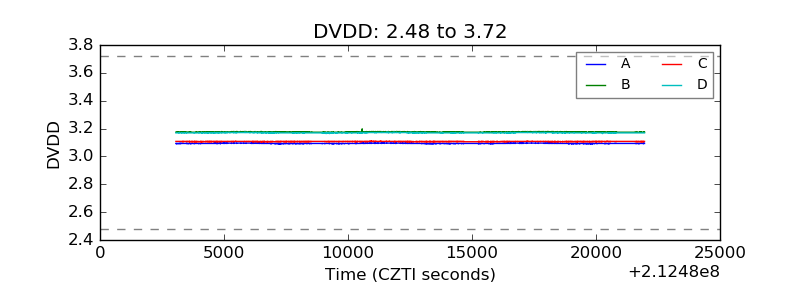 |
| Temperature 1 | 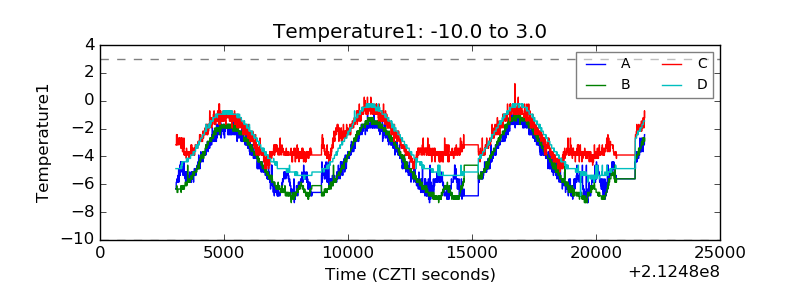 |
| Veto HV Monitor | 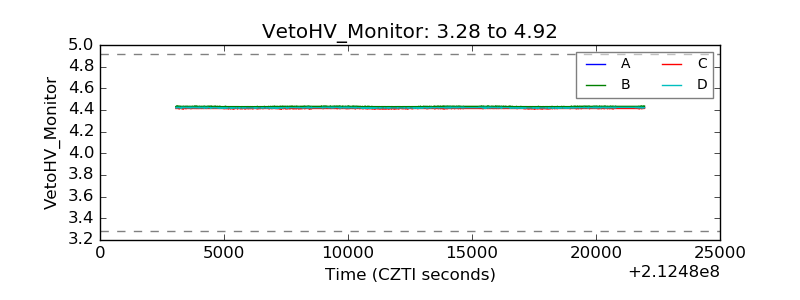 |
| Veto LLD | 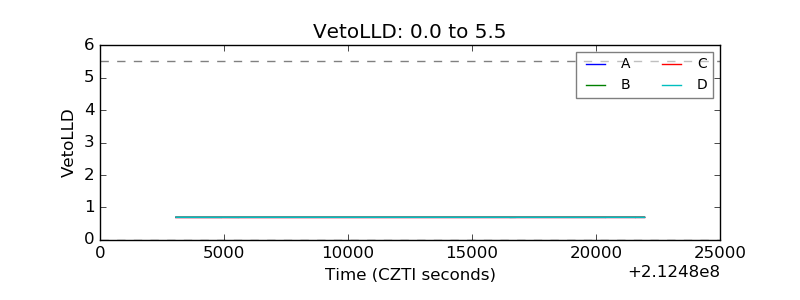 |
| Alpha Counter | 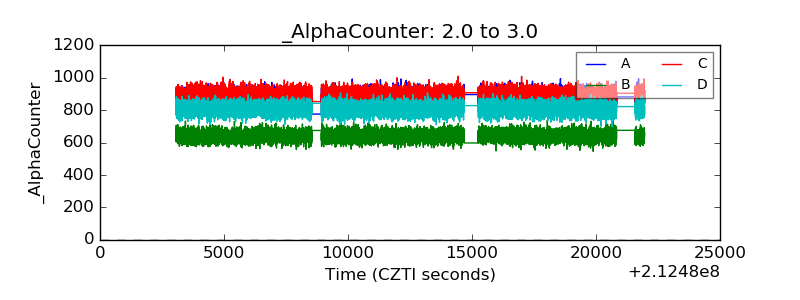 |
| _CPM_Rate | 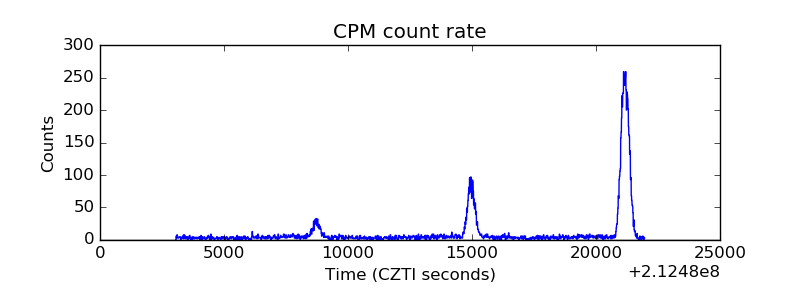 |
| CZT Counter | 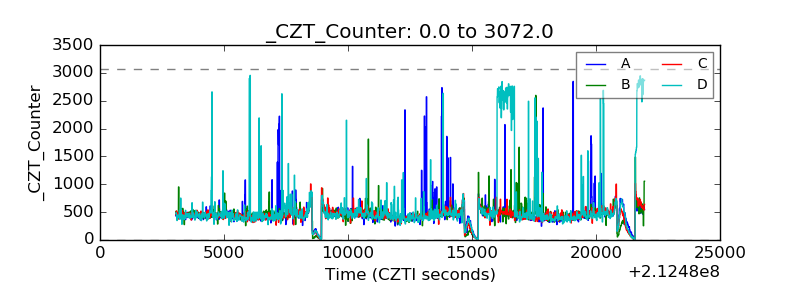 |
| +2.5 Volts monitor |  |
| +5 Volts monitor | 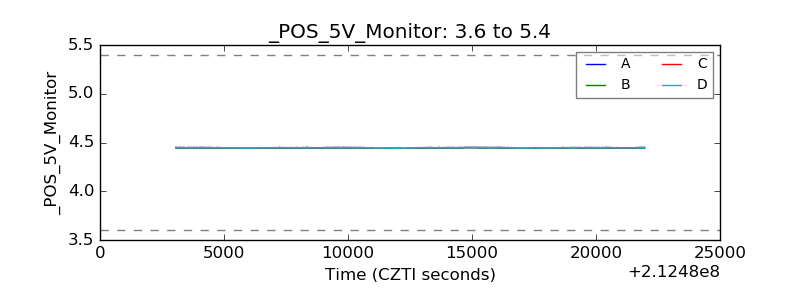 |
| _ROLL_ROT | 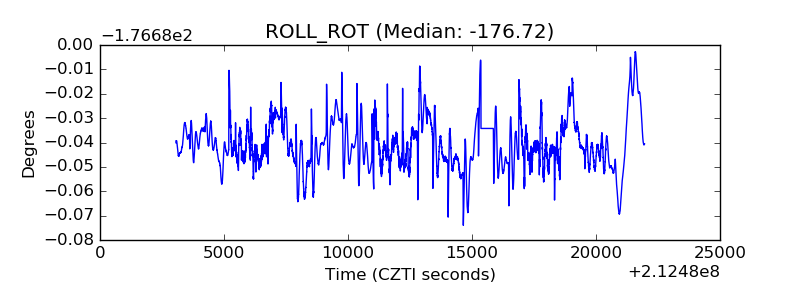 |
| _Roll_DEC | 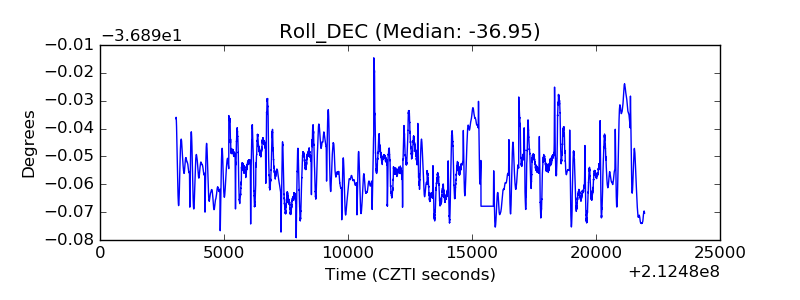 |
| _Roll_RA | 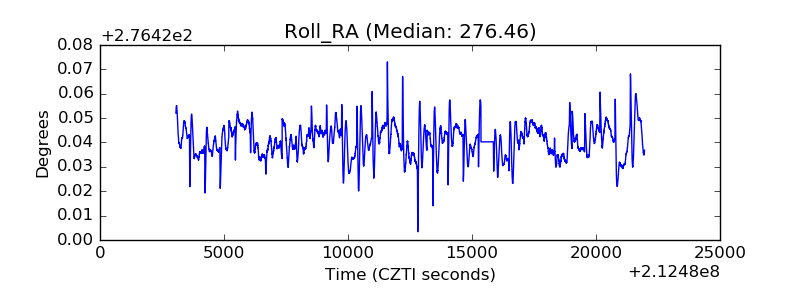 |
| Veto Counter |  |