| Param | Original file | Final file |
|---|---|---|
| Filename | modeM0/AS1G05_214T01_9000000684cztM0_level2.fits | modeM0/AS1G05_214T01_9000000684cztM0_level2_quad_clean.evt |
| Size (bytes) | 1,597,314,240 | 1,420,329,600 |
| Size | 1.5 GB | 1.3 GB |
| Events in quadrant A | 9,708,972 | 8,280,278 |
| Events in quadrant B | 9,438,786 | 8,305,941 |
| Events in quadrant C | 9,631,532 | 8,088,658 |
| Events in quadrant D | 7,556,862 | 6,314,181 |
| Mode M9 | |||
|---|---|---|---|
| Quadrant | BADHDUFLAG | Total packets | Discarded packets |
| A | 0 | 273 | 0 |
| B | 0 | 273 | 0 |
| C | 0 | 273 | 0 |
| D | 0 | 273 | 0 |
| Mode SS | |||
|---|---|---|---|
| Quadrant | BADHDUFLAG | Total packets | Discarded packets |
| A | 0 | 3574 | 0 |
| B | 0 | 3572 | 0 |
| C | 0 | 3574 | 0 |
| D | 0 | 3574 | 0 |
| Mode M0 | |||
|---|---|---|---|
| Quadrant | BADHDUFLAG | Total packets | Discarded packets |
| A | 0 | 368805 | 0 |
| B | 0 | 375784 | 0 |
| C | 0 | 378803 | 0 |
| D | 0 | 740043 | 0 |
| Quadrant | Total seconds | Saturated seconds | Saturation percentage |
|---|---|---|---|
| A | 175515 | 2811 | 1.601573% |
| B | 175493 | 3152 | 1.796083% |
| C | 175473 | 2021 | 1.151744% |
| D | 175482 | 30498 | 17.379560% |
Noise dominated data is calculated using 1-second bins in cleaned event files. If a bin has >2000 counts, and if more than 50% of those come from <1% of pixels, then it is considered to be noise-dominated and hence unusable.
| Quadrant | # 1 sec bins | Bins with >0 counts | Bins with >2000 counts | High rate bins dominated by noise | Noise dominated (total time) | Noise dominated (detector-on time) | Marked lightcurve |
|---|---|---|---|---|---|---|---|
| A | 203397 | 175563 | 0 | 0 | 0.00% | 0.00% |  |
| B | 203397 | 175548 | 0 | 0 | 0.00% | 0.00% |  |
| C | 203397 | 175534 | 0 | 0 | 0.00% | 0.00% |  |
| D | 203397 | 175465 | 0 | 0 | 0.00% | 0.00% | 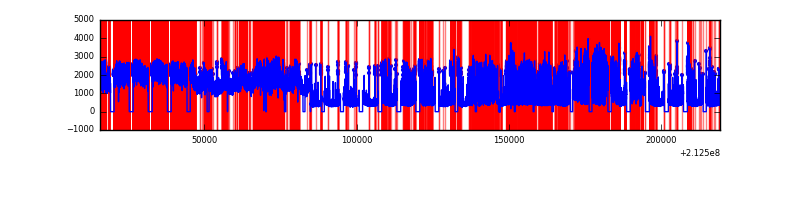 |
Top three noisy pixels from each quadrant. If the there are fewer than three noisy pixels in the level2.evt file, extra rows are filled as -1
| Pixel properties | Quadrant properties | ||||||
|---|---|---|---|---|---|---|---|
| Quadrant | DetID | PixID | Counts | Sigma | Mean | Median | Sigma |
| A | 14 | 188 | 9682 | 11.4 | 2519 | 2342 | 643.8 |
| A | 0 | 29 | 9649 | 11.35 | 2519 | 2342 | 643.8 |
| A | 14 | 204 | 8343 | 9.32 | 2519 | 2342 | 643.8 |
| B | 2 | 9 | 8184 | 11.76 | 2487 | 2355 | 495.6 |
| B | 12 | 226 | 6668 | 8.7 | 2487 | 2355 | 495.6 |
| B | 5 | 128 | 6513 | 8.39 | 2487 | 2355 | 495.6 |
| C | 1 | 80 | 7256 | 7.19 | 2541 | 2334 | 684.5 |
| C | 1 | 81 | 7077 | 6.93 | 2541 | 2334 | 684.5 |
| C | 12 | 241 | 6775 | 6.49 | 2541 | 2334 | 684.5 |
| D | 11 | 82 | 5722 | 6.5 | 2154 | 1951 | 580.0 |
| D | 3 | 14 | 5720 | 6.5 | 2154 | 1951 | 580.0 |
| D | 6 | 231 | 5504 | 6.13 | 2154 | 1951 | 580.0 |
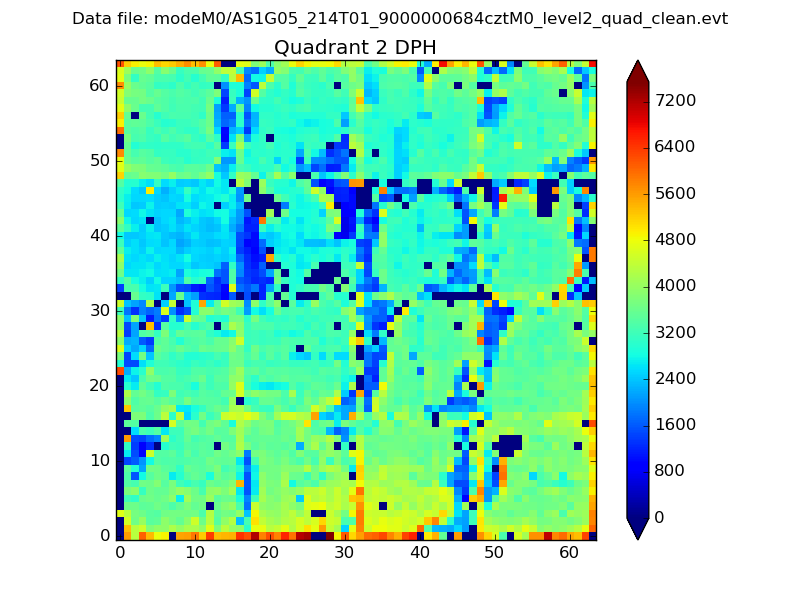
Histogram calculated using DETX and DETY for each event in the final _common_clean file
| Quadrant A | 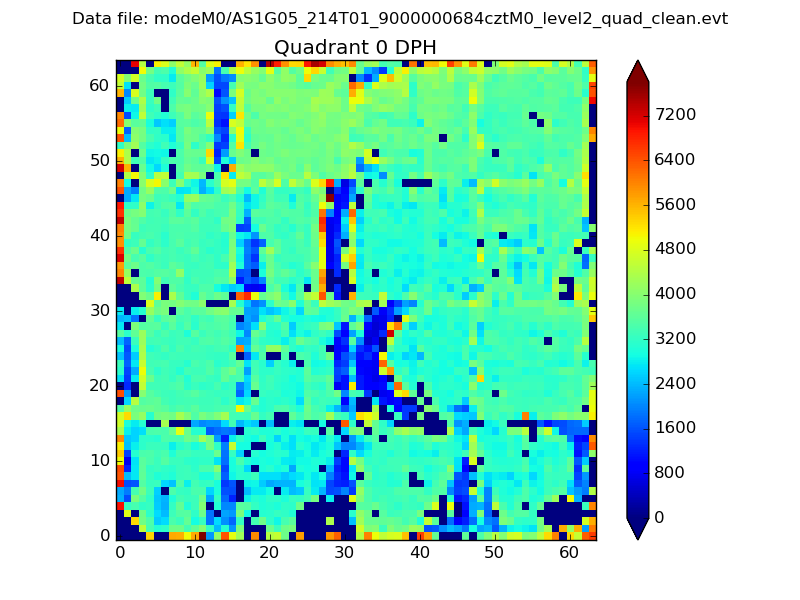 |
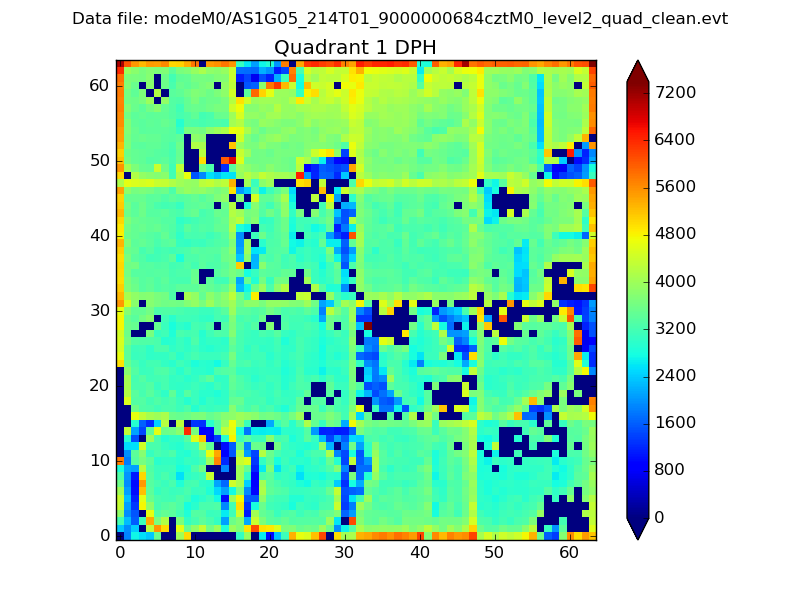 |
Quadrant B |
|---|---|---|---|
| Quadrant D | 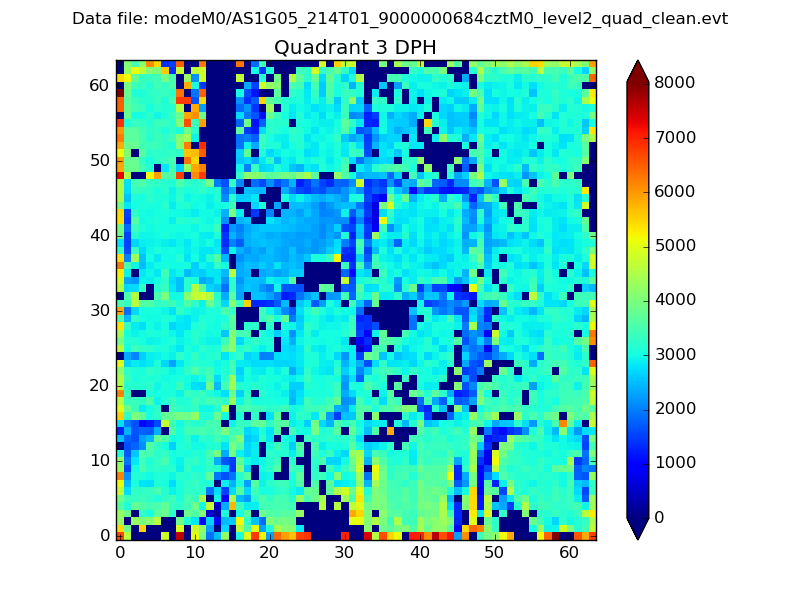 |
 |
Quadrant C |
| Plot type | Count rate plots | Images |
|---|---|---|
| Comparison with Poisson distribution Blue bars denote a histogram of data divided into 1 sec bins. Red curve is a Poisson curve with rate = median count rate of data. |
 |
 |
| Quadrant-wise count rates Data is divided into 100 sec bins |
 |
|
| Module-wise count rates for Quadrant A Data is divided into 100 sec bins |
 |
 |
| Module-wise count rates for Quadrant B Data is divided into 100 sec bins |
 |
 |
| Module-wise count rates for Quadrant C Data is divided into 100 sec bins |
 |
 |
| Module-wise count rates for Quadrant D Data is divided into 100 sec bins |
 |
 |
| Parameter | Plot |
|---|---|
| CZT HV Monitor |  |
| D_VDD |  |
| Temperature 1 |  |
| Veto HV Monitor |  |
| Veto LLD |  |
| Alpha Counter |  |
| _CPM_Rate |  |
| CZT Counter | 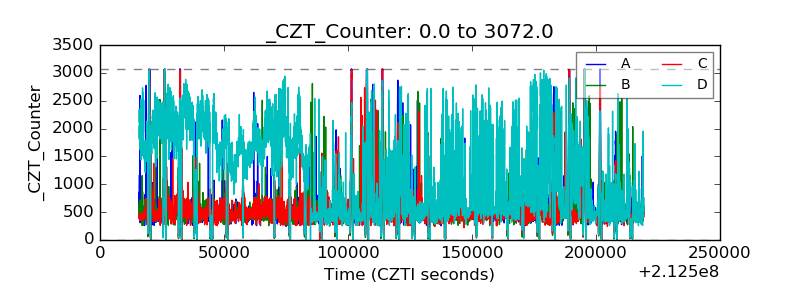 |
| +2.5 Volts monitor |  |
| +5 Volts monitor |  |
| _ROLL_ROT | 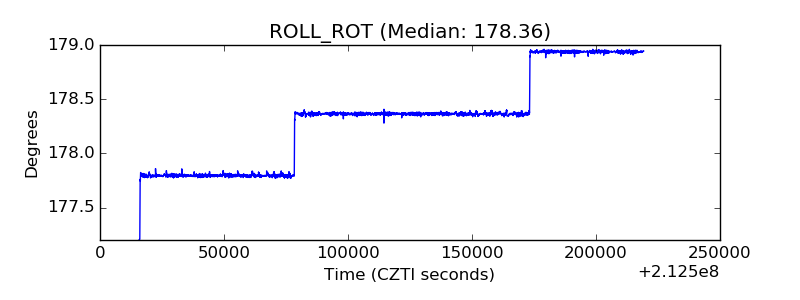 |
| _Roll_DEC | 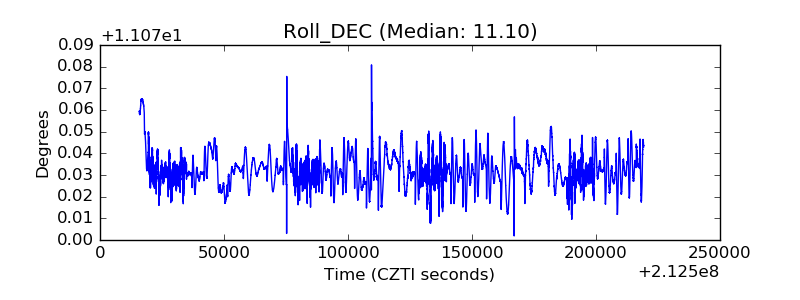 |
| _Roll_RA |  |
| Veto Counter |  |