| Param | Original file | Final file |
|---|---|---|
| Filename | modeM0/AS1G05_214T01_9000000684_05383cztM0_level2.evt | modeM0/AS1G05_214T01_9000000684_05383cztM0_level2_quad_clean.evt |
| Size (bytes) | 739,491,840 | 66,928,320 |
| Size | 705.2 MB | 63.8 MB |
| Events in quadrant A | 2,851,432 | 431,296 |
| Events in quadrant B | 3,019,485 | 438,645 |
| Events in quadrant C | 3,167,172 | 430,047 |
| Events in quadrant D | 12,961,098 | 315,439 |
| Mode M9 | |||
|---|---|---|---|
| Quadrant | BADHDUFLAG | Total packets | Discarded packets |
| A | 0 | 13 | 0 |
| B | 0 | 13 | 0 |
| C | 0 | 13 | 0 |
| D | 0 | 13 | 0 |
| Mode SS | |||
|---|---|---|---|
| Quadrant | BADHDUFLAG | Total packets | Discarded packets |
| A | 0 | 120 | 0 |
| B | 0 | 120 | 0 |
| C | 0 | 120 | 0 |
| D | 0 | 120 | 0 |
| Mode M0 | |||
|---|---|---|---|
| Quadrant | BADHDUFLAG | Total packets | Discarded packets |
| A | 0 | 12323 | 2 |
| B | 0 | 12689 | 1 |
| C | 0 | 13263 | 1 |
| D | 0 | 42493 | 1 |
| Quadrant | Total seconds | Saturated seconds | Saturation percentage |
|---|---|---|---|
| A | 5865 | 44 | 0.750213% |
| B | 5865 | 50 | 0.852515% |
| C | 5865 | 26 | 0.443308% |
| D | 5865 | 3506 | 59.778346% |
Noise dominated data is calculated using 1-second bins in cleaned event files. If a bin has >2000 counts, and if more than 50% of those come from <1% of pixels, then it is considered to be noise-dominated and hence unusable.
| Quadrant | # 1 sec bins | Bins with >0 counts | Bins with >2000 counts | High rate bins dominated by noise | Noise dominated (total time) | Noise dominated (detector-on time) | Marked lightcurve |
|---|---|---|---|---|---|---|---|
| A | 7169 | 5864 | 14 | 14 | 0.20% | 0.24% | 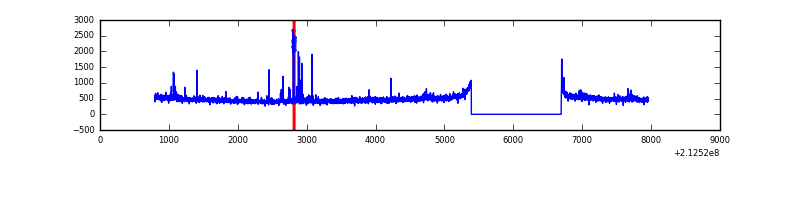 |
| B | 7169 | 5864 | 10 | 10 | 0.14% | 0.17% | 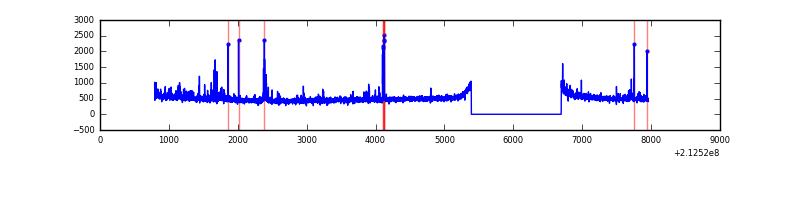 |
| C | 7169 | 5864 | 0 | 0 | 0.00% | 0.00% |  |
| D | 7169 | 5864 | 4802 | 4802 | 66.98% | 81.89% | 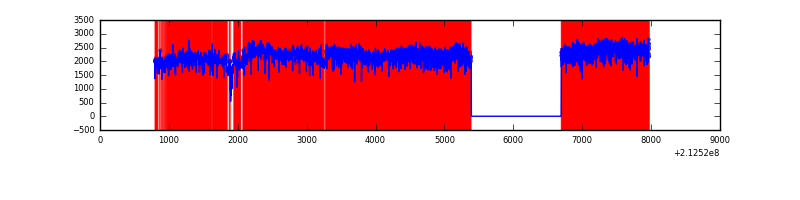 |
Top three noisy pixels from each quadrant. If the there are fewer than three noisy pixels in the level2.evt file, extra rows are filled as -1
| Pixel properties | Quadrant properties | ||||||
|---|---|---|---|---|---|---|---|
| Quadrant | DetID | PixID | Counts | Sigma | Mean | Median | Sigma |
| A | 15 | 174 | 76613 | 529.58 | 708 | 695 | 143.4 |
| A | 0 | 50 | 27320 | 185.73 | 708 | 695 | 143.4 |
| A | 8 | 176 | 12347 | 81.28 | 708 | 695 | 143.4 |
| B | 4 | 48 | 42064 | 303.35 | 723 | 707 | 136.3 |
| B | 4 | 80 | 38857 | 279.82 | 723 | 707 | 136.3 |
| B | 15 | 204 | 29893 | 214.07 | 723 | 707 | 136.3 |
| C | 1 | 16 | 452392 | 2830.61 | 692 | 697 | 159.6 |
| C | 12 | 4 | 8270 | 47.46 | 692 | 697 | 159.6 |
| C | 13 | 61 | 5633 | 30.93 | 692 | 697 | 159.6 |
| D | 7 | 237 | 9771770 | 66393.08 | 595 | 578 | 147.2 |
| D | 2 | 63 | 407394 | 2764.22 | 595 | 578 | 147.2 |
| D | 1 | 239 | 317098 | 2150.68 | 595 | 578 | 147.2 |
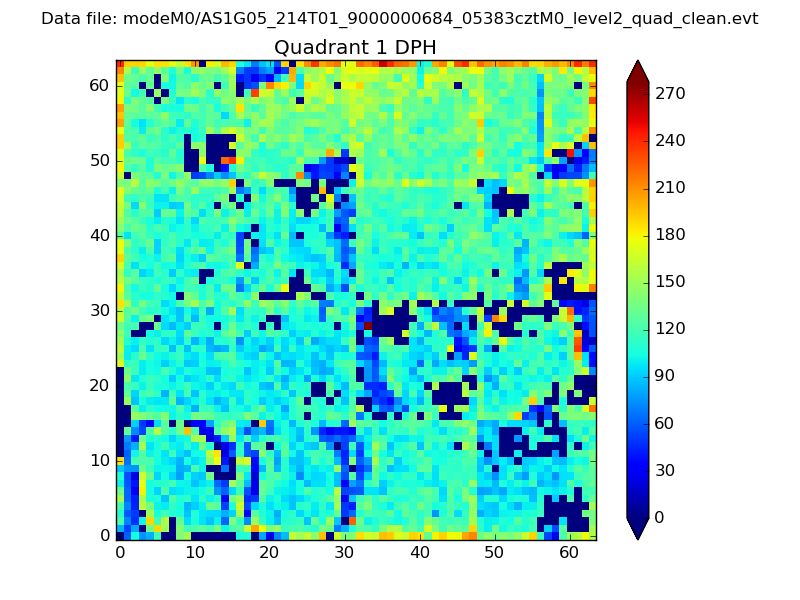
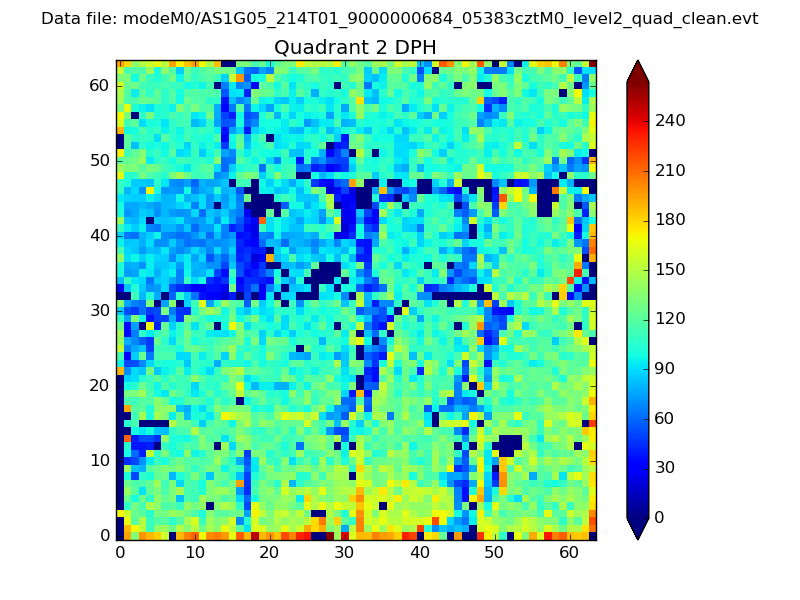
Histogram calculated using DETX and DETY for each event in the final _common_clean file
| Quadrant A | 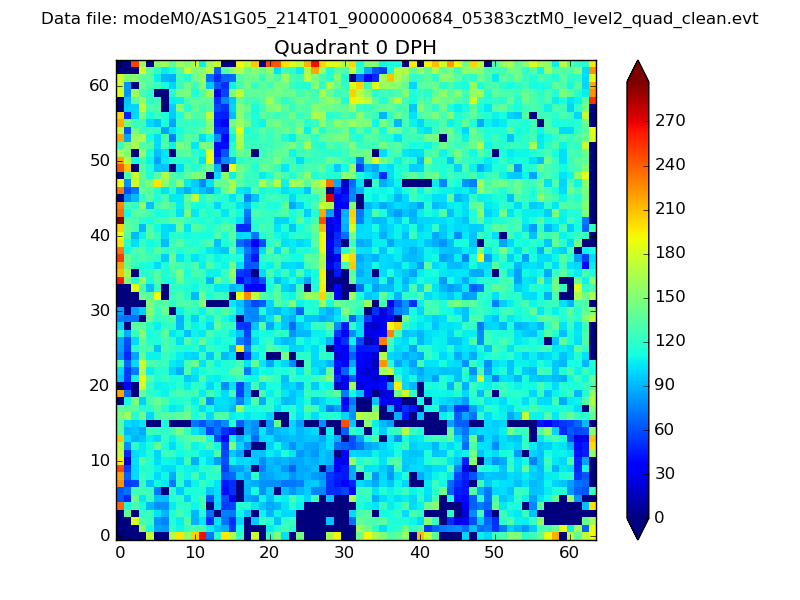 |
 |
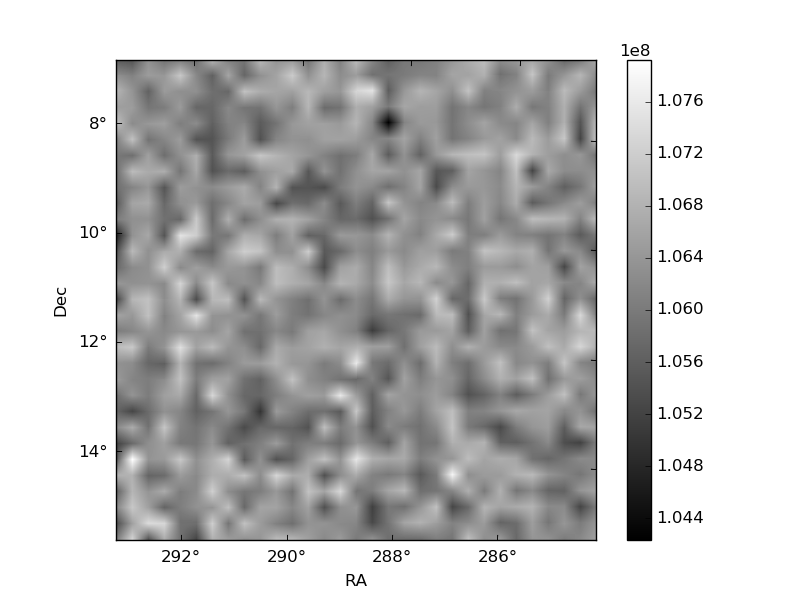
Quadrant B |
|---|---|---|---|
| Quadrant D |  |
 |
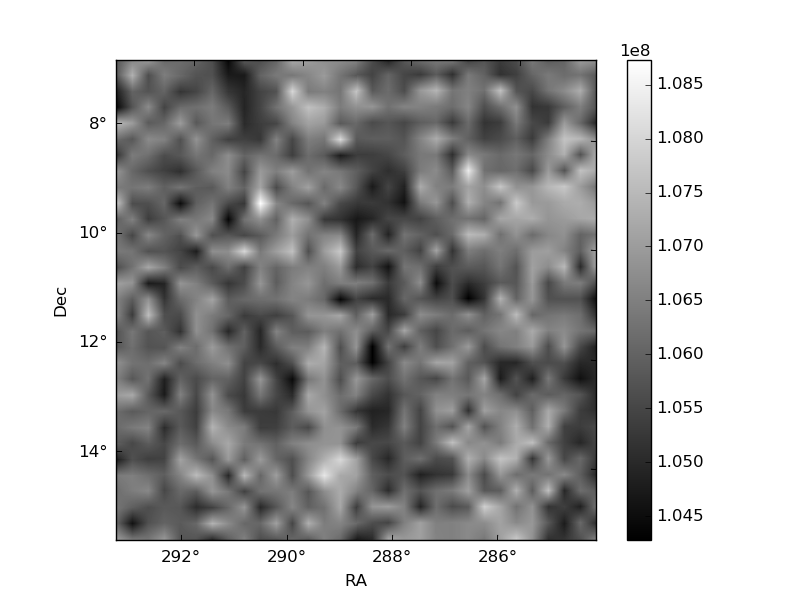
Quadrant C |
| Plot type | Count rate plots | Images |
|---|---|---|
| Comparison with Poisson distribution Blue bars denote a histogram of data divided into 1 sec bins. Red curve is a Poisson curve with rate = median count rate of data. |
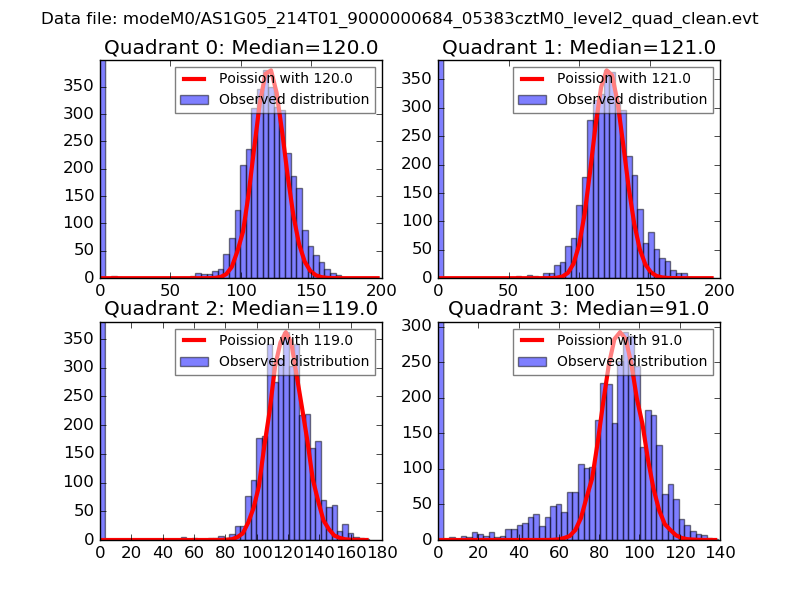 |
 |
| Quadrant-wise count rates Data is divided into 100 sec bins |
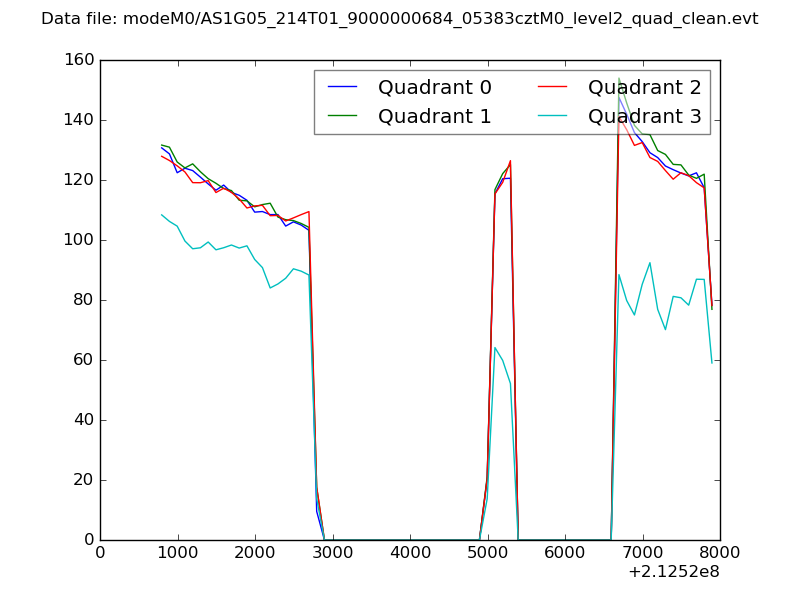 |
|
| Module-wise count rates for Quadrant A Data is divided into 100 sec bins |
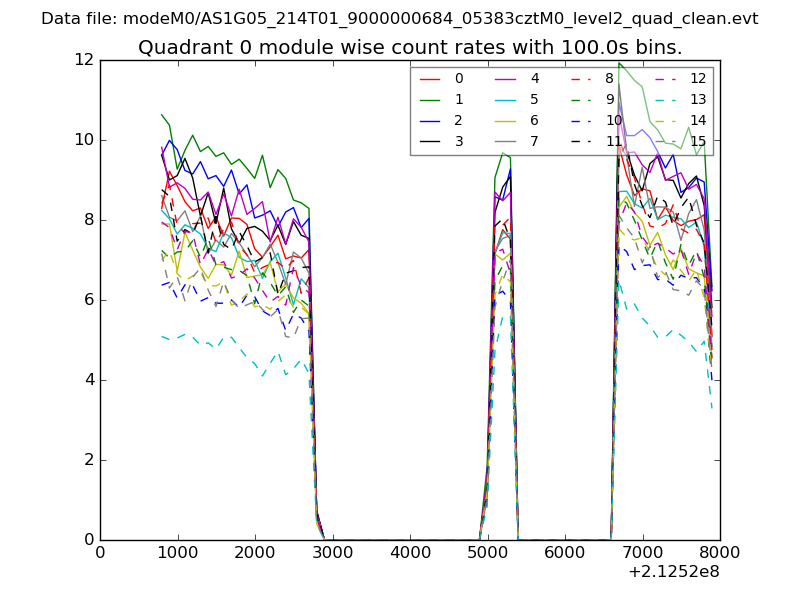 |
 |
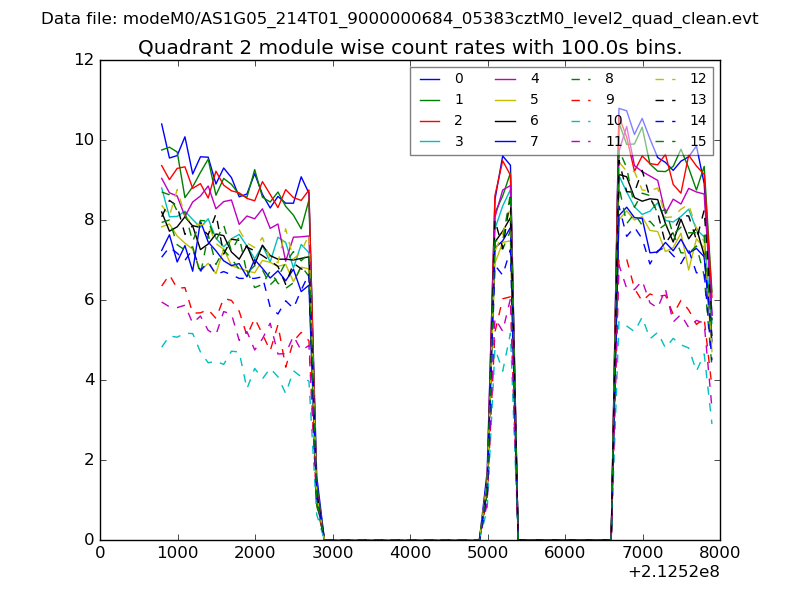
| Module-wise count rates for Quadrant B Data is divided into 100 sec bins |
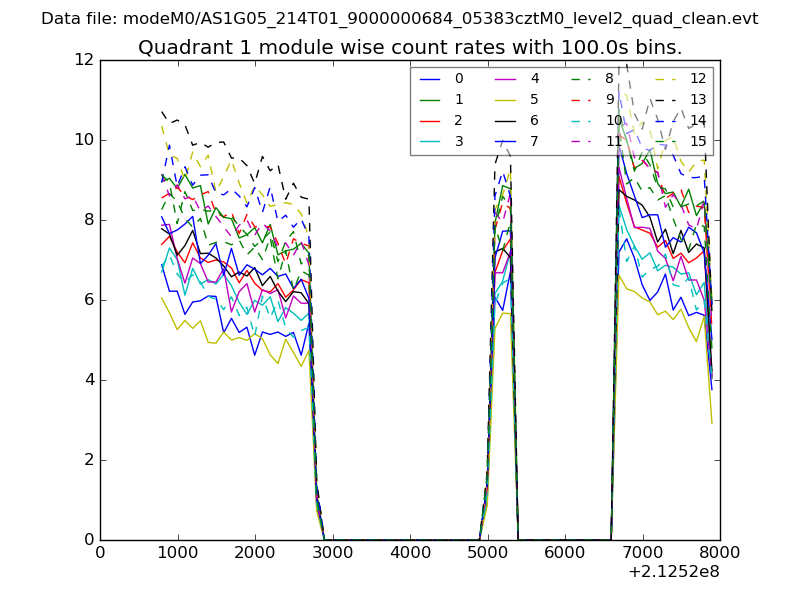 |
 |
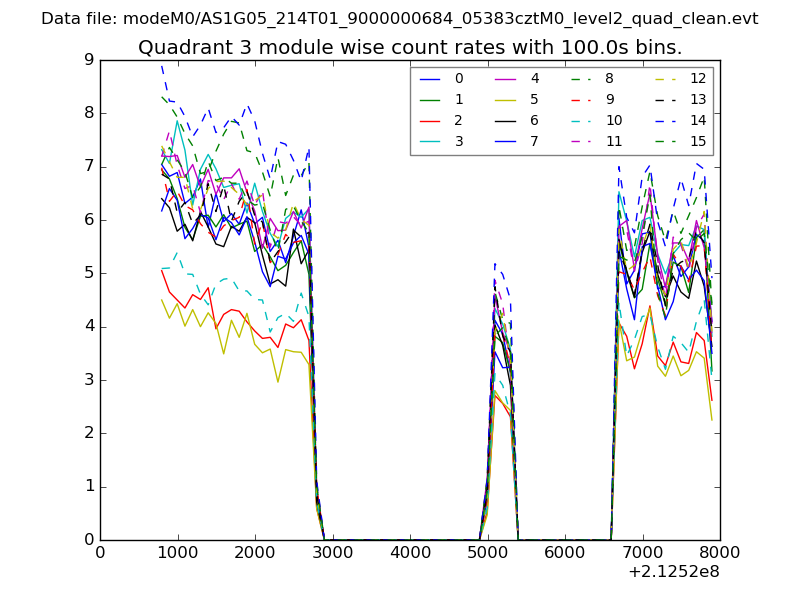
| Module-wise count rates for Quadrant C Data is divided into 100 sec bins |
 |
 |
| Module-wise count rates for Quadrant D Data is divided into 100 sec bins |
 |
 |
| Parameter | Plot |
|---|---|
| CZT HV Monitor | 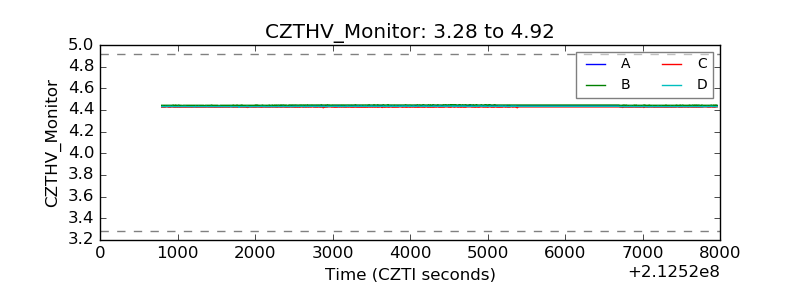 |
| D_VDD | 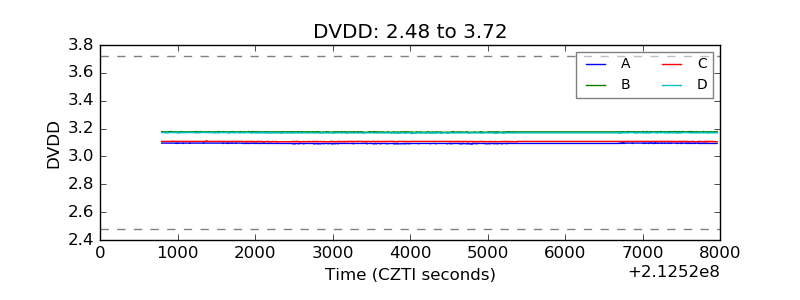 |
| Temperature 1 | 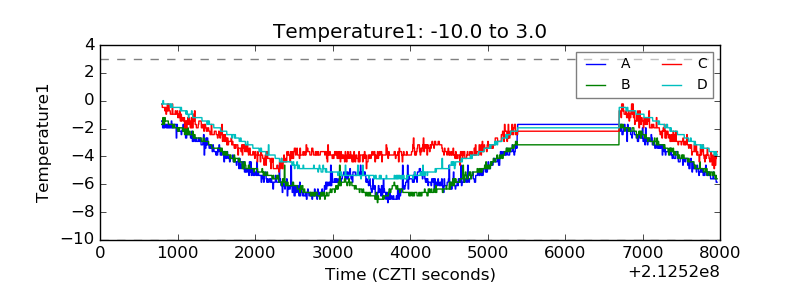 |
| Veto HV Monitor | 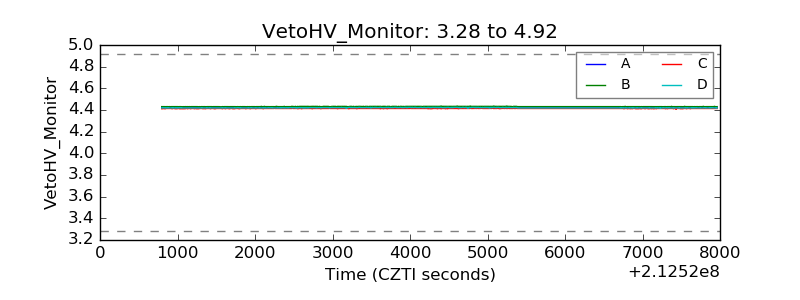 |
| Veto LLD | 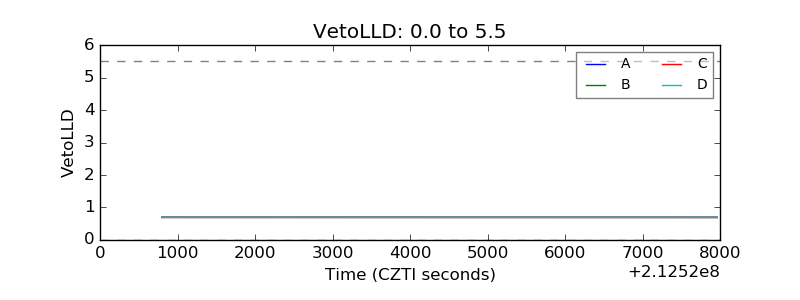 |
| Alpha Counter | 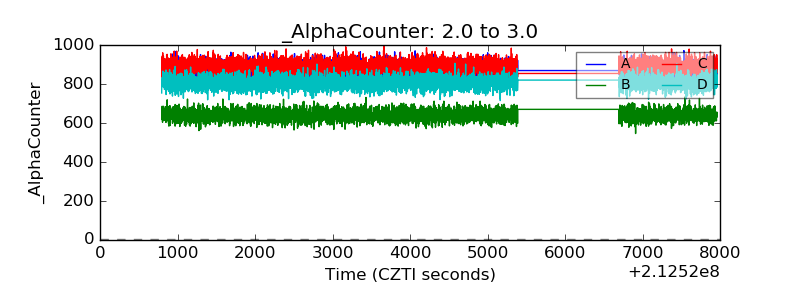 |
| _CPM_Rate | 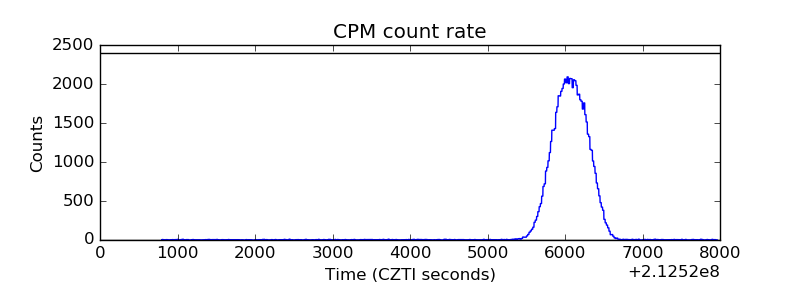 |
| CZT Counter | 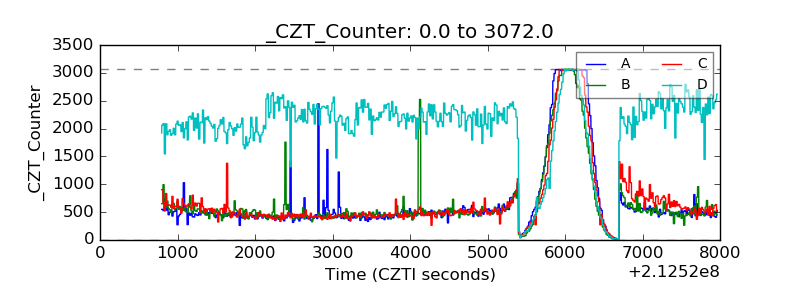 |
| +2.5 Volts monitor |  |
| +5 Volts monitor |  |
| _ROLL_ROT | 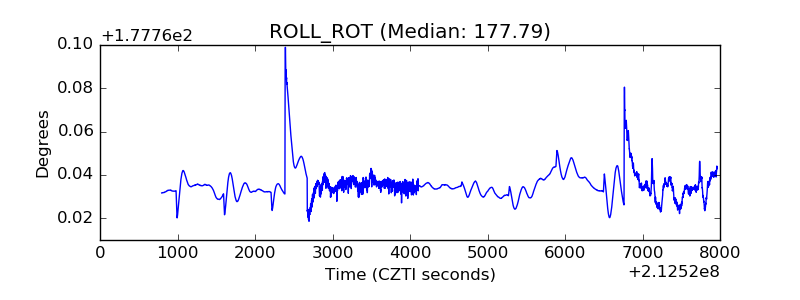 |
| _Roll_DEC | 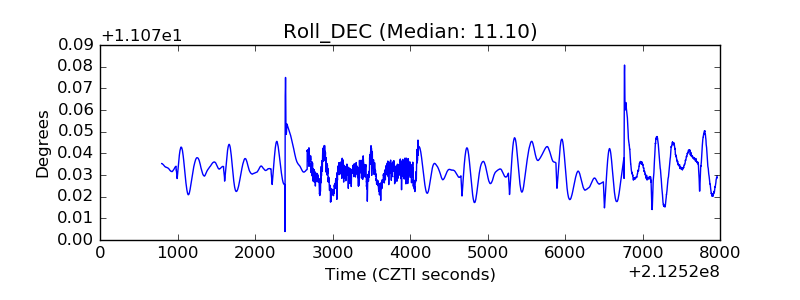 |
| _Roll_RA | 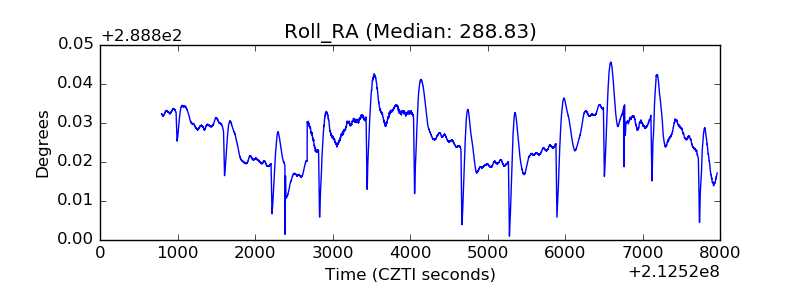 |
| Veto Counter | 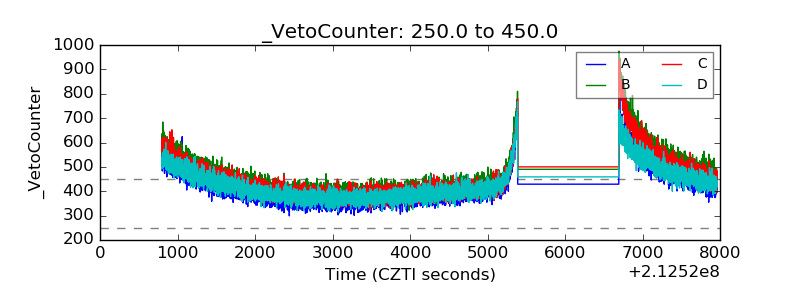 |