| Param | Original file | Final file |
|---|---|---|
| Filename | modeM0/AS1G05_214T01_9000000684_05384cztM0_level2.evt | modeM0/AS1G05_214T01_9000000684_05384cztM0_level2_quad_clean.evt |
| Size (bytes) | 725,256,000 | 63,190,080 |
| Size | 691.7 MB | 60.3 MB |
| Events in quadrant A | 2,741,594 | 406,117 |
| Events in quadrant B | 2,836,516 | 415,563 |
| Events in quadrant C | 3,174,965 | 405,355 |
| Events in quadrant D | 12,827,531 | 287,837 |
| Mode M9 | |||
|---|---|---|---|
| Quadrant | BADHDUFLAG | Total packets | Discarded packets |
| A | 0 | 13 | 0 |
| B | 0 | 13 | 0 |
| C | 0 | 13 | 0 |
| D | 0 | 13 | 0 |
| Mode SS | |||
|---|---|---|---|
| Quadrant | BADHDUFLAG | Total packets | Discarded packets |
| A | 0 | 116 | 0 |
| B | 0 | 116 | 0 |
| C | 0 | 116 | 0 |
| D | 0 | 116 | 0 |
| Mode M0 | |||
|---|---|---|---|
| Quadrant | BADHDUFLAG | Total packets | Discarded packets |
| A | 0 | 11871 | 2 |
| B | 0 | 12046 | 1 |
| C | 0 | 12850 | 1 |
| D | 0 | 41940 | 1 |
| Quadrant | Total seconds | Saturated seconds | Saturation percentage |
|---|---|---|---|
| A | 5674 | 50 | 0.881213% |
| B | 5674 | 57 | 1.004582% |
| C | 5674 | 40 | 0.704970% |
| D | 5674 | 3831 | 67.518505% |
Noise dominated data is calculated using 1-second bins in cleaned event files. If a bin has >2000 counts, and if more than 50% of those come from <1% of pixels, then it is considered to be noise-dominated and hence unusable.
| Quadrant | # 1 sec bins | Bins with >0 counts | Bins with >2000 counts | High rate bins dominated by noise | Noise dominated (total time) | Noise dominated (detector-on time) | Marked lightcurve |
|---|---|---|---|---|---|---|---|
| A | 7008 | 5673 | 10 | 10 | 0.14% | 0.18% | 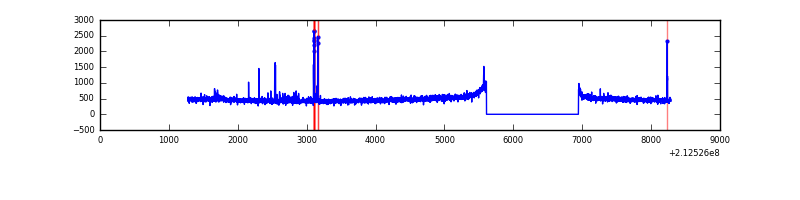 |
| B | 7009 | 5674 | 4 | 4 | 0.06% | 0.07% | 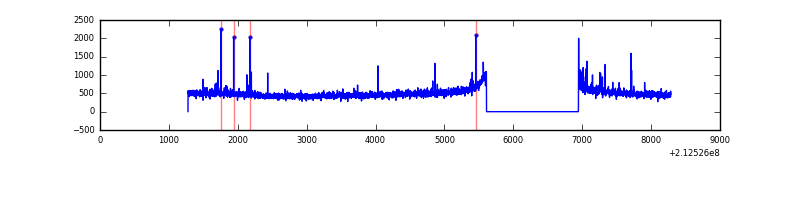 |
| C | 7009 | 5674 | 1 | 1 | 0.01% | 0.02% |  |
| D | 7009 | 5674 | 4900 | 4900 | 69.91% | 86.36% | 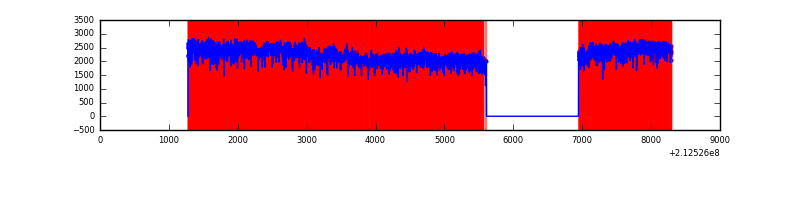 |
Top three noisy pixels from each quadrant. If the there are fewer than three noisy pixels in the level2.evt file, extra rows are filled as -1
| Pixel properties | Quadrant properties | ||||||
|---|---|---|---|---|---|---|---|
| Quadrant | DetID | PixID | Counts | Sigma | Mean | Median | Sigma |
| A | 15 | 174 | 47792 | 334.16 | 687 | 674 | 141.0 |
| A | 14 | 111 | 22039 | 151.52 | 687 | 674 | 141.0 |
| A | 0 | 50 | 14500 | 98.05 | 687 | 674 | 141.0 |
| B | 15 | 54 | 32083 | 234.06 | 702 | 686 | 134.1 |
| B | 15 | 204 | 28029 | 203.84 | 702 | 686 | 134.1 |
| B | 0 | 219 | 22355 | 161.54 | 702 | 686 | 134.1 |
| C | 1 | 16 | 536290 | 3401.33 | 673 | 677 | 157.5 |
| C | 12 | 4 | 11059 | 65.93 | 673 | 677 | 157.5 |
| C | 13 | 61 | 5531 | 30.82 | 673 | 677 | 157.5 |
| D | 7 | 237 | 9820692 | 68198.77 | 579 | 561 | 144.0 |
| D | 2 | 63 | 364921 | 2530.4 | 579 | 561 | 144.0 |
| D | 1 | 239 | 286137 | 1983.27 | 579 | 561 | 144.0 |
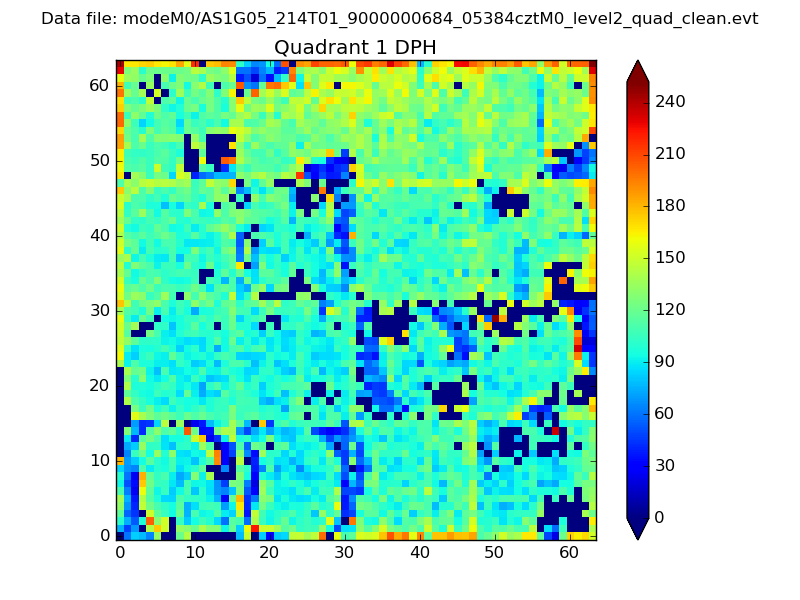
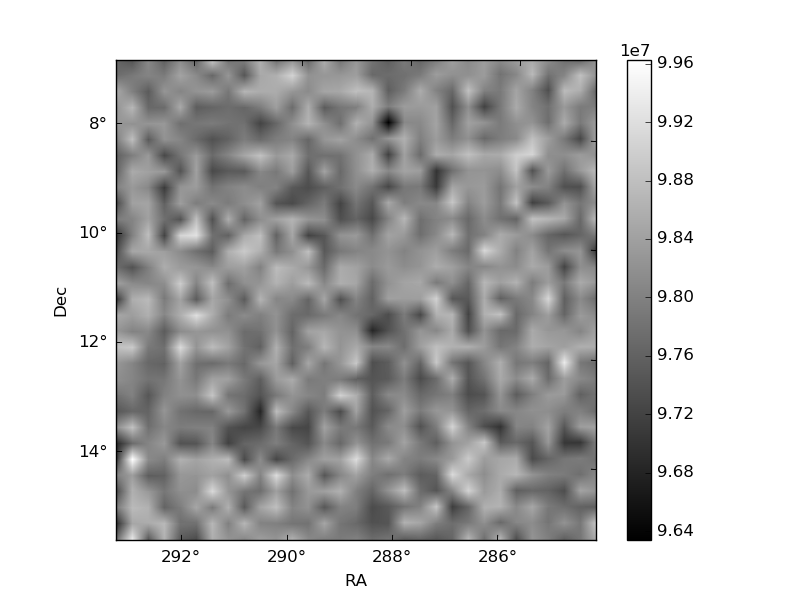
Histogram calculated using DETX and DETY for each event in the final _common_clean file
| Quadrant A | 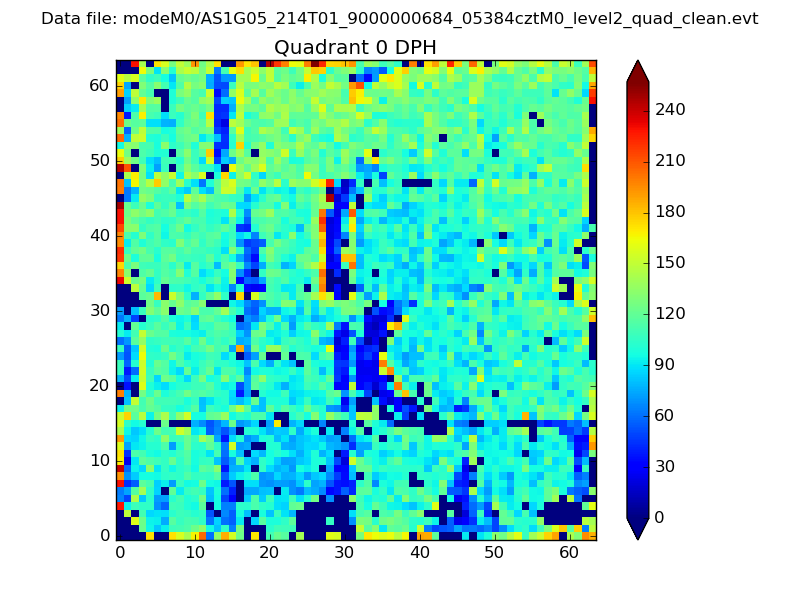 |
 |
Quadrant B |
|---|---|---|---|
| Quadrant D |  |
 |
Quadrant C |
| Plot type | Count rate plots | Images |
|---|---|---|
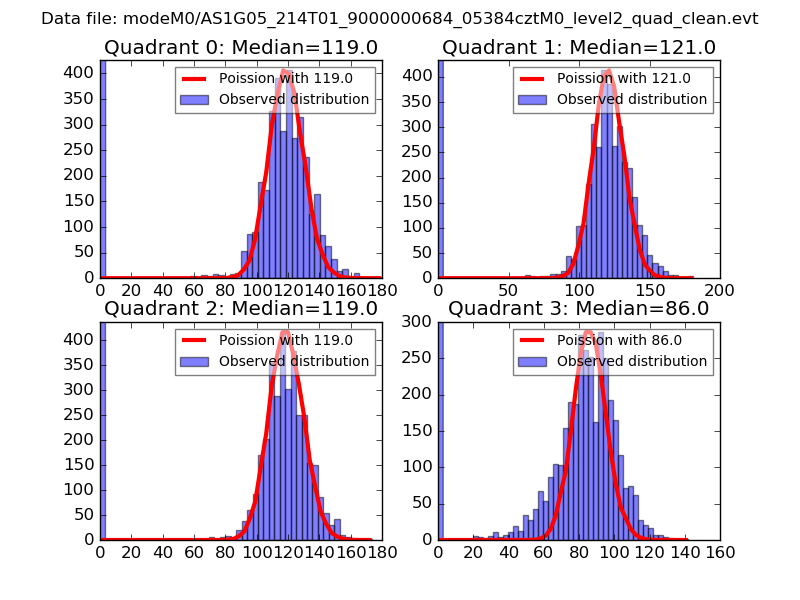
| Comparison with Poisson distribution Blue bars denote a histogram of data divided into 1 sec bins. Red curve is a Poisson curve with rate = median count rate of data. |
 |
 |
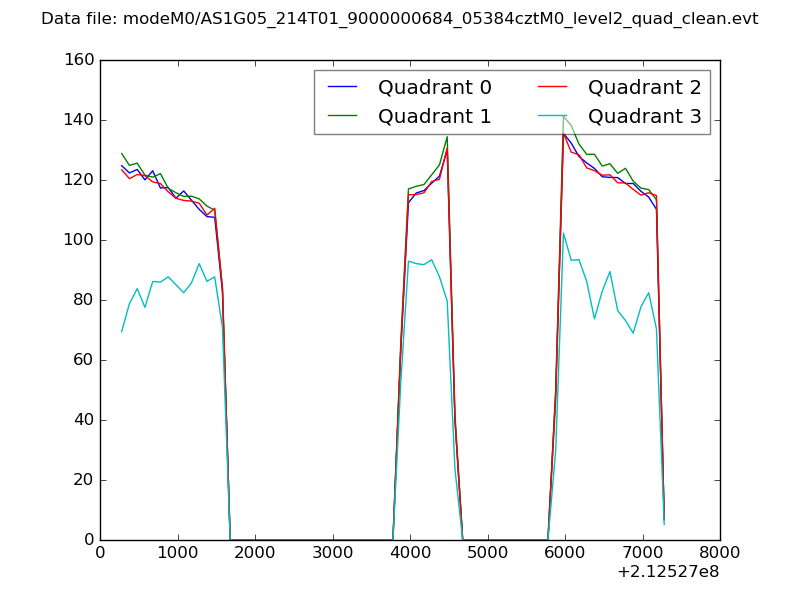
| Quadrant-wise count rates Data is divided into 100 sec bins |
 |
|
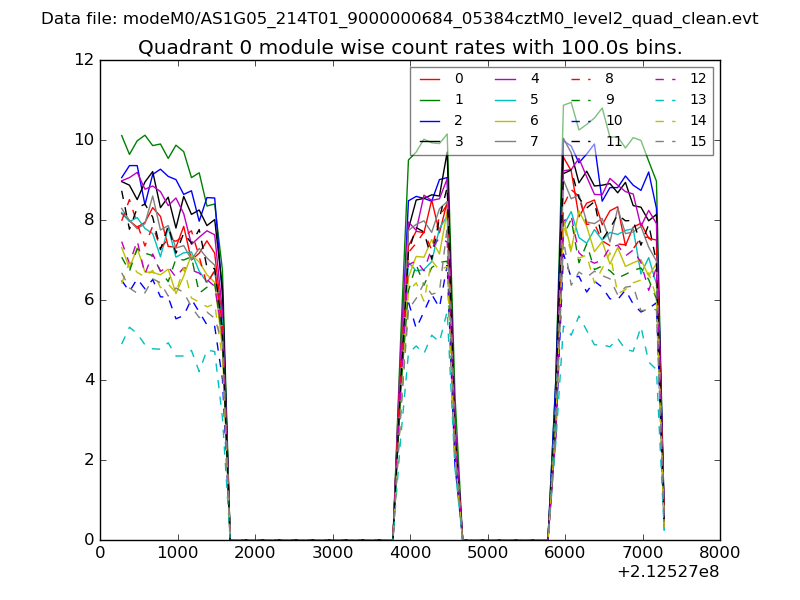
| Module-wise count rates for Quadrant A Data is divided into 100 sec bins |
 |
 |
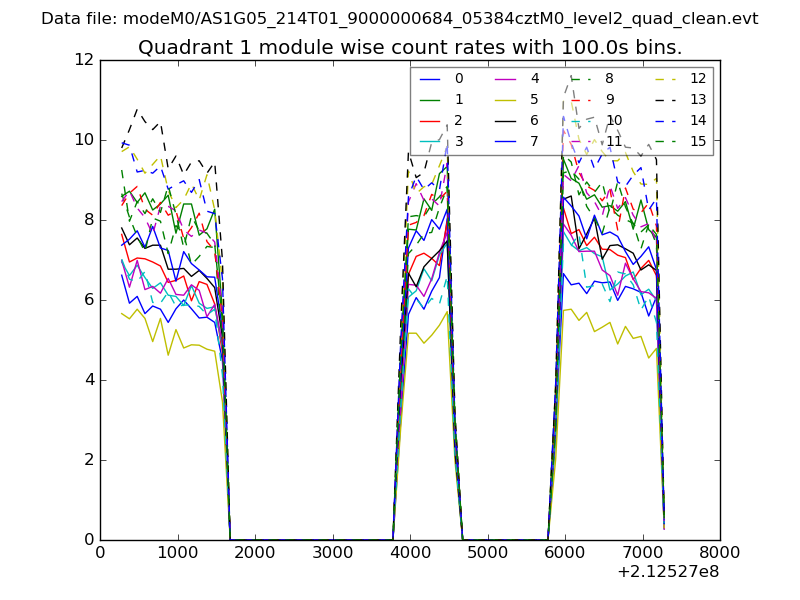
| Module-wise count rates for Quadrant B Data is divided into 100 sec bins |
 |
 |
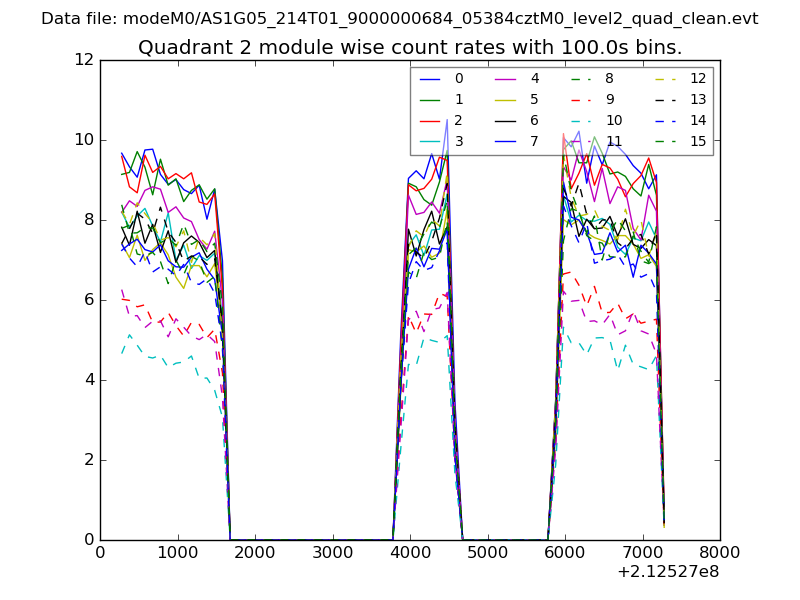
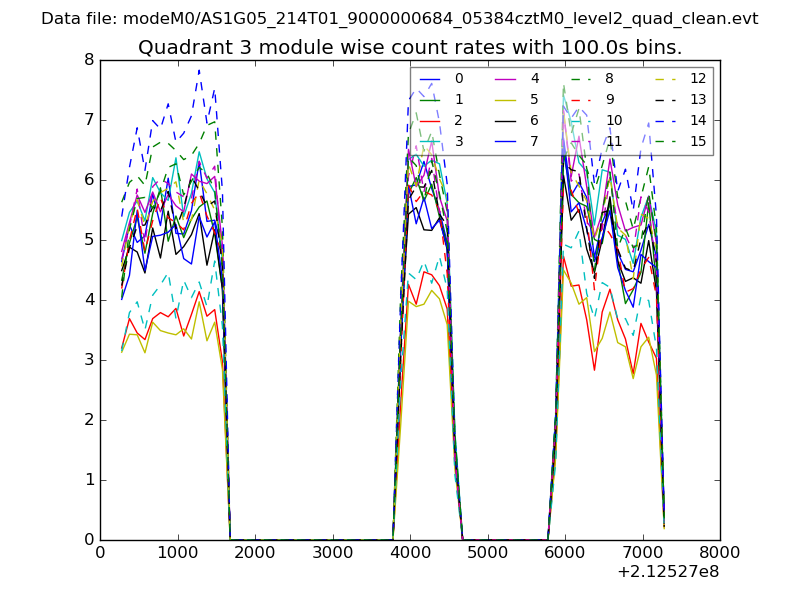
| Module-wise count rates for Quadrant C Data is divided into 100 sec bins |
 |
 |
| Module-wise count rates for Quadrant D Data is divided into 100 sec bins |
 |
 |
| Parameter | Plot |
|---|---|
| CZT HV Monitor | 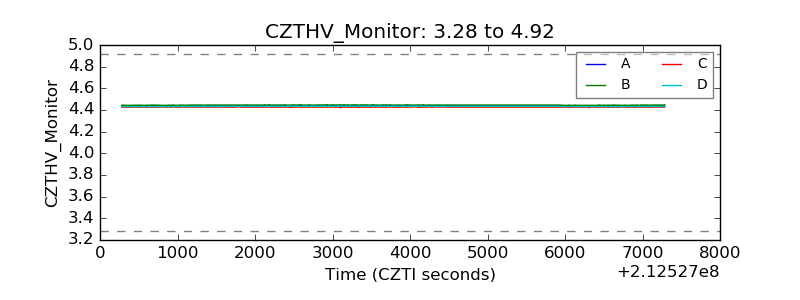 |
| D_VDD | 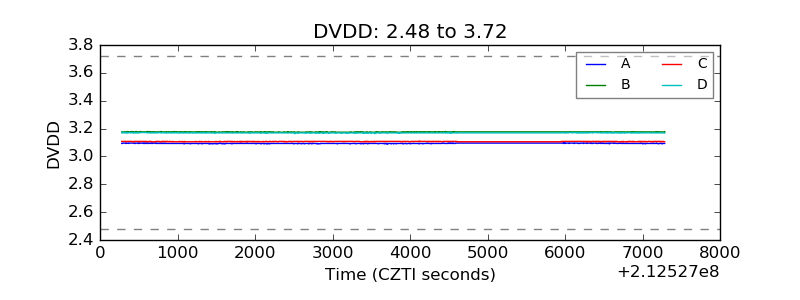 |
| Temperature 1 | 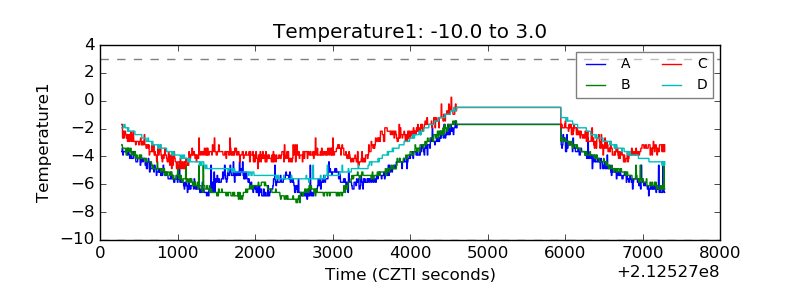 |
| Veto HV Monitor | 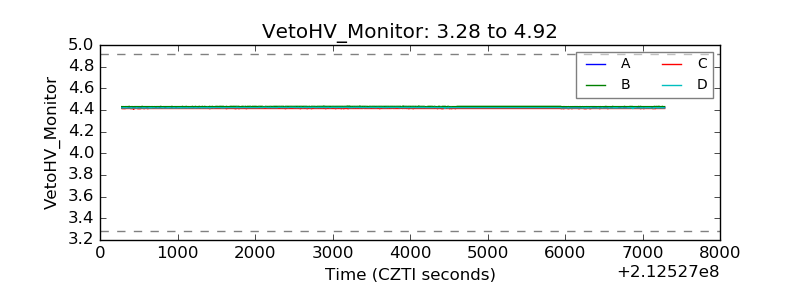 |
| Veto LLD | 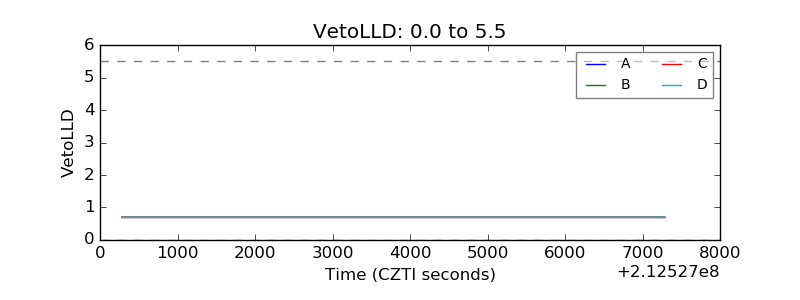 |
| Alpha Counter | 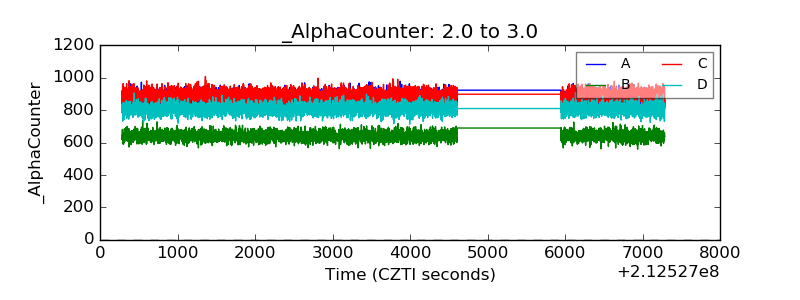 |
| _CPM_Rate | 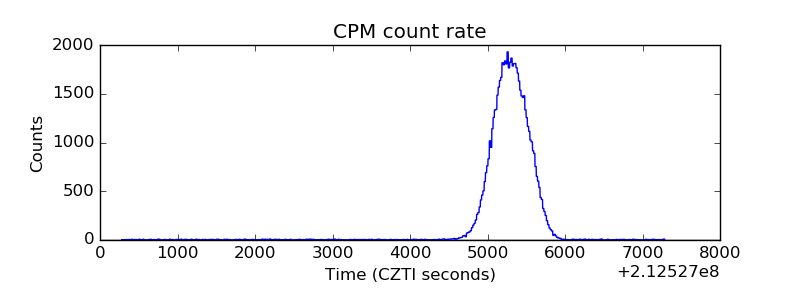 |
| CZT Counter |  |
| +2.5 Volts monitor |  |
| +5 Volts monitor |  |
| _ROLL_ROT | 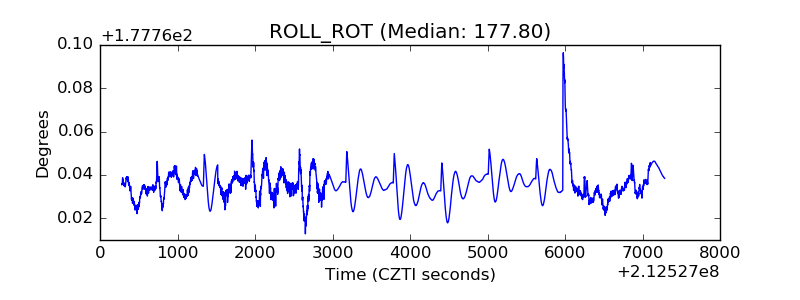 |
| _Roll_DEC | 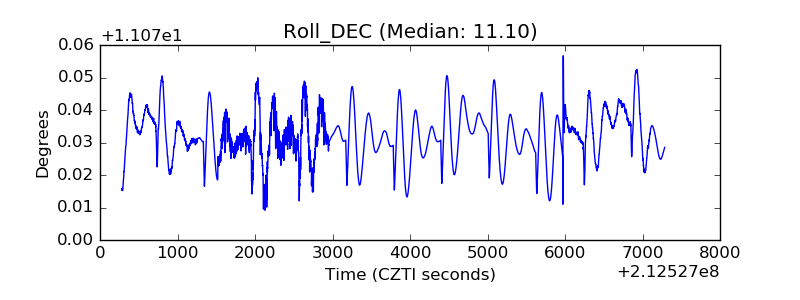 |
| _Roll_RA | 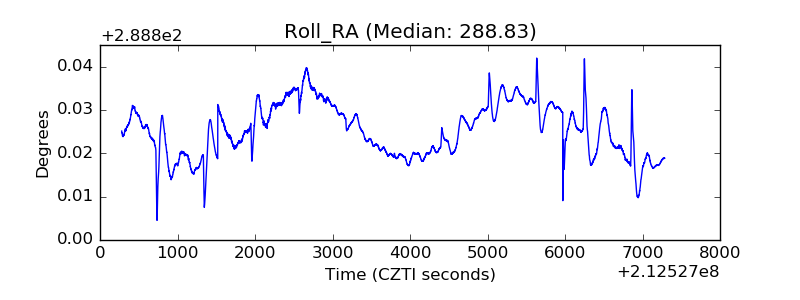 |
| Veto Counter | 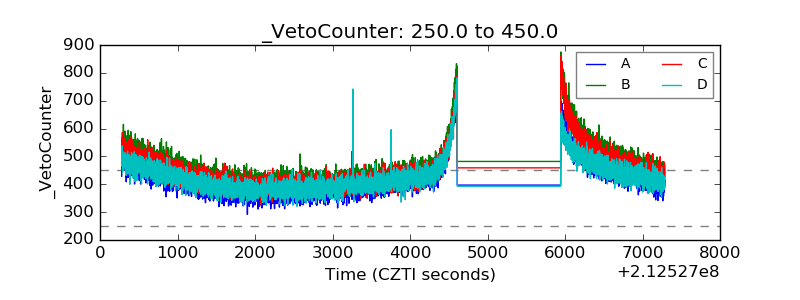 |