| Param | Original file | Final file |
|---|---|---|
| Filename | modeM0/AS1G05_214T01_9000000684_05385cztM0_level2.evt | modeM0/AS1G05_214T01_9000000684_05385cztM0_level2_quad_clean.evt |
| Size (bytes) | 800,902,080 | 70,698,240 |
| Size | 763.8 MB | 67.4 MB |
| Events in quadrant A | 2,966,286 | 453,502 |
| Events in quadrant B | 3,129,279 | 463,997 |
| Events in quadrant C | 3,443,545 | 453,032 |
| Events in quadrant D | 14,293,673 | 332,607 |
| Mode M9 | |||
|---|---|---|---|
| Quadrant | BADHDUFLAG | Total packets | Discarded packets |
| A | 0 | 17 | 0 |
| B | 0 | 17 | 0 |
| C | 0 | 17 | 0 |
| D | 0 | 18 | 0 |
| Mode SS | |||
|---|---|---|---|
| Quadrant | BADHDUFLAG | Total packets | Discarded packets |
| A | 0 | 126 | 0 |
| B | 0 | 126 | 0 |
| C | 0 | 126 | 0 |
| D | 0 | 126 | 0 |
| Mode M0 | |||
|---|---|---|---|
| Quadrant | BADHDUFLAG | Total packets | Discarded packets |
| A | 0 | 12996 | 3 |
| B | 0 | 13297 | 2 |
| C | 0 | 14021 | 2 |
| D | 0 | 46630 | 2 |
| Quadrant | Total seconds | Saturated seconds | Saturation percentage |
|---|---|---|---|
| A | 6252 | 28 | 0.447857% |
| B | 6252 | 43 | 0.687780% |
| C | 6252 | 28 | 0.447857% |
| D | 6252 | 4794 | 76.679463% |
Noise dominated data is calculated using 1-second bins in cleaned event files. If a bin has >2000 counts, and if more than 50% of those come from <1% of pixels, then it is considered to be noise-dominated and hence unusable.
| Quadrant | # 1 sec bins | Bins with >0 counts | Bins with >2000 counts | High rate bins dominated by noise | Noise dominated (total time) | Noise dominated (detector-on time) | Marked lightcurve |
|---|---|---|---|---|---|---|---|
| A | 7541 | 6251 | 1 | 1 | 0.01% | 0.02% |  |
| B | 7541 | 6252 | 2 | 2 | 0.03% | 0.03% |  |
| C | 7541 | 6252 | 1 | 1 | 0.01% | 0.02% | 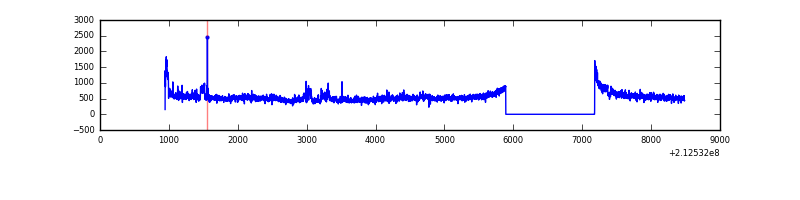 |
| D | 7541 | 6252 | 5540 | 5540 | 73.47% | 88.61% |  |
Top three noisy pixels from each quadrant. If the there are fewer than three noisy pixels in the level2.evt file, extra rows are filled as -1
| Pixel properties | Quadrant properties | ||||||
|---|---|---|---|---|---|---|---|
| Quadrant | DetID | PixID | Counts | Sigma | Mean | Median | Sigma |
| A | 14 | 111 | 21656 | 136.06 | 755 | 739 | 153.7 |
| A | 13 | 6 | 14414 | 88.95 | 755 | 739 | 153.7 |
| A | 15 | 174 | 11013 | 66.83 | 755 | 739 | 153.7 |
| B | 15 | 54 | 34284 | 228.31 | 773 | 757 | 146.8 |
| B | 4 | 81 | 27025 | 178.88 | 773 | 757 | 146.8 |
| B | 15 | 204 | 25478 | 168.34 | 773 | 757 | 146.8 |
| C | 1 | 16 | 537999 | 3120.09 | 738 | 745 | 172.2 |
| C | 12 | 4 | 11802 | 64.21 | 738 | 745 | 172.2 |
| C | 13 | 61 | 6007 | 30.56 | 738 | 745 | 172.2 |
| D | 7 | 237 | 10724763 | 70349.84 | 622 | 602 | 152.4 |
| D | 2 | 63 | 1061027 | 6956.32 | 622 | 602 | 152.4 |
| D | 2 | 136 | 53729 | 348.51 | 622 | 602 | 152.4 |
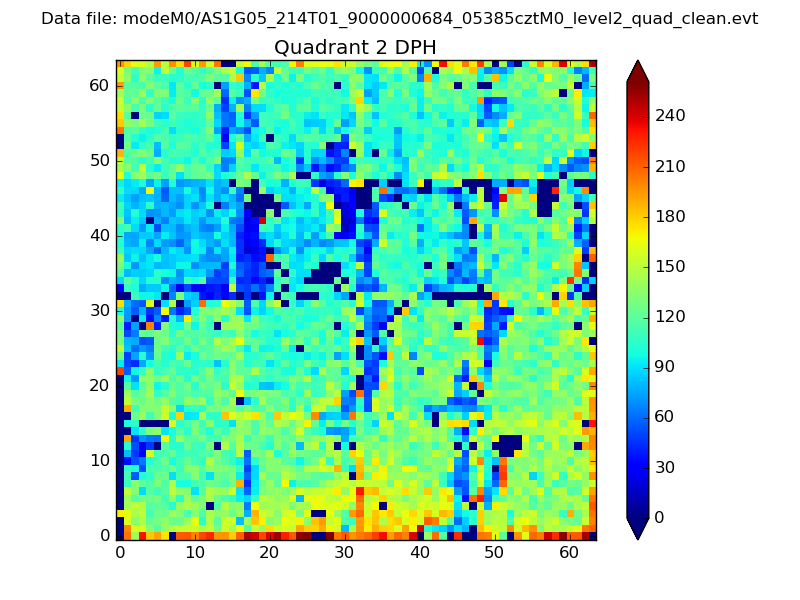
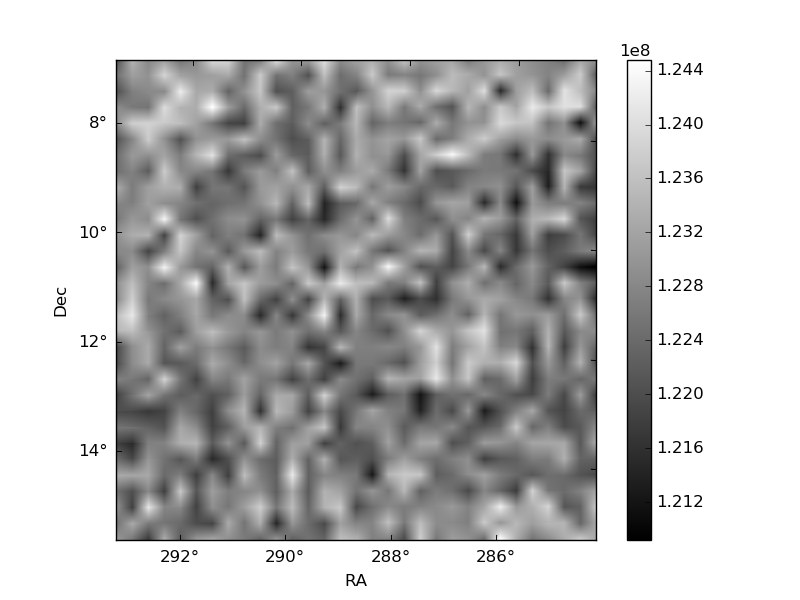
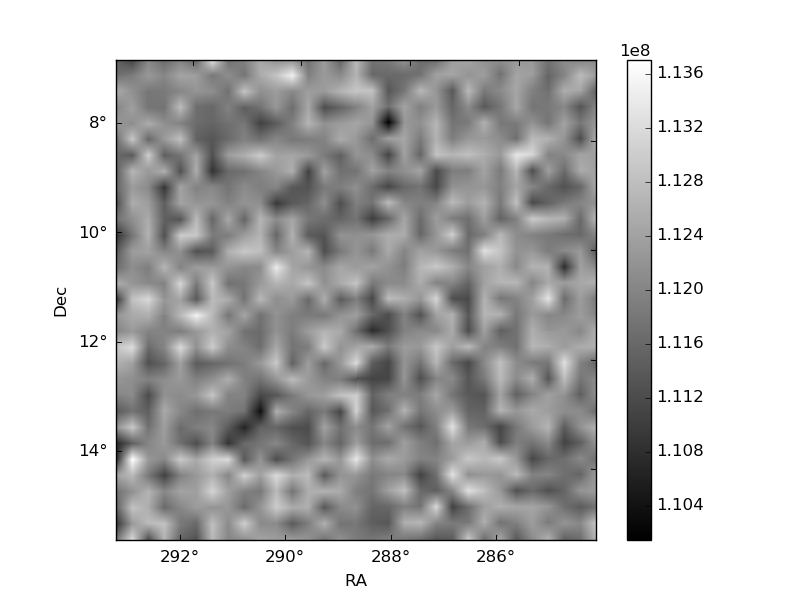
Histogram calculated using DETX and DETY for each event in the final _common_clean file
| Quadrant A | 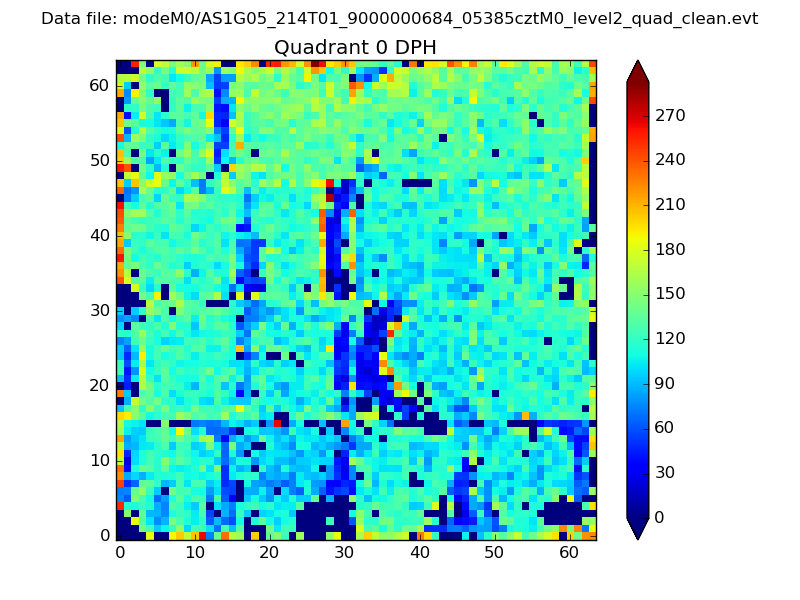 |
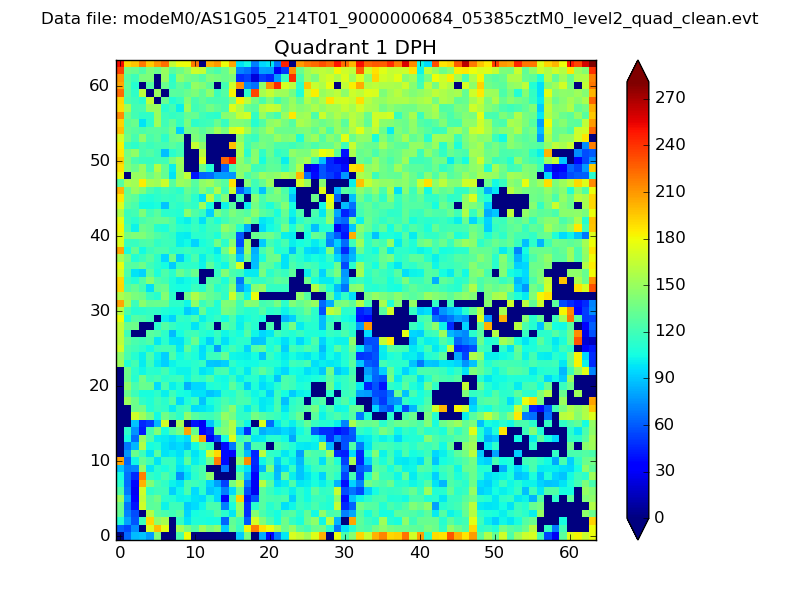 |
Quadrant B |
|---|---|---|---|
| Quadrant D | 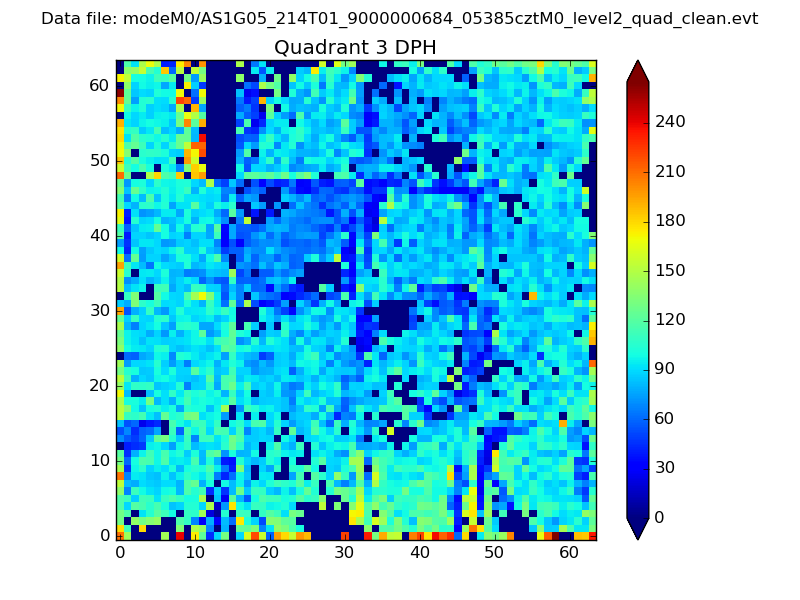 |
 |
Quadrant C |
| Plot type | Count rate plots | Images |
|---|---|---|
| Comparison with Poisson distribution Blue bars denote a histogram of data divided into 1 sec bins. Red curve is a Poisson curve with rate = median count rate of data. |
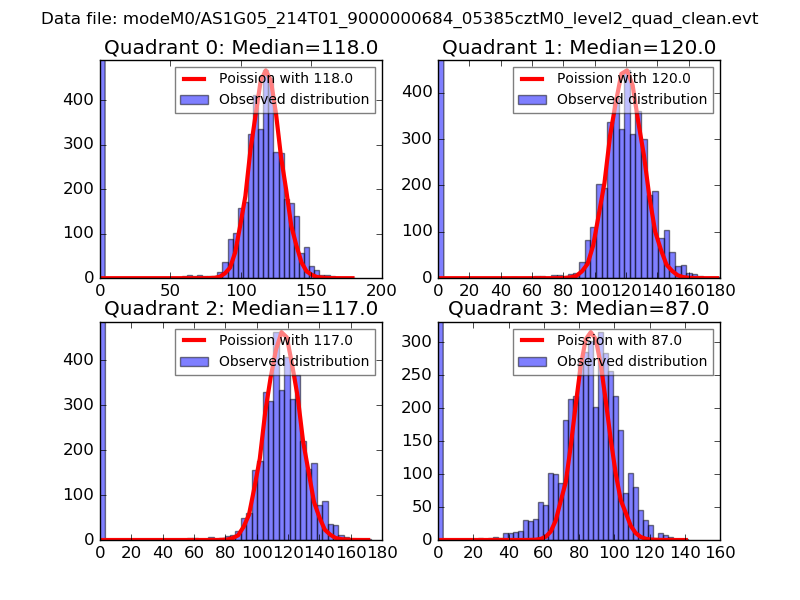 |
 |
| Quadrant-wise count rates Data is divided into 100 sec bins |
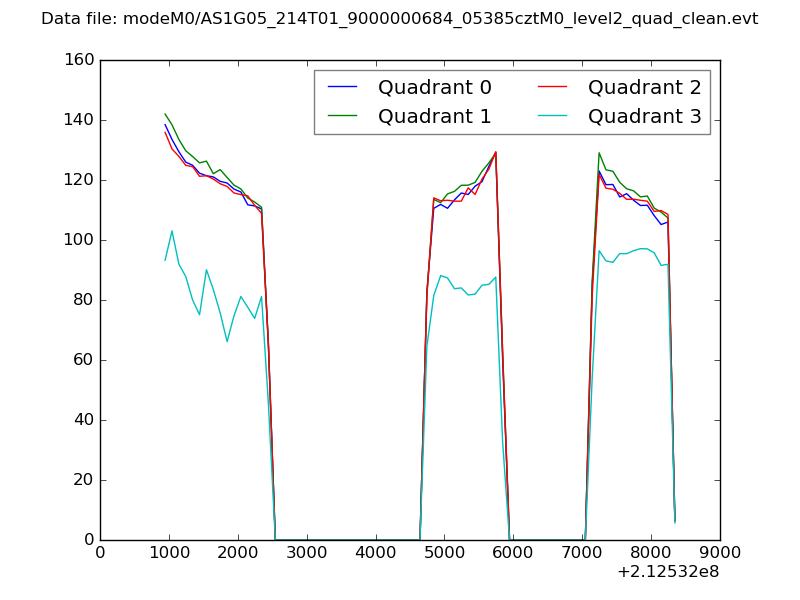 |
|
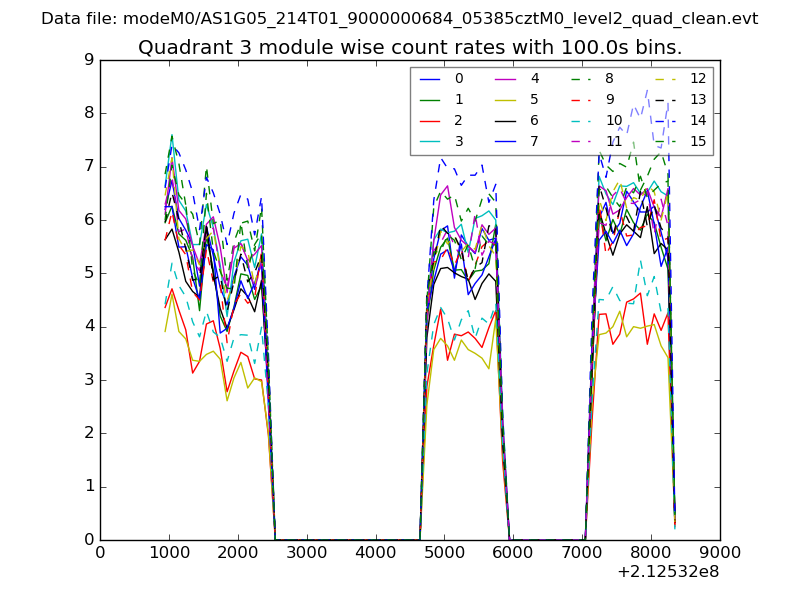
| Module-wise count rates for Quadrant A Data is divided into 100 sec bins |
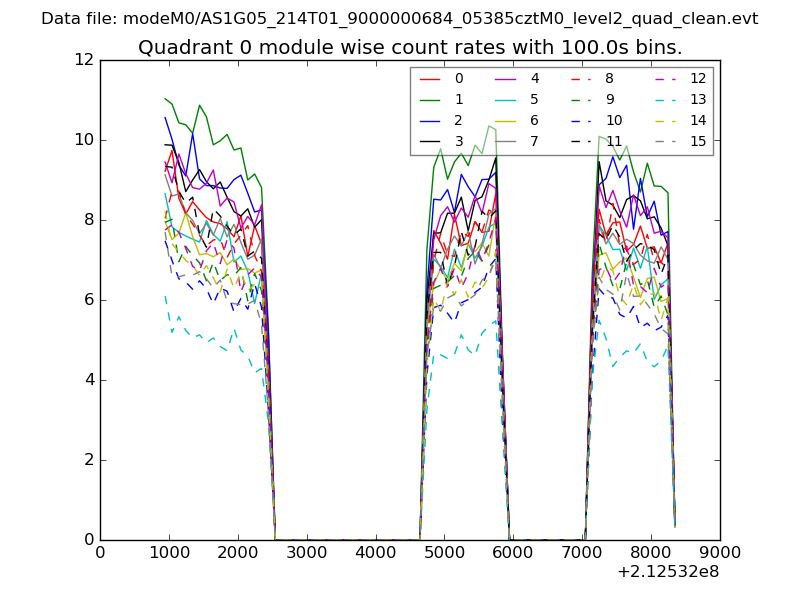 |
 |
| Module-wise count rates for Quadrant B Data is divided into 100 sec bins |
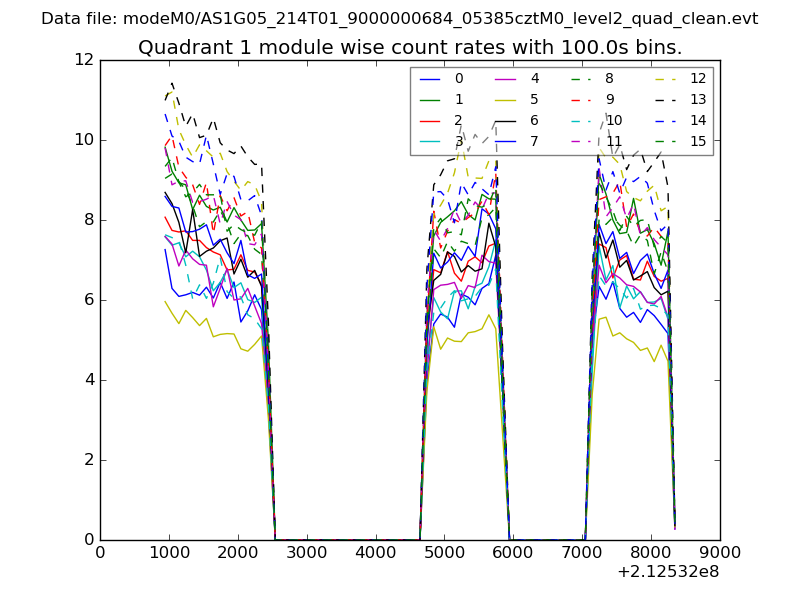 |
 |
| Module-wise count rates for Quadrant C Data is divided into 100 sec bins |
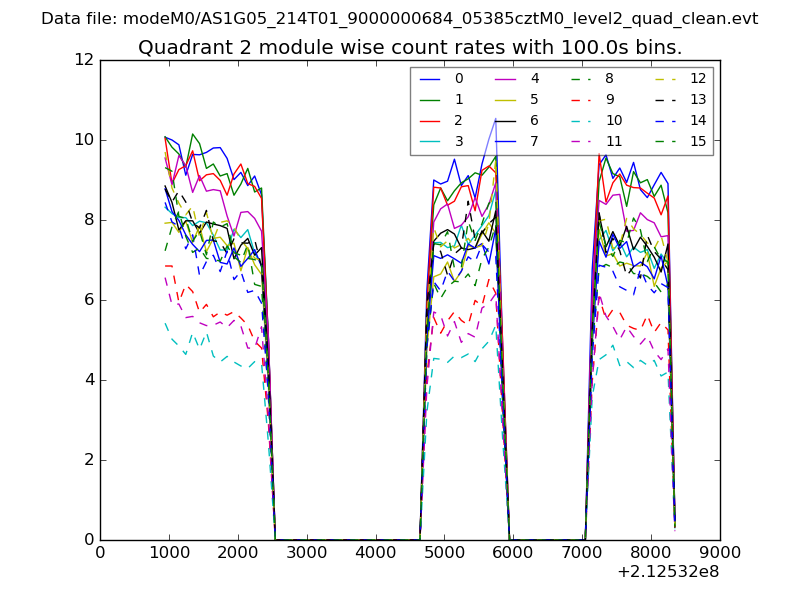 |
 |
| Module-wise count rates for Quadrant D Data is divided into 100 sec bins |
 |
 |
| Parameter | Plot |
|---|---|
| CZT HV Monitor | 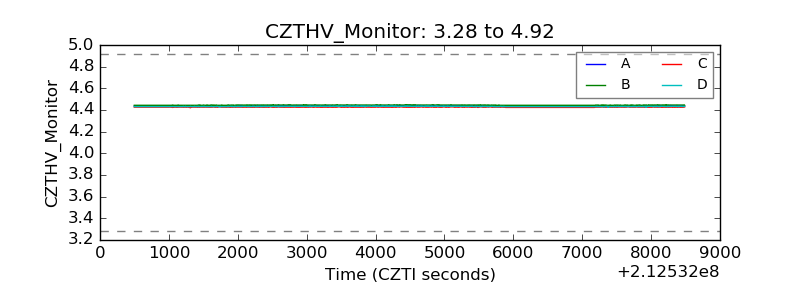 |
| D_VDD | 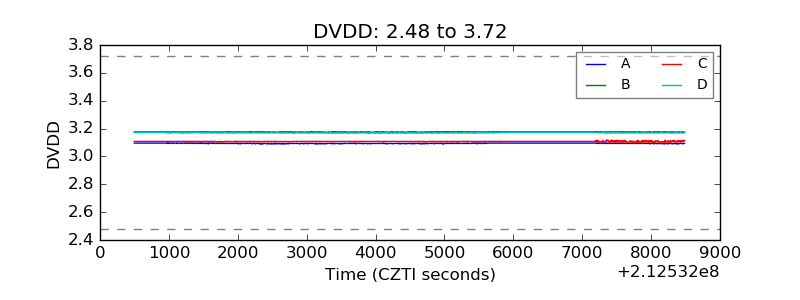 |
| Temperature 1 | 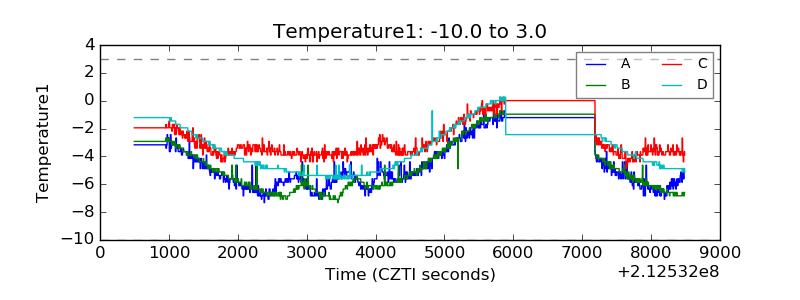 |
| Veto HV Monitor | 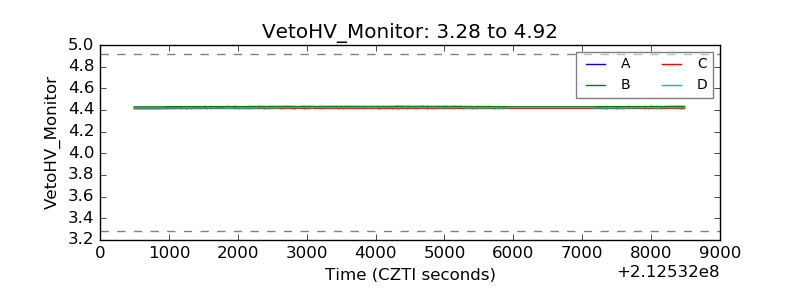 |
| Veto LLD | 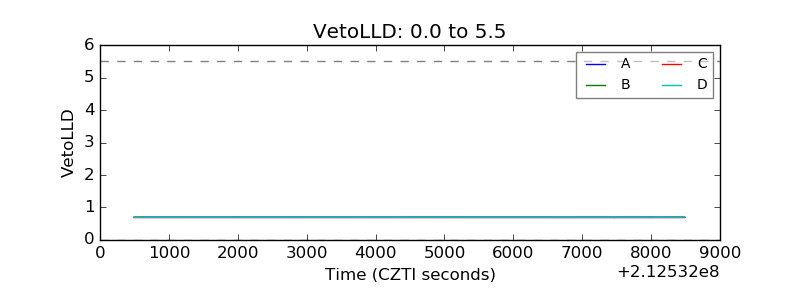 |
| Alpha Counter | 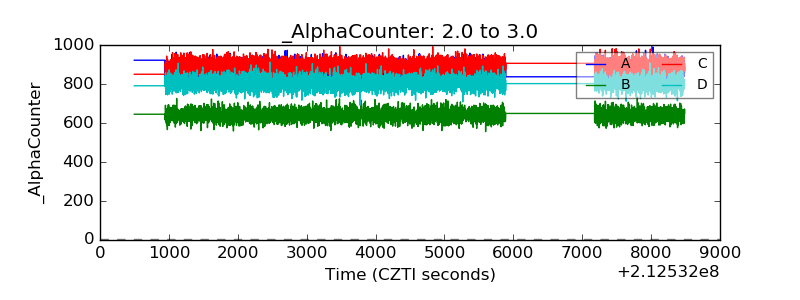 |
| _CPM_Rate | 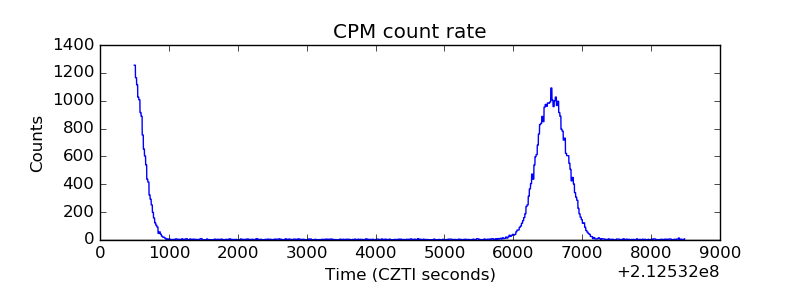 |
| CZT Counter | 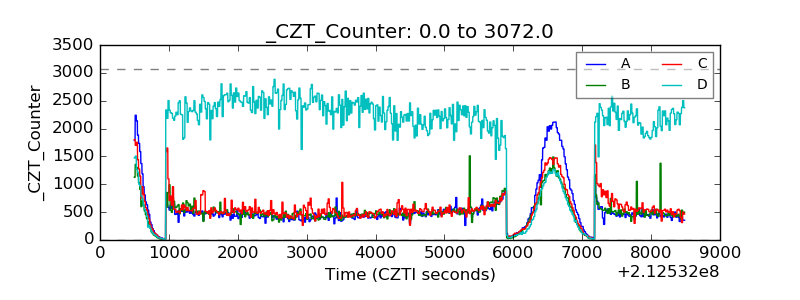 |
| +2.5 Volts monitor |  |
| +5 Volts monitor | 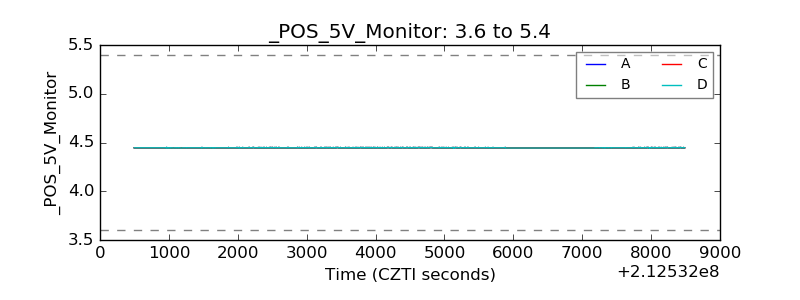 |
| _ROLL_ROT | 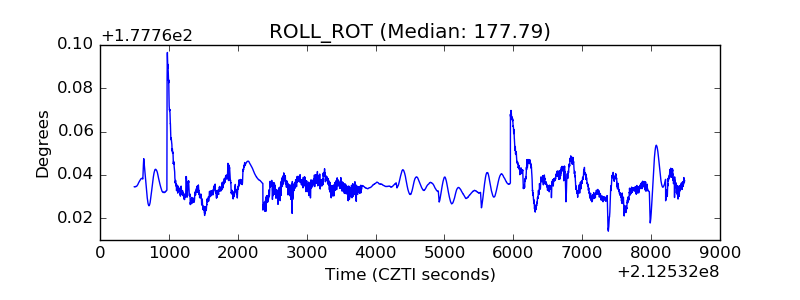 |
| _Roll_DEC | 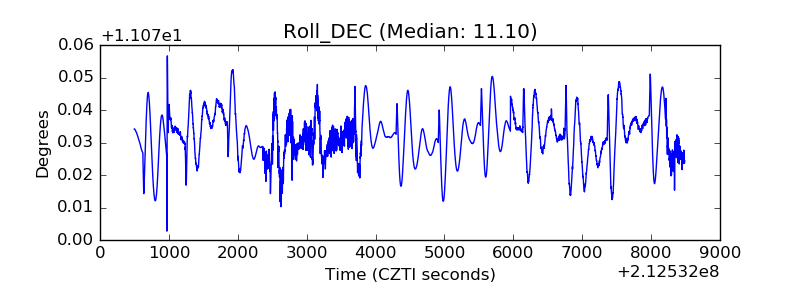 |
| _Roll_RA | 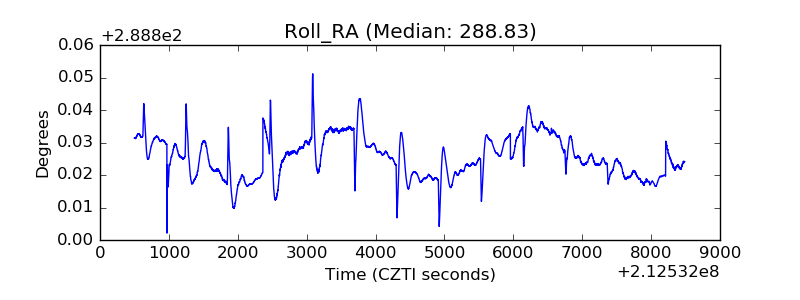 |
| Veto Counter | 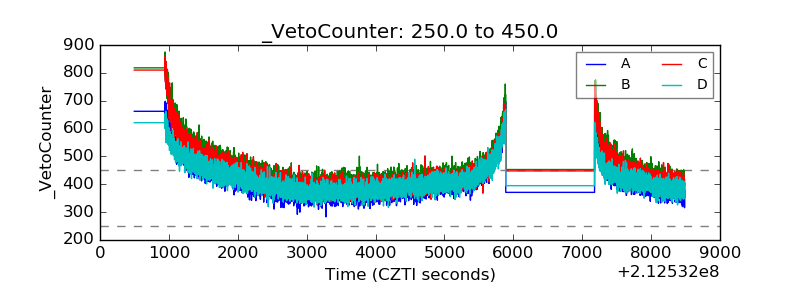 |