| Param | Original file | Final file |
|---|---|---|
| Filename | modeM0/AS1G05_214T01_9000000684_05386cztM0_level2.evt | modeM0/AS1G05_214T01_9000000684_05386cztM0_level2_quad_clean.evt |
| Size (bytes) | 793,546,560 | 66,873,600 |
| Size | 756.8 MB | 63.8 MB |
| Events in quadrant A | 3,055,917 | 412,164 |
| Events in quadrant B | 3,162,838 | 421,214 |
| Events in quadrant C | 3,419,517 | 414,459 |
| Events in quadrant D | 13,955,120 | 321,560 |
| Mode M9 | |||
|---|---|---|---|
| Quadrant | BADHDUFLAG | Total packets | Discarded packets |
| A | 0 | 11 | 0 |
| B | 0 | 11 | 0 |
| C | 0 | 11 | 0 |
| D | 0 | 11 | 0 |
| Mode SS | |||
|---|---|---|---|
| Quadrant | BADHDUFLAG | Total packets | Discarded packets |
| A | 0 | 130 | 0 |
| B | 0 | 130 | 0 |
| C | 0 | 130 | 0 |
| D | 0 | 130 | 0 |
| Mode M0 | |||
|---|---|---|---|
| Quadrant | BADHDUFLAG | Total packets | Discarded packets |
| A | 0 | 13520 | 2 |
| B | 0 | 13639 | 1 |
| C | 0 | 14115 | 1 |
| D | 0 | 45846 | 1 |
| Quadrant | Total seconds | Saturated seconds | Saturation percentage |
|---|---|---|---|
| A | 6520 | 47 | 0.720859% |
| B | 6520 | 55 | 0.843558% |
| C | 6520 | 35 | 0.536810% |
| D | 6520 | 3122 | 47.883436% |
Noise dominated data is calculated using 1-second bins in cleaned event files. If a bin has >2000 counts, and if more than 50% of those come from <1% of pixels, then it is considered to be noise-dominated and hence unusable.
| Quadrant | # 1 sec bins | Bins with >0 counts | Bins with >2000 counts | High rate bins dominated by noise | Noise dominated (total time) | Noise dominated (detector-on time) | Marked lightcurve |
|---|---|---|---|---|---|---|---|
| A | 7570 | 6521 | 8 | 8 | 0.11% | 0.12% | 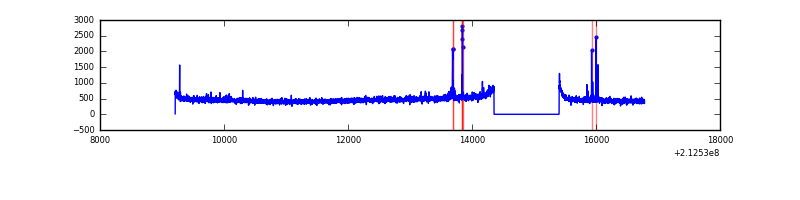 |
| B | 7570 | 6521 | 3 | 3 | 0.04% | 0.05% | 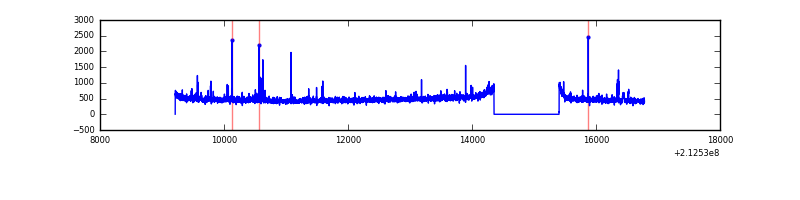 |
| C | 7570 | 6521 | 0 | 0 | 0.00% | 0.00% | 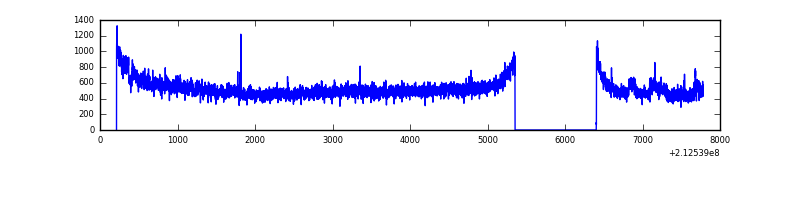 |
| D | 7570 | 6521 | 5120 | 5120 | 67.64% | 78.52% | 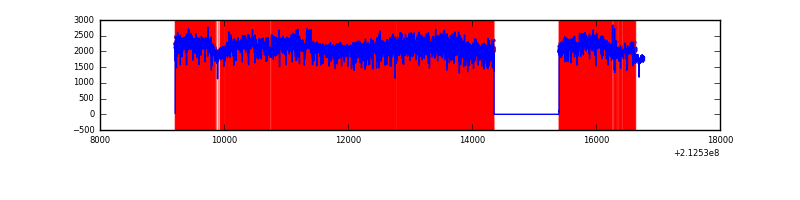 |
Top three noisy pixels from each quadrant. If the there are fewer than three noisy pixels in the level2.evt file, extra rows are filled as -1
| Pixel properties | Quadrant properties | ||||||
|---|---|---|---|---|---|---|---|
| Quadrant | DetID | PixID | Counts | Sigma | Mean | Median | Sigma |
| A | 0 | 50 | 27502 | 169.29 | 771 | 754 | 158.0 |
| A | 15 | 234 | 22589 | 138.2 | 771 | 754 | 158.0 |
| A | 13 | 6 | 21594 | 131.9 | 771 | 754 | 158.0 |
| B | 4 | 81 | 29549 | 189.72 | 787 | 768 | 151.7 |
| B | 4 | 48 | 26407 | 169.0 | 787 | 768 | 151.7 |
| B | 0 | 219 | 17687 | 111.52 | 787 | 768 | 151.7 |
| C | 1 | 16 | 435487 | 2471.33 | 755 | 761 | 175.9 |
| C | 8 | 128 | 16707 | 90.65 | 755 | 761 | 175.9 |
| C | 14 | 67 | 7658 | 39.21 | 755 | 761 | 175.9 |
| D | 7 | 237 | 10739888 | 63277.98 | 680 | 659 | 169.7 |
| D | 2 | 63 | 564194 | 3320.48 | 680 | 659 | 169.7 |
| D | 1 | 239 | 31328 | 180.71 | 680 | 659 | 169.7 |
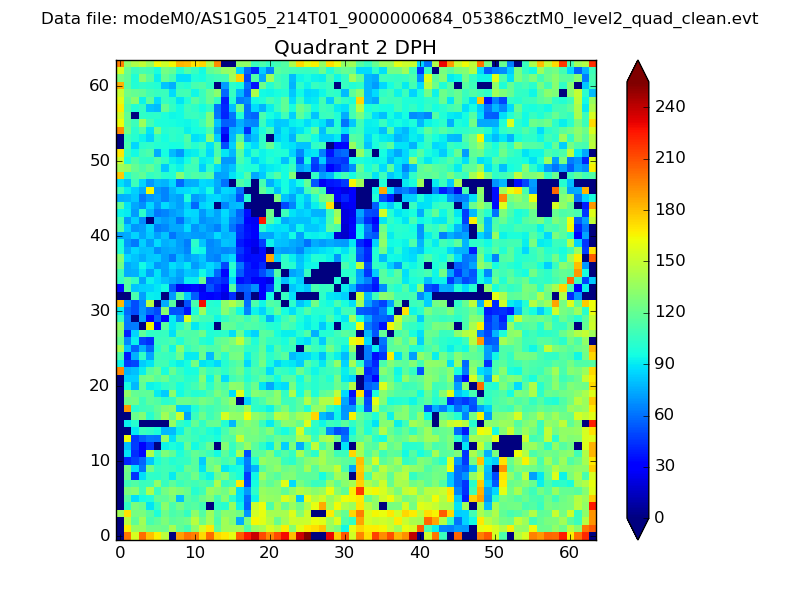
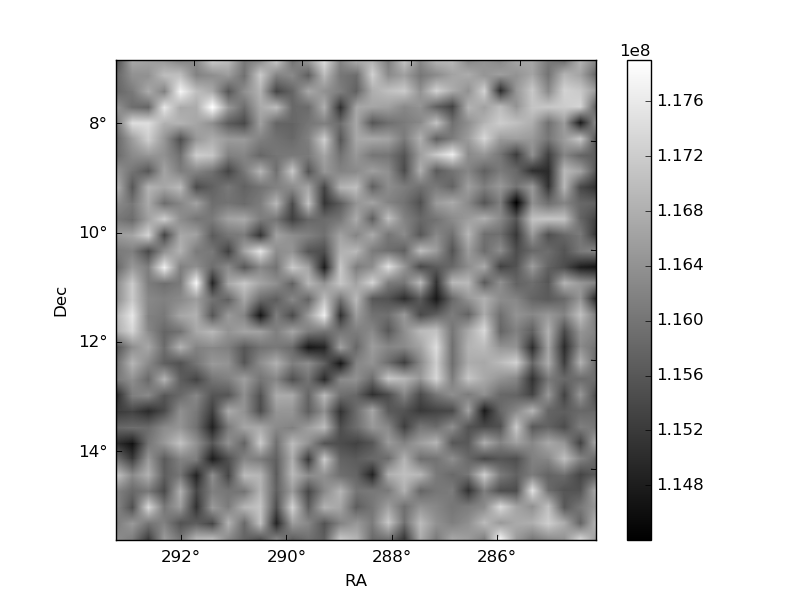
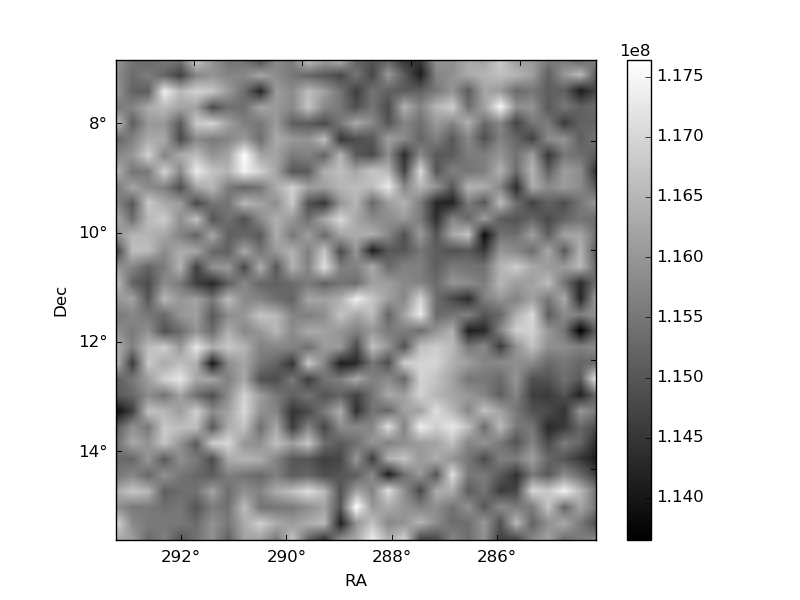
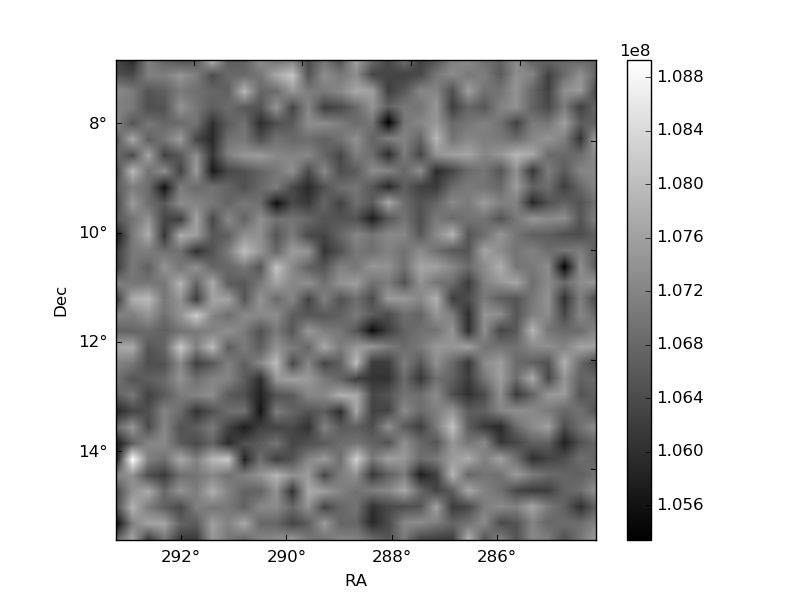
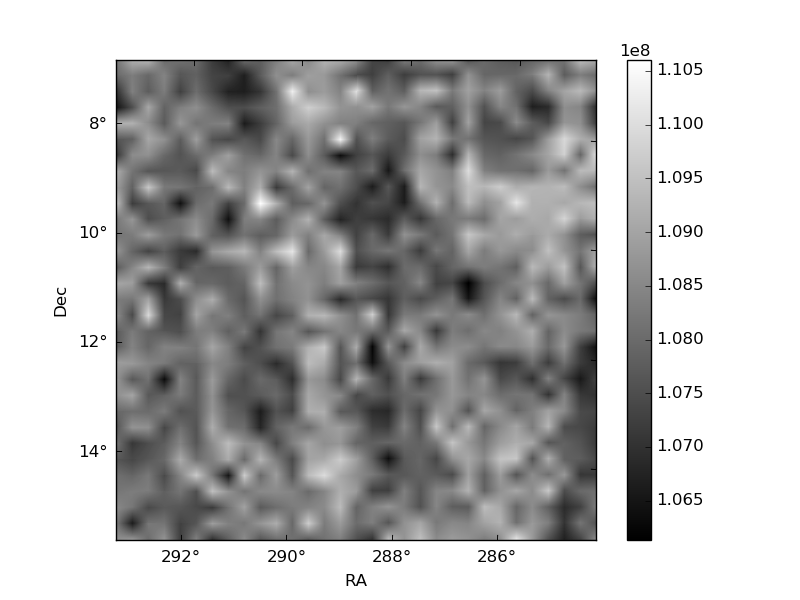
Histogram calculated using DETX and DETY for each event in the final _common_clean file
| Quadrant A | 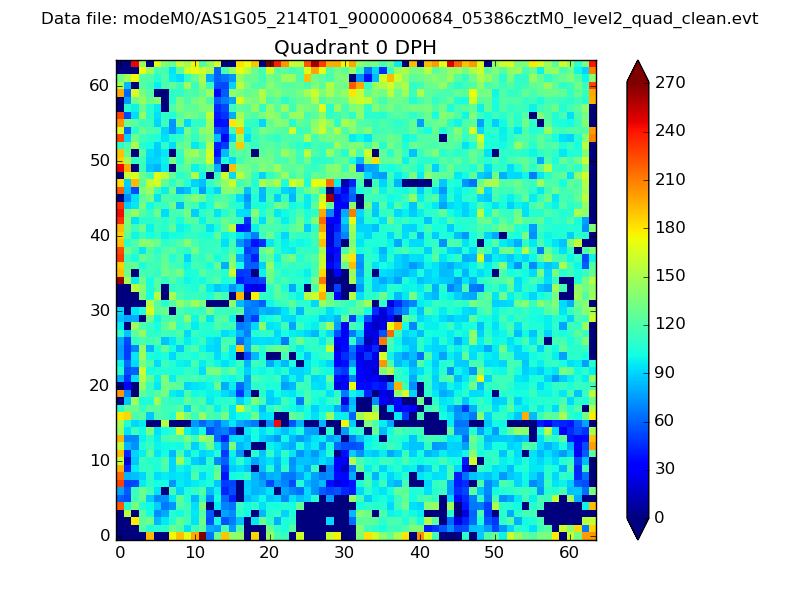 |
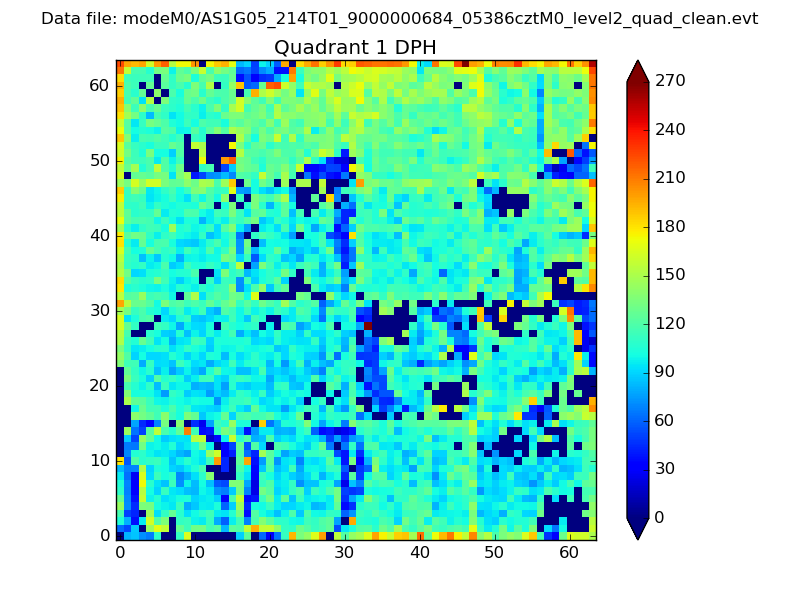 |
Quadrant B |
|---|---|---|---|
| Quadrant D | 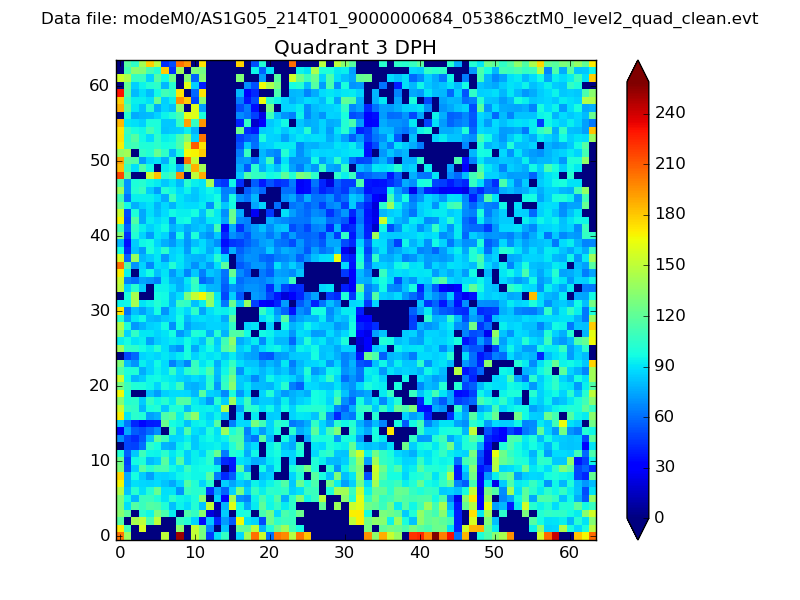 |
 |
Quadrant C |
| Plot type | Count rate plots | Images |
|---|---|---|
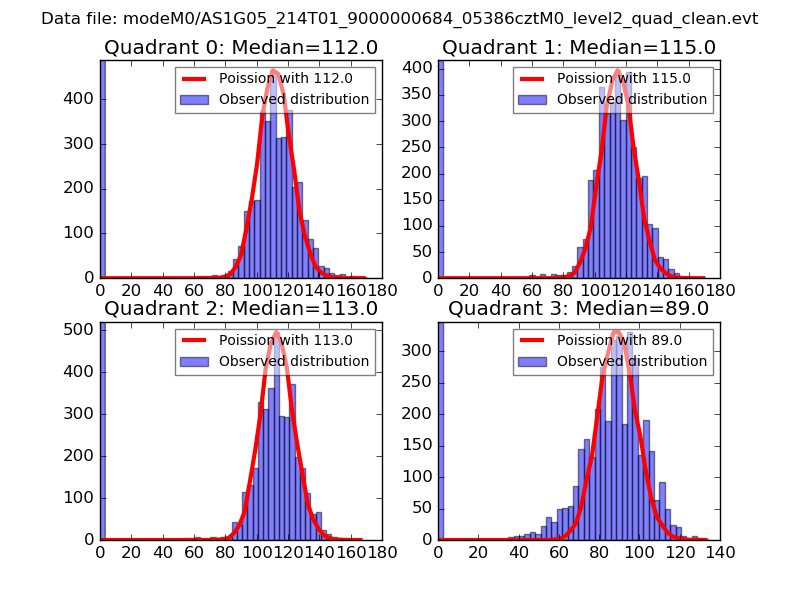
| Comparison with Poisson distribution Blue bars denote a histogram of data divided into 1 sec bins. Red curve is a Poisson curve with rate = median count rate of data. |
 |
 |
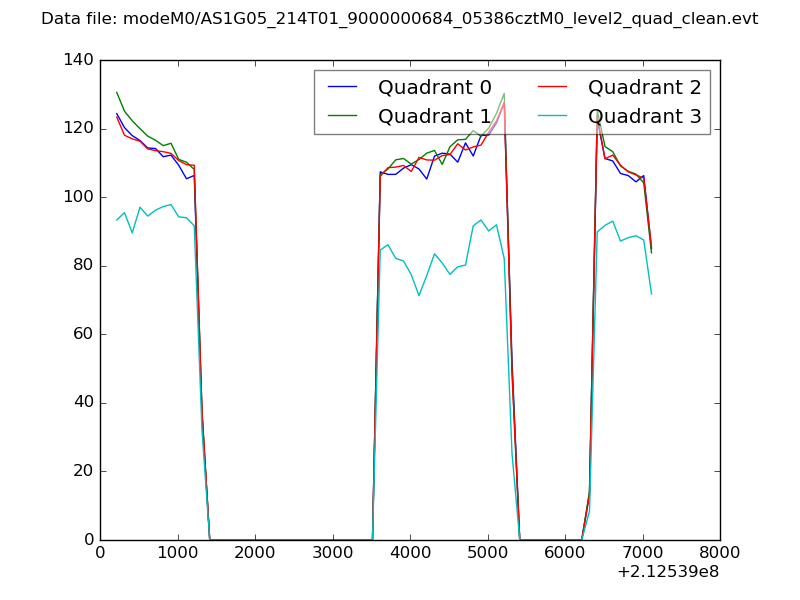
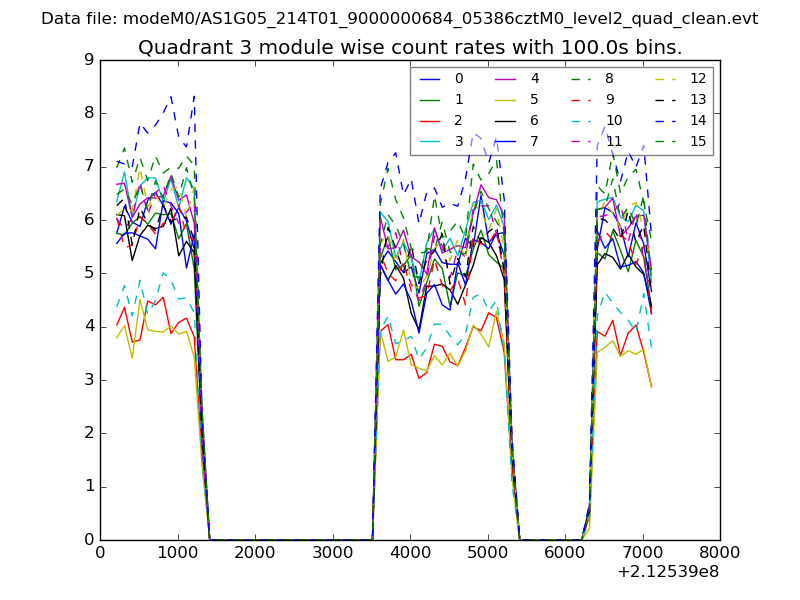
| Quadrant-wise count rates Data is divided into 100 sec bins |
 |
|
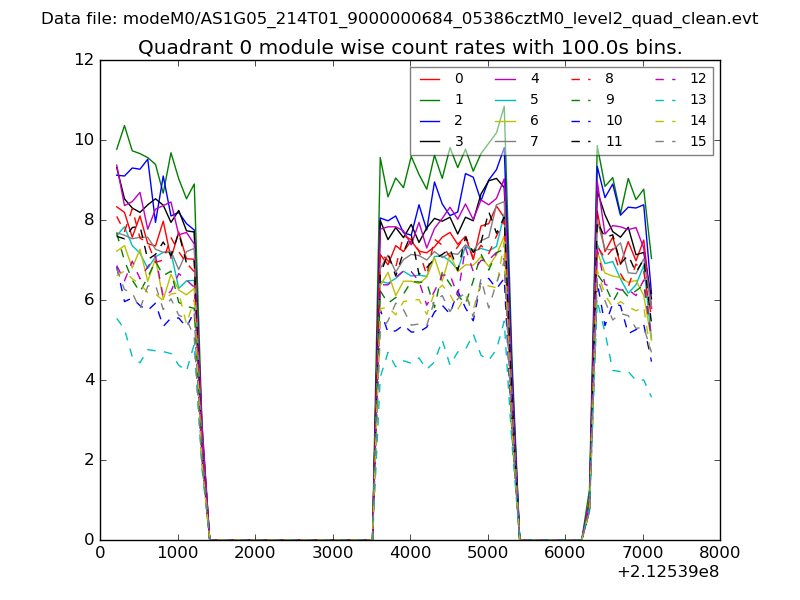
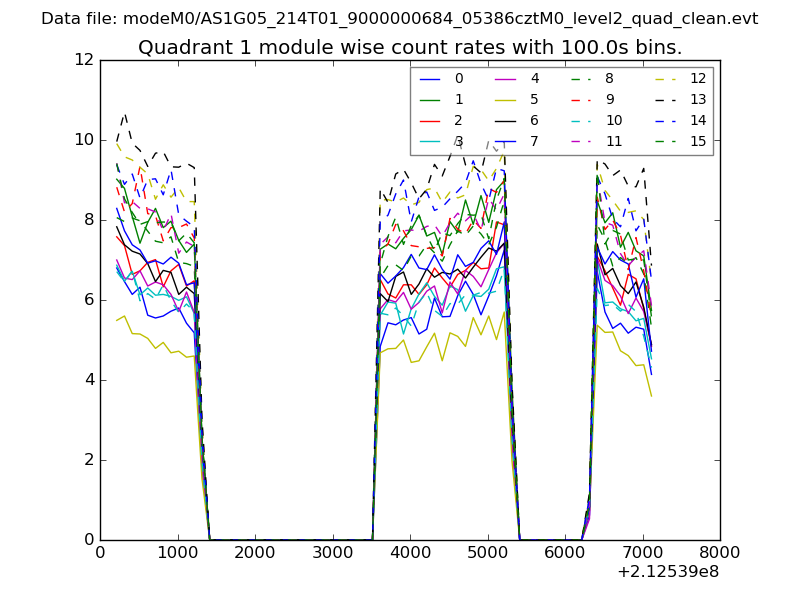
| Module-wise count rates for Quadrant A Data is divided into 100 sec bins |
 |
 |
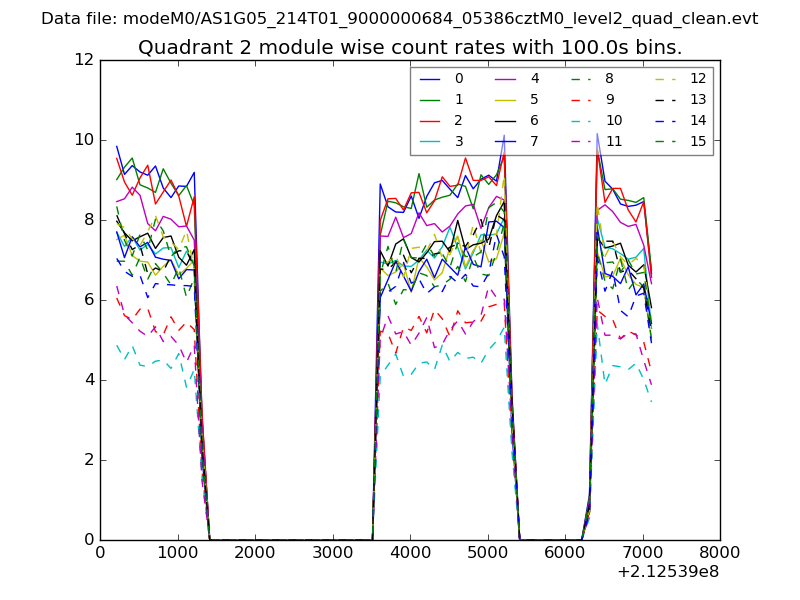
| Module-wise count rates for Quadrant B Data is divided into 100 sec bins |
 |
 |
| Module-wise count rates for Quadrant C Data is divided into 100 sec bins |
 |
 |
| Module-wise count rates for Quadrant D Data is divided into 100 sec bins |
 |
 |
| Parameter | Plot |
|---|---|
| CZT HV Monitor | 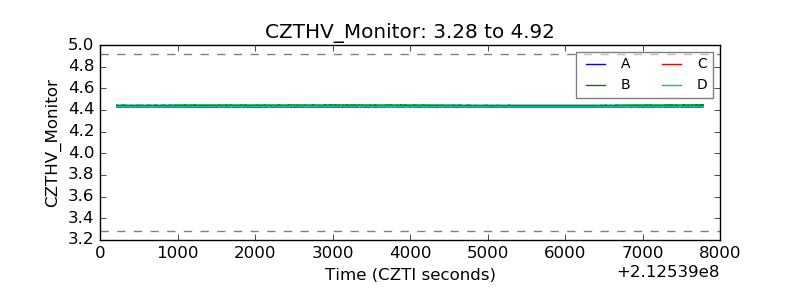 |
| D_VDD | 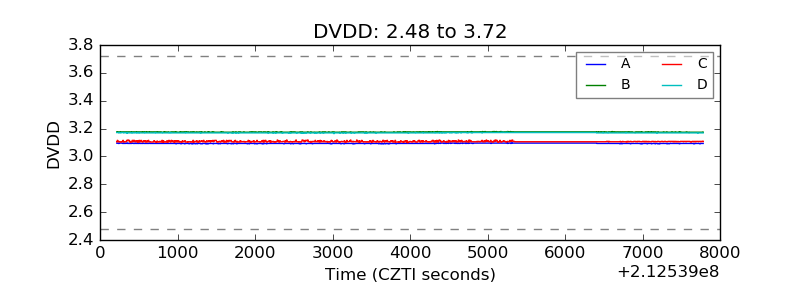 |
| Temperature 1 | 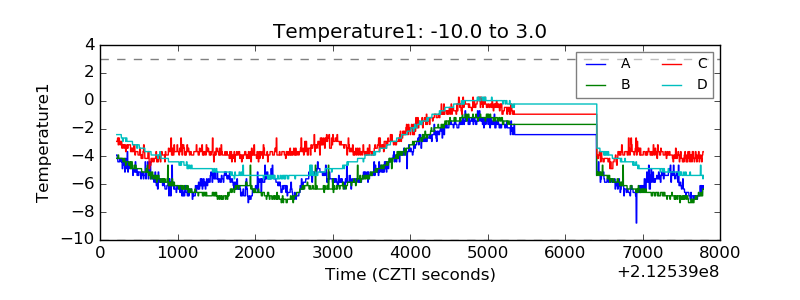 |
| Veto HV Monitor | 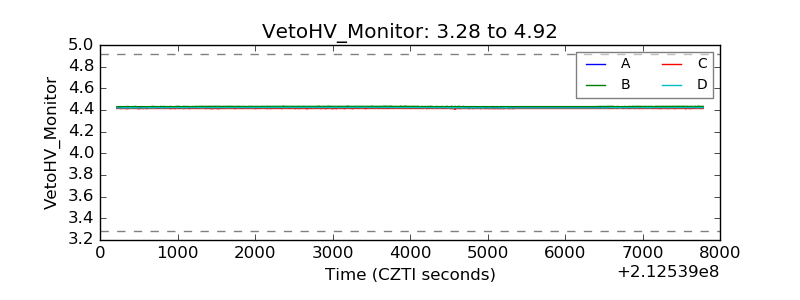 |
| Veto LLD | 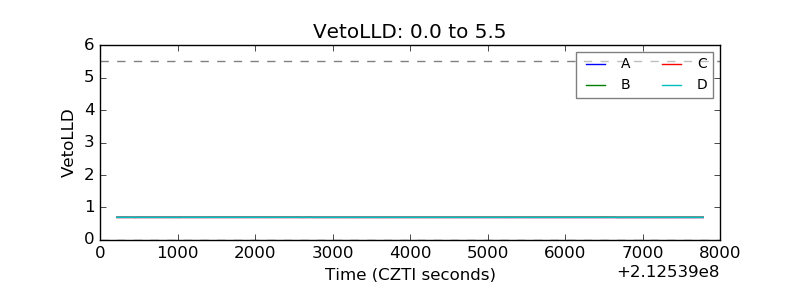 |
| Alpha Counter | 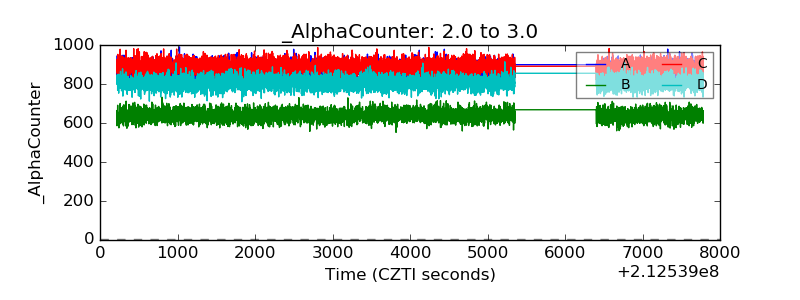 |
| _CPM_Rate | 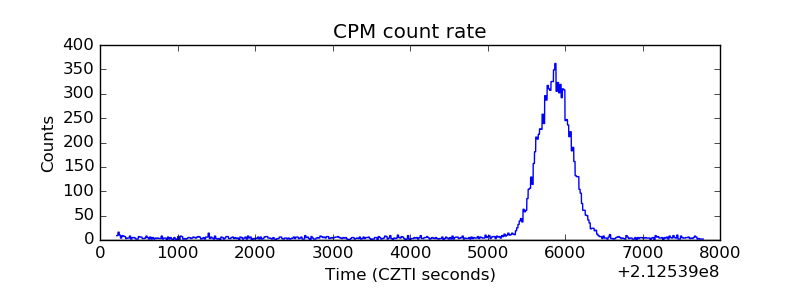 |
| CZT Counter | 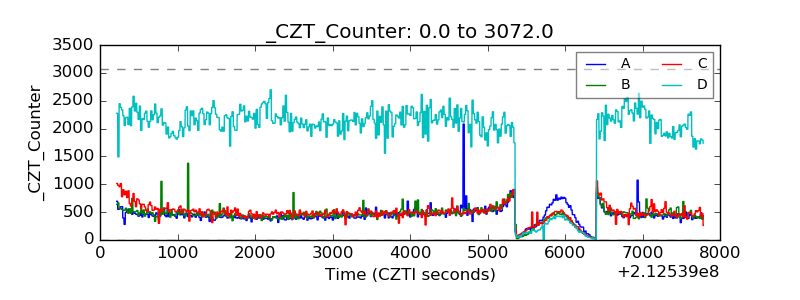 |
| +2.5 Volts monitor |  |
| +5 Volts monitor |  |
| _ROLL_ROT | 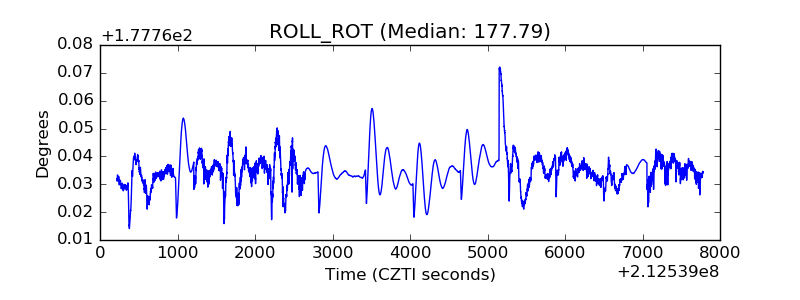 |
| _Roll_DEC | 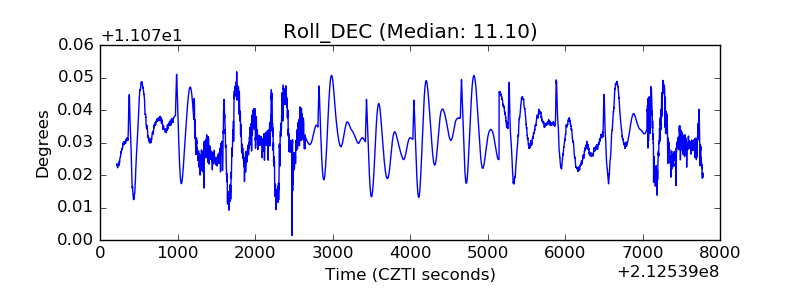 |
| _Roll_RA | 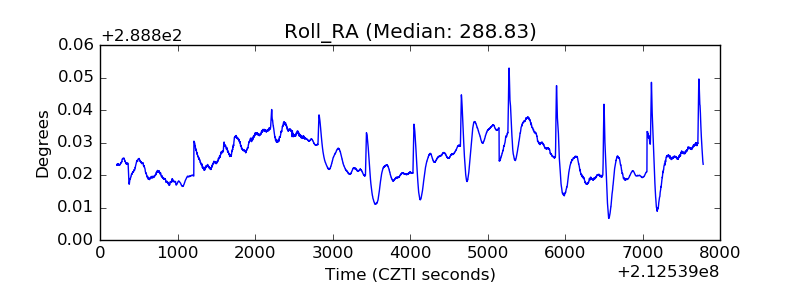 |
| Veto Counter | 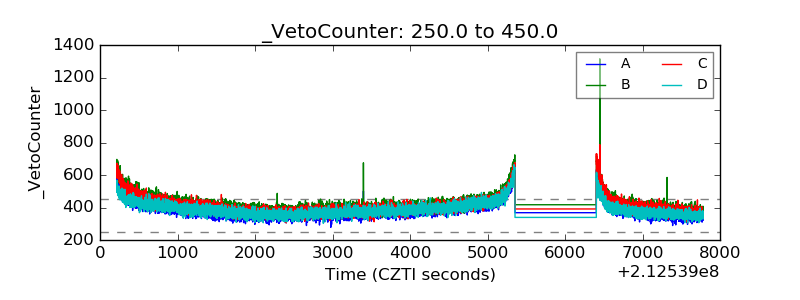 |