| Param | Original file | Final file |
|---|---|---|
| Filename | modeM0/AS1G05_214T01_9000000684_05387cztM0_level2.evt | modeM0/AS1G05_214T01_9000000684_05387cztM0_level2_quad_clean.evt |
| Size (bytes) | 804,015,360 | 74,206,080 |
| Size | 766.8 MB | 70.8 MB |
| Events in quadrant A | 3,507,596 | 452,441 |
| Events in quadrant B | 3,572,423 | 456,003 |
| Events in quadrant C | 3,926,220 | 451,568 |
| Events in quadrant D | 12,850,584 | 376,904 |
| Mode M9 | |||
|---|---|---|---|
| Quadrant | BADHDUFLAG | Total packets | Discarded packets |
| A | 0 | 17 | 0 |
| B | 0 | 17 | 0 |
| C | 0 | 17 | 0 |
| D | 0 | 17 | 0 |
| Mode SS | |||
|---|---|---|---|
| Quadrant | BADHDUFLAG | Total packets | Discarded packets |
| A | 0 | 150 | 0 |
| B | 0 | 150 | 0 |
| C | 0 | 150 | 0 |
| D | 0 | 150 | 0 |
| Mode M0 | |||
|---|---|---|---|
| Quadrant | BADHDUFLAG | Total packets | Discarded packets |
| A | 0 | 15502 | 3 |
| B | 0 | 15485 | 2 |
| C | 0 | 16225 | 2 |
| D | 0 | 43215 | 2 |
| Quadrant | Total seconds | Saturated seconds | Saturation percentage |
|---|---|---|---|
| A | 7316 | 140 | 1.913614% |
| B | 7316 | 140 | 1.913614% |
| C | 7316 | 71 | 0.970476% |
| D | 7316 | 1468 | 20.065610% |
Noise dominated data is calculated using 1-second bins in cleaned event files. If a bin has >2000 counts, and if more than 50% of those come from <1% of pixels, then it is considered to be noise-dominated and hence unusable.
| Quadrant | # 1 sec bins | Bins with >0 counts | Bins with >2000 counts | High rate bins dominated by noise | Noise dominated (total time) | Noise dominated (detector-on time) | Marked lightcurve |
|---|---|---|---|---|---|---|---|
| A | 9026 | 7318 | 18 | 18 | 0.20% | 0.25% | 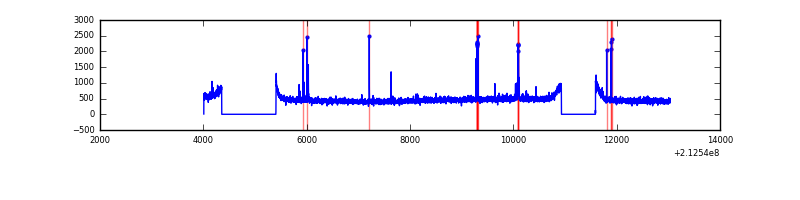 |
| B | 9026 | 7318 | 2 | 2 | 0.02% | 0.03% | 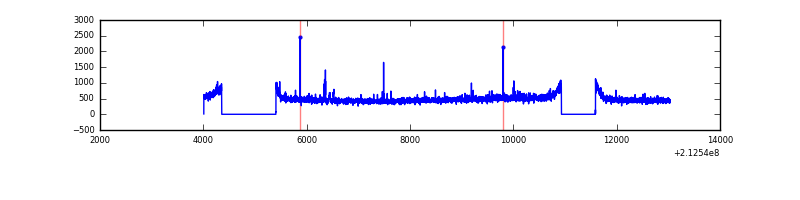 |
| C | 9026 | 7318 | 0 | 0 | 0.00% | 0.00% | 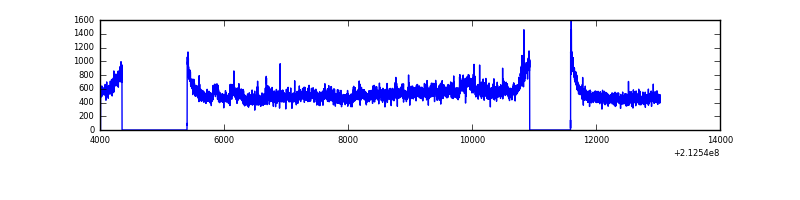 |
| D | 9026 | 7318 | 1652 | 1652 | 18.30% | 22.57% | 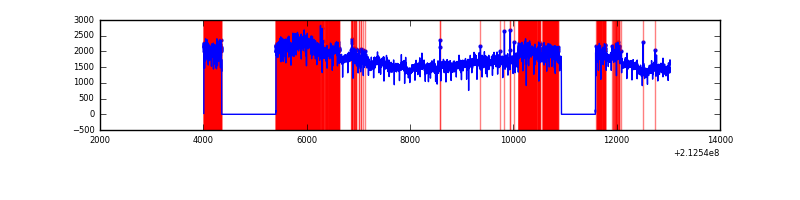 |
Top three noisy pixels from each quadrant. If the there are fewer than three noisy pixels in the level2.evt file, extra rows are filled as -1
| Pixel properties | Quadrant properties | ||||||
|---|---|---|---|---|---|---|---|
| Quadrant | DetID | PixID | Counts | Sigma | Mean | Median | Sigma |
| A | 0 | 50 | 55715 | 303.99 | 879 | 858 | 180.5 |
| A | 15 | 174 | 47374 | 257.77 | 879 | 858 | 180.5 |
| A | 13 | 6 | 17680 | 93.22 | 879 | 858 | 180.5 |
| B | 4 | 81 | 25505 | 141.73 | 893 | 869 | 173.8 |
| B | 15 | 204 | 24766 | 137.48 | 893 | 869 | 173.8 |
| B | 0 | 187 | 23901 | 132.5 | 893 | 869 | 173.8 |
| C | 1 | 16 | 571960 | 2846.82 | 858 | 861 | 200.6 |
| C | 13 | 61 | 6912 | 30.16 | 858 | 861 | 200.6 |
| C | 12 | 4 | 4373 | 17.51 | 858 | 861 | 200.6 |
| D | 7 | 237 | 9510633 | 47553.39 | 806 | 781 | 200.0 |
| D | 2 | 63 | 212872 | 1060.55 | 806 | 781 | 200.0 |
| D | 8 | 195 | 28374 | 137.98 | 806 | 781 | 200.0 |
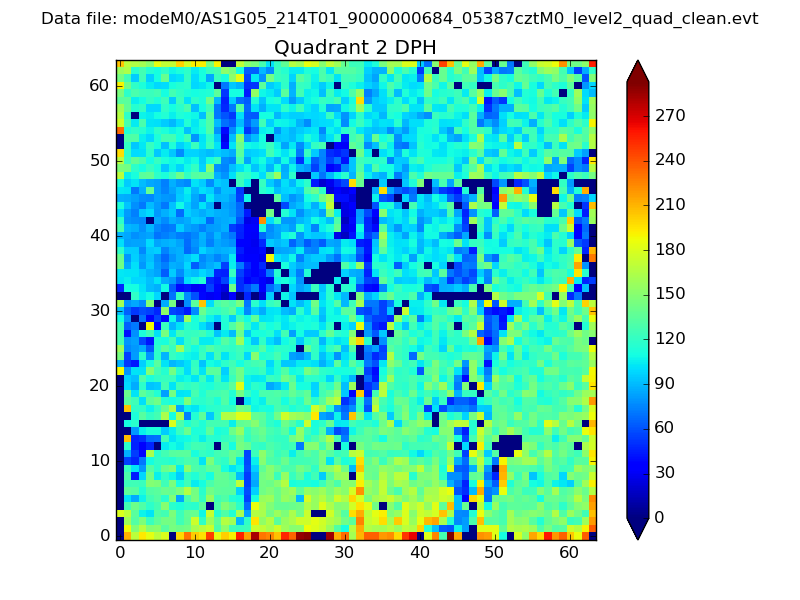
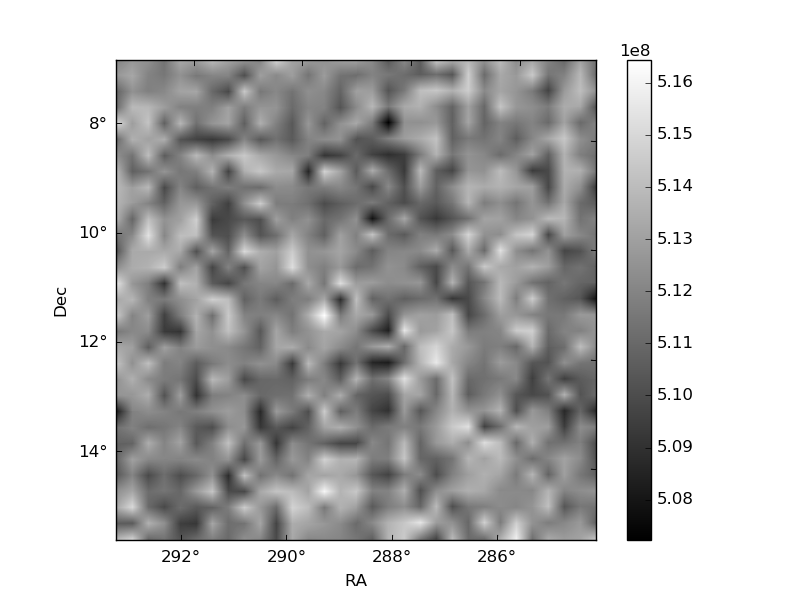
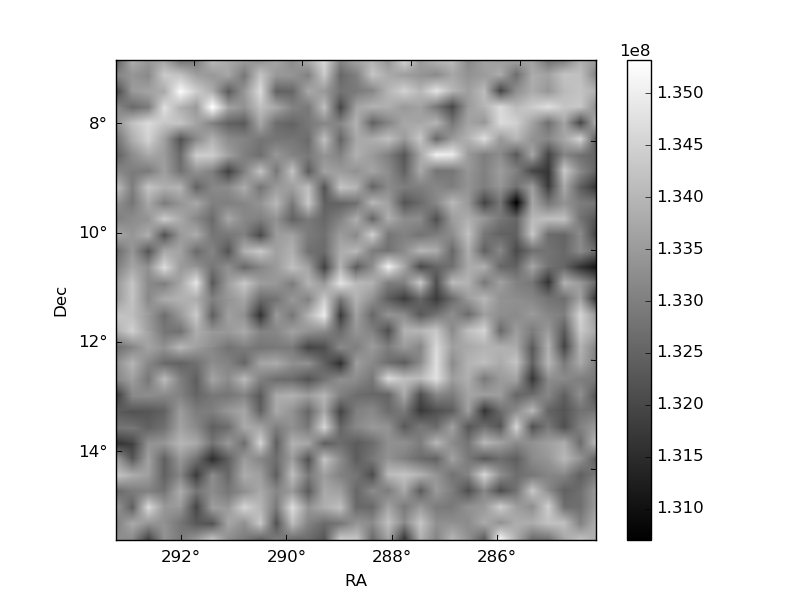
Histogram calculated using DETX and DETY for each event in the final _common_clean file
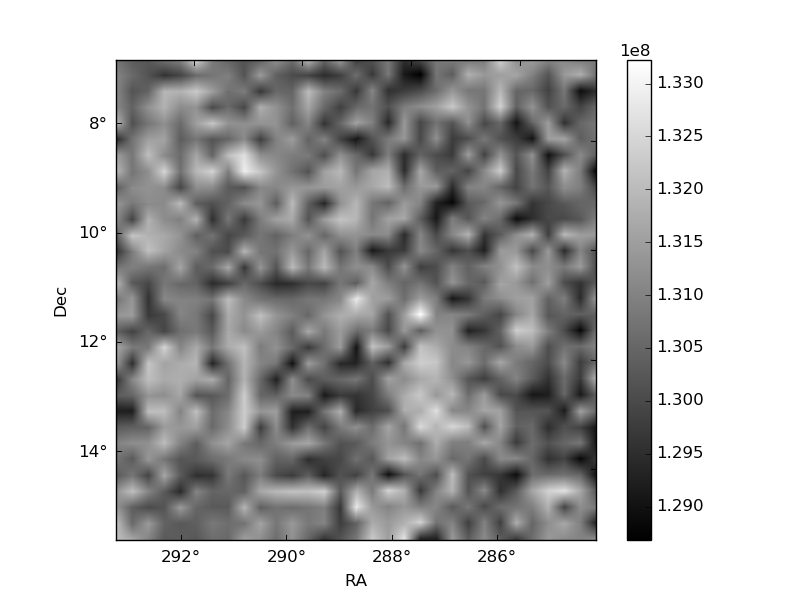
| Quadrant A | 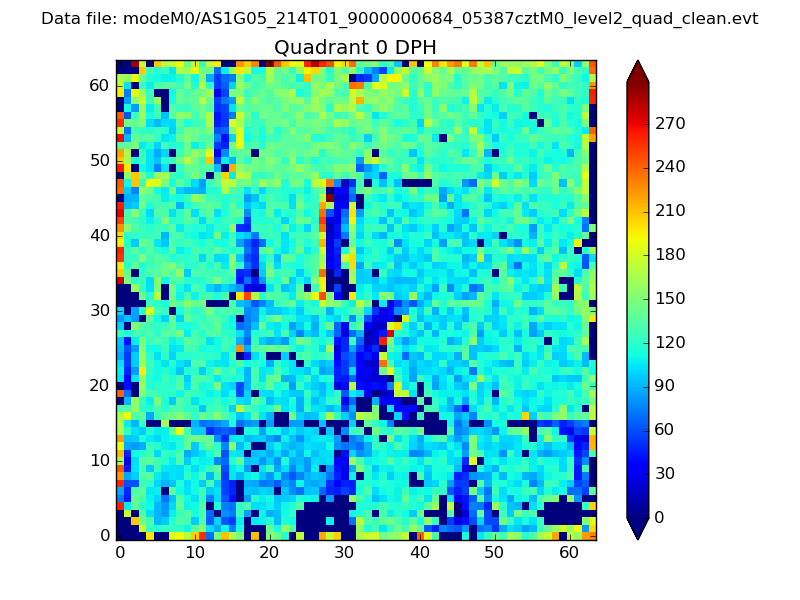 |
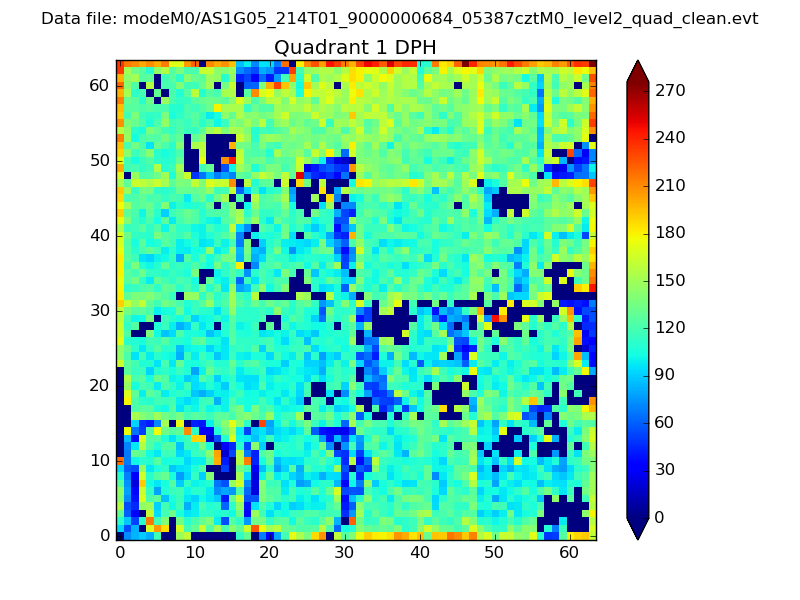 |
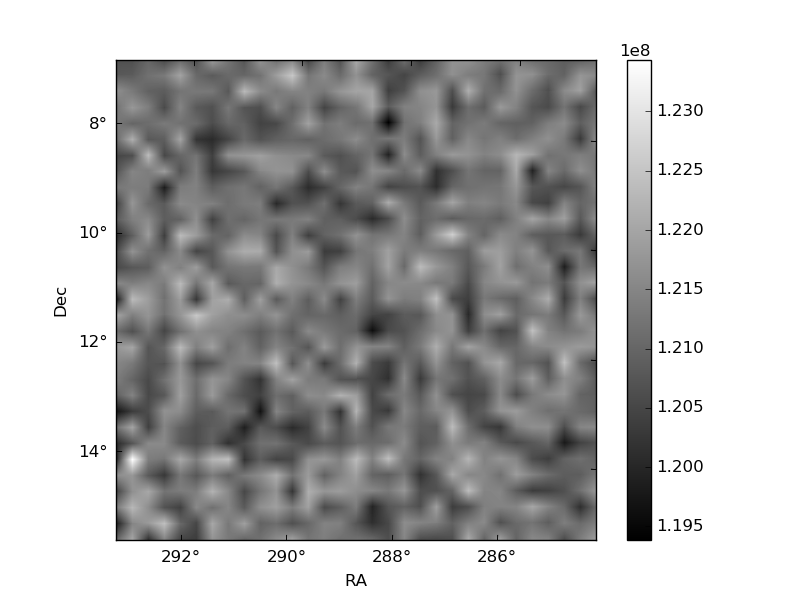
Quadrant B |
|---|---|---|---|
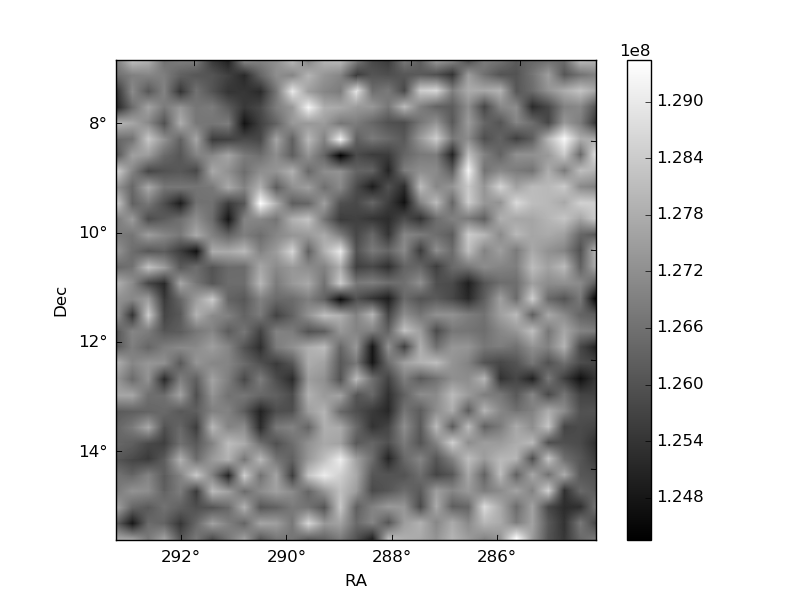
| Quadrant D | 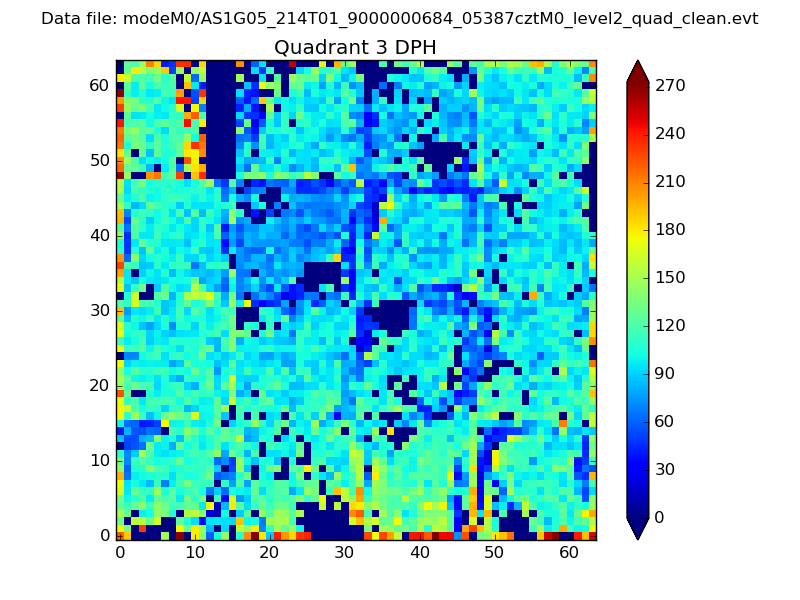 |
 |
Quadrant C |
| Plot type | Count rate plots | Images |
|---|---|---|
| Comparison with Poisson distribution Blue bars denote a histogram of data divided into 1 sec bins. Red curve is a Poisson curve with rate = median count rate of data. |
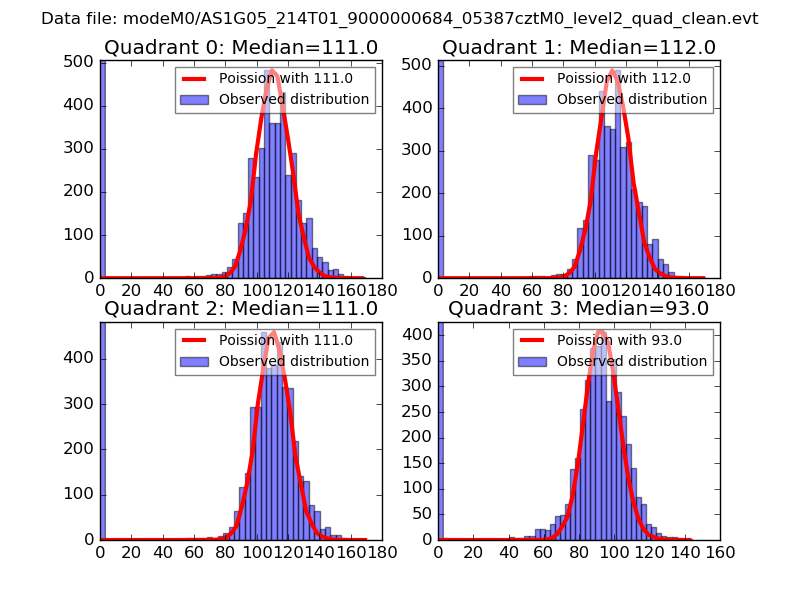 |
 |
| Quadrant-wise count rates Data is divided into 100 sec bins |
 |
|
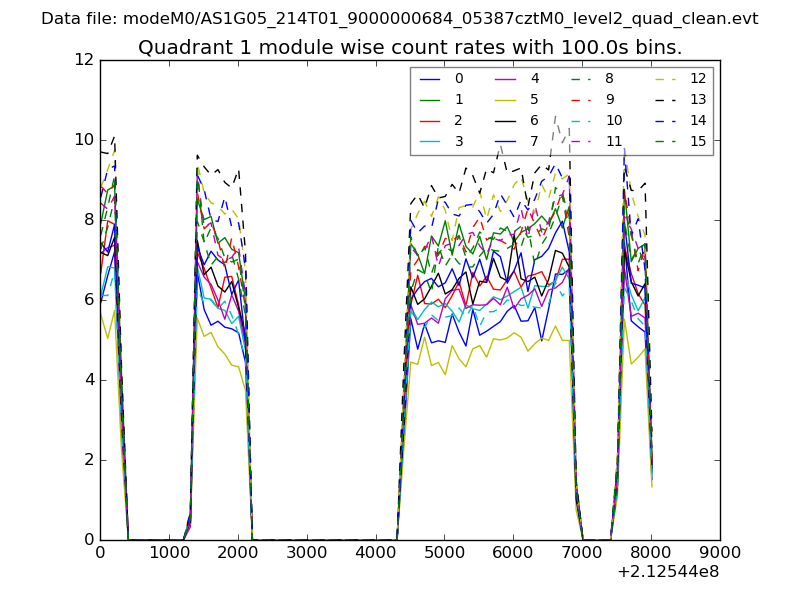
| Module-wise count rates for Quadrant A Data is divided into 100 sec bins |
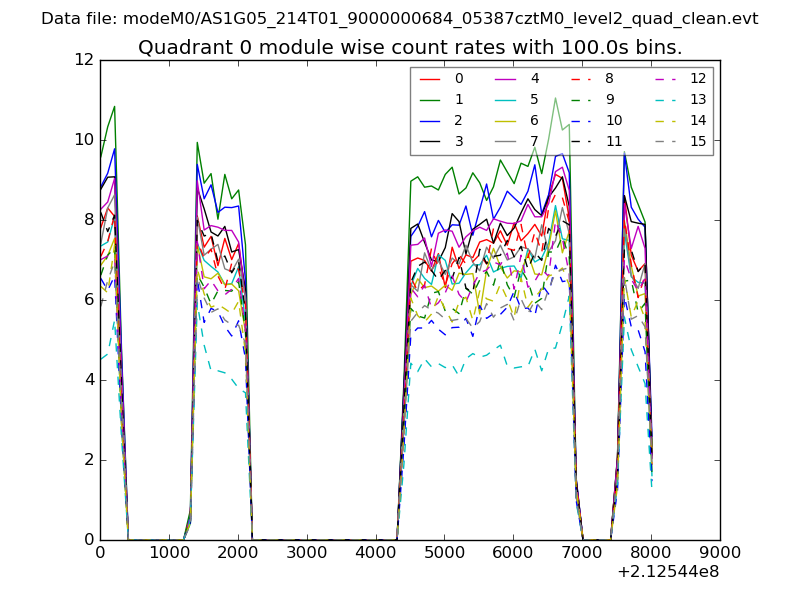 |
 |
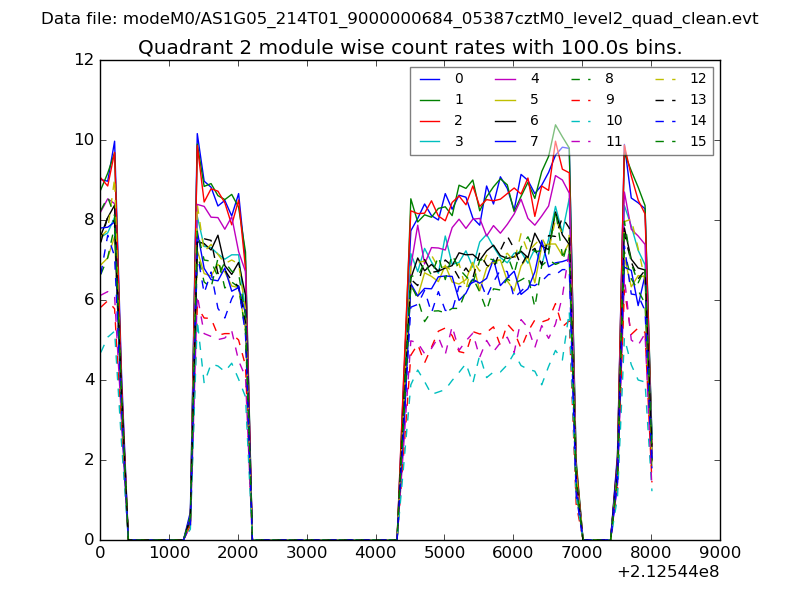
| Module-wise count rates for Quadrant B Data is divided into 100 sec bins |
 |
 |
| Module-wise count rates for Quadrant C Data is divided into 100 sec bins |
 |
 |
| Module-wise count rates for Quadrant D Data is divided into 100 sec bins |
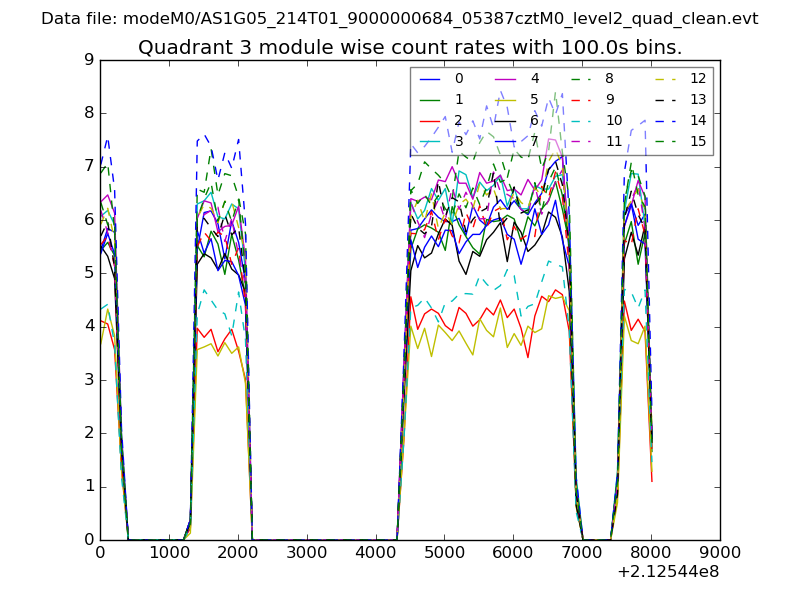 |
 |
| Parameter | Plot |
|---|---|
| CZT HV Monitor | 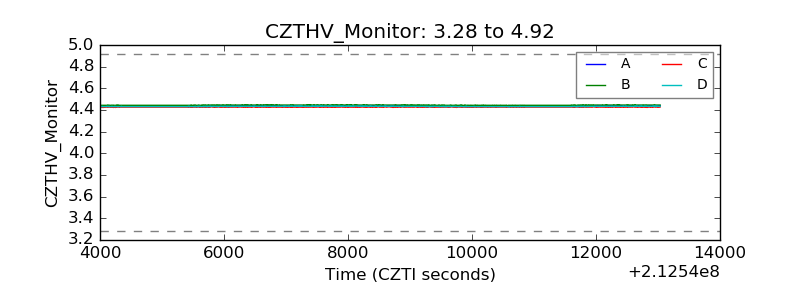 |
| D_VDD | 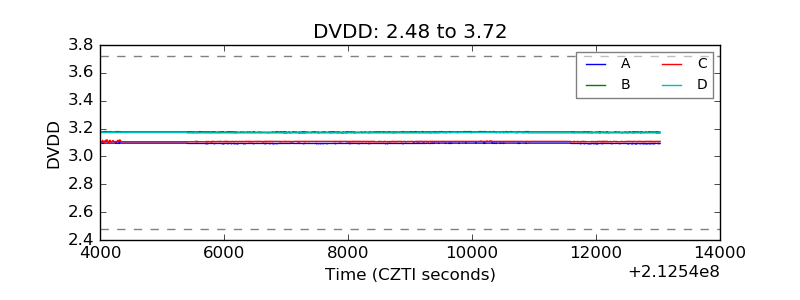 |
| Temperature 1 | 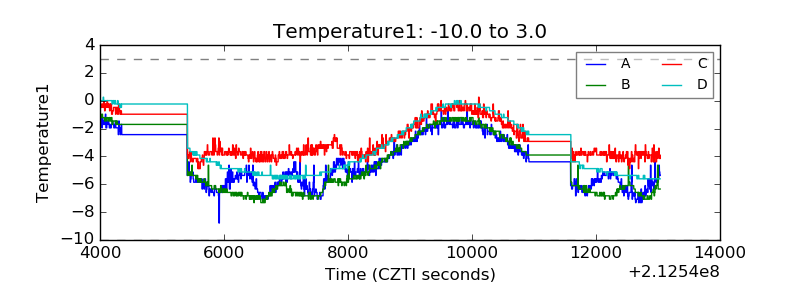 |
| Veto HV Monitor | 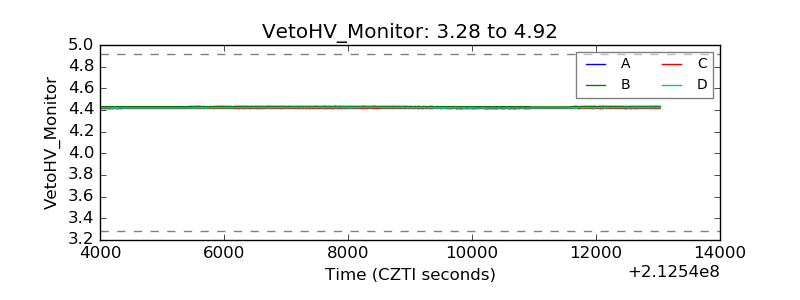 |
| Veto LLD | 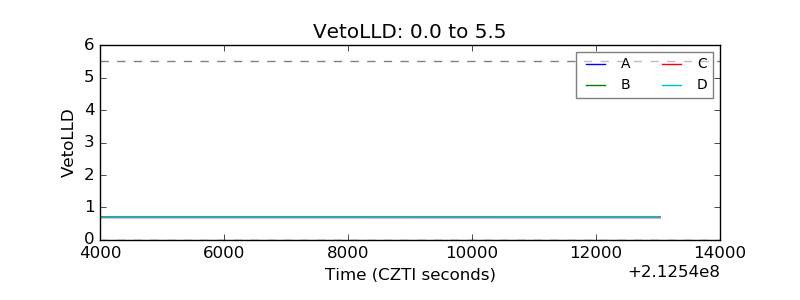 |
| Alpha Counter | 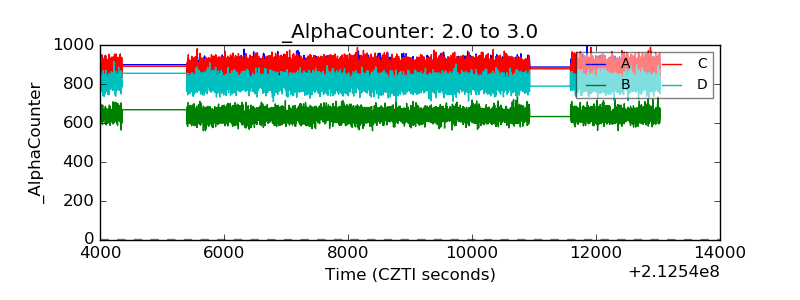 |
| _CPM_Rate | 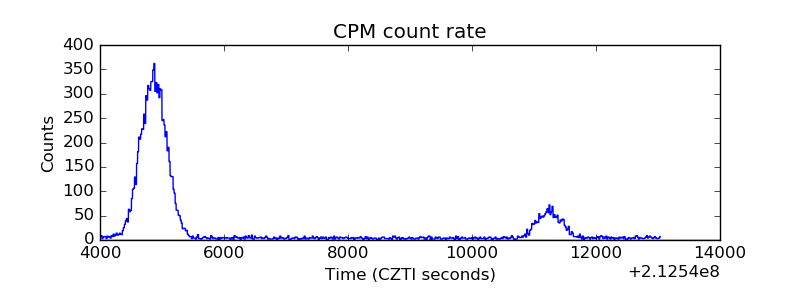 |
| CZT Counter | 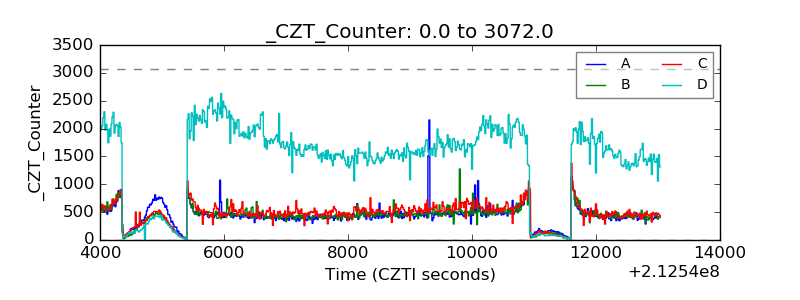 |
| +2.5 Volts monitor |  |
| +5 Volts monitor |  |
| _ROLL_ROT | 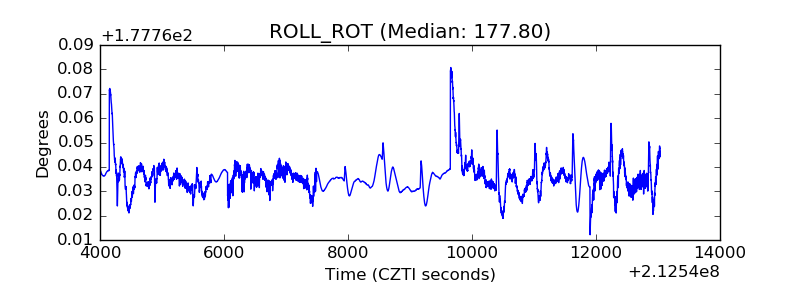 |
| _Roll_DEC | 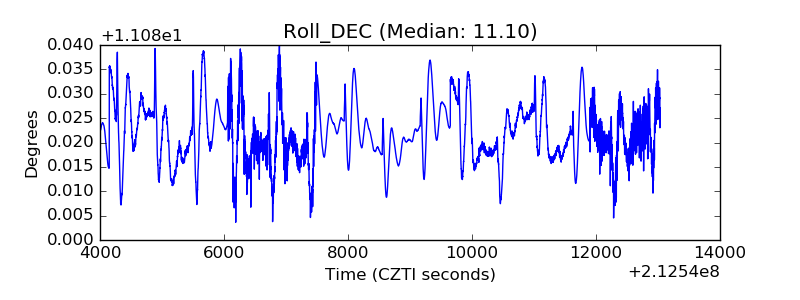 |
| _Roll_RA | 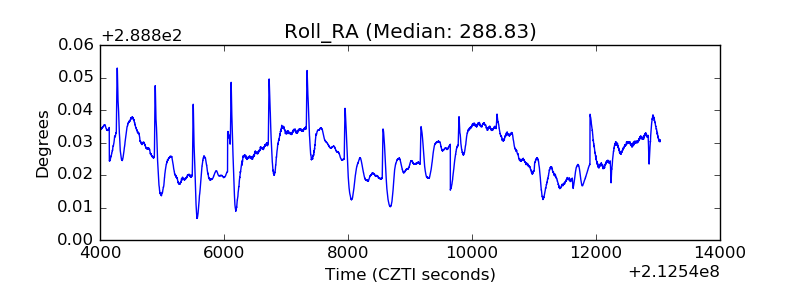 |
| Veto Counter | 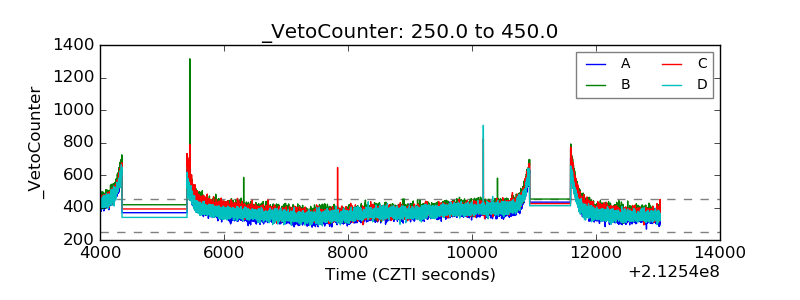 |