| Param | Original file | Final file |
|---|---|---|
| Filename | modeM0/AS1G05_214T01_9000000684_05389cztM0_level2.evt | modeM0/AS1G05_214T01_9000000684_05389cztM0_level2_quad_clean.evt |
| Size (bytes) | 877,092,480 | 73,362,240 |
| Size | 836.5 MB | 70.0 MB |
| Events in quadrant A | 4,078,941 | 423,244 |
| Events in quadrant B | 4,117,836 | 426,199 |
| Events in quadrant C | 4,347,096 | 431,009 |
| Events in quadrant D | 13,466,396 | 370,297 |
| Mode SS | |||
|---|---|---|---|
| Quadrant | BADHDUFLAG | Total packets | Discarded packets |
| A | 0 | 166 | 0 |
| B | 0 | 166 | 0 |
| C | 0 | 166 | 0 |
| D | 0 | 166 | 0 |
| Mode M0 | |||
|---|---|---|---|
| Quadrant | BADHDUFLAG | Total packets | Discarded packets |
| A | 0 | 17866 | 2 |
| B | 0 | 17667 | 1 |
| C | 0 | 17870 | 1 |
| D | 0 | 45810 | 1 |
| Quadrant | Total seconds | Saturated seconds | Saturation percentage |
|---|---|---|---|
| A | 8196 | 418 | 5.100049% |
| B | 8196 | 475 | 5.795510% |
| C | 8196 | 208 | 2.537823% |
| D | 8196 | 1358 | 16.569058% |
Noise dominated data is calculated using 1-second bins in cleaned event files. If a bin has >2000 counts, and if more than 50% of those come from <1% of pixels, then it is considered to be noise-dominated and hence unusable.
| Quadrant | # 1 sec bins | Bins with >0 counts | Bins with >2000 counts | High rate bins dominated by noise | Noise dominated (total time) | Noise dominated (detector-on time) | Marked lightcurve |
|---|---|---|---|---|---|---|---|
| A | 8256 | 8197 | 12 | 12 | 0.15% | 0.15% | 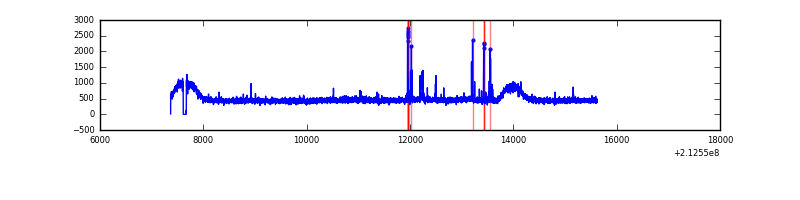 |
| B | 8256 | 8197 | 5 | 5 | 0.06% | 0.06% | 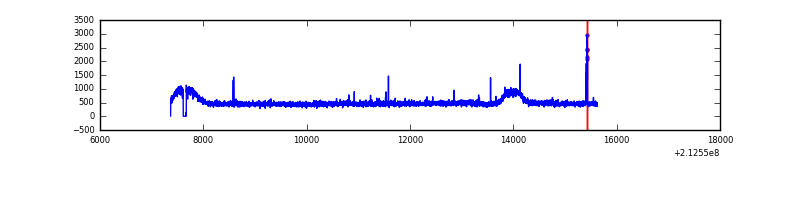 |
| C | 8256 | 8197 | 0 | 0 | 0.00% | 0.00% | 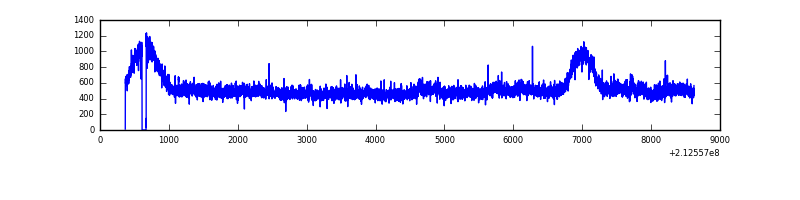 |
| D | 8256 | 8197 | 720 | 720 | 8.72% | 8.78% | 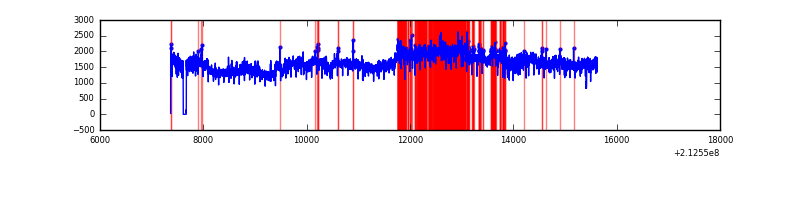 |
Top three noisy pixels from each quadrant. If the there are fewer than three noisy pixels in the level2.evt file, extra rows are filled as -1
| Pixel properties | Quadrant properties | ||||||
|---|---|---|---|---|---|---|---|
| Quadrant | DetID | PixID | Counts | Sigma | Mean | Median | Sigma |
| A | 0 | 50 | 92063 | 419.95 | 1022 | 994 | 216.9 |
| A | 15 | 174 | 38793 | 174.3 | 1022 | 994 | 216.9 |
| A | 13 | 6 | 17408 | 75.69 | 1022 | 994 | 216.9 |
| B | 15 | 204 | 38280 | 181.42 | 1037 | 1008 | 205.4 |
| B | 4 | 48 | 29431 | 138.35 | 1037 | 1008 | 205.4 |
| B | 12 | 111 | 19586 | 90.43 | 1037 | 1008 | 205.4 |
| C | 1 | 16 | 393113 | 1653.2 | 1002 | 1008 | 237.2 |
| C | 8 | 128 | 23315 | 94.05 | 1002 | 1008 | 237.2 |
| C | 8 | 112 | 10308 | 39.21 | 1002 | 1008 | 237.2 |
| D | 7 | 237 | 9683867 | 41140.86 | 945 | 914 | 235.4 |
| D | 2 | 63 | 97693 | 411.19 | 945 | 914 | 235.4 |
| D | 8 | 195 | 46250 | 192.62 | 945 | 914 | 235.4 |
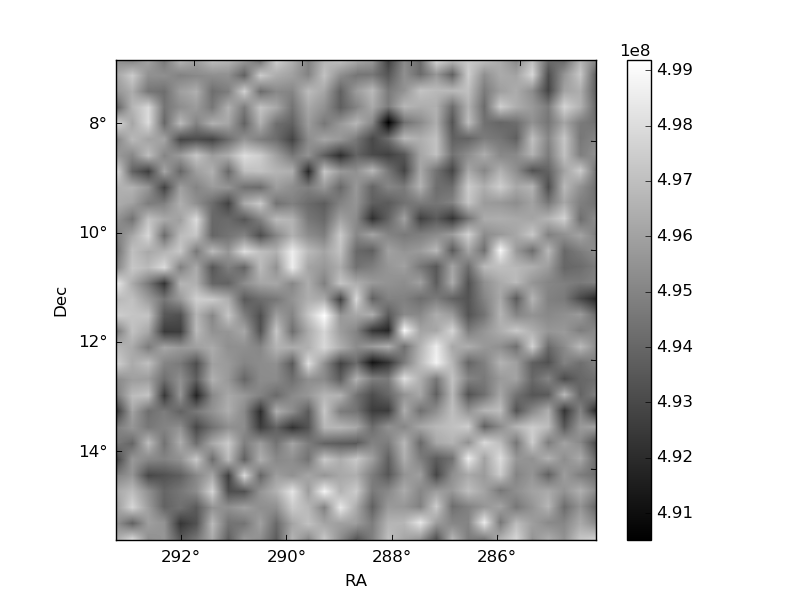
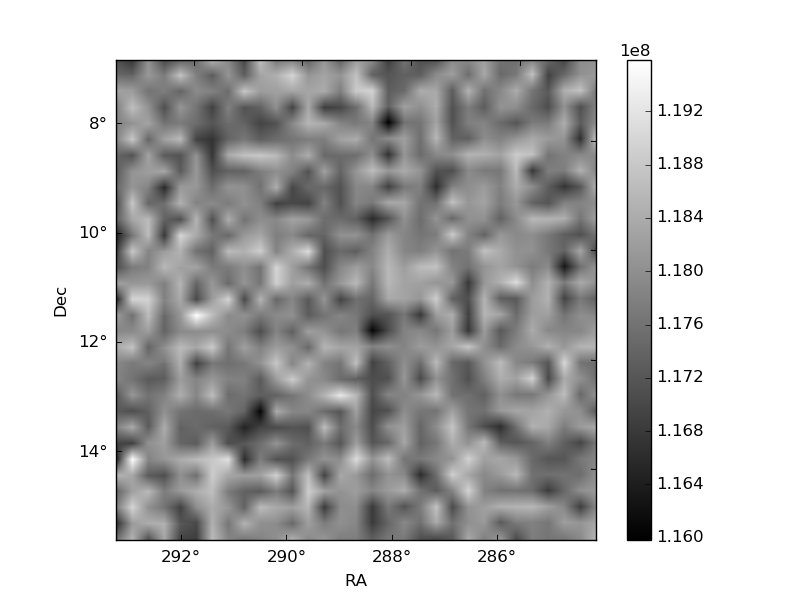
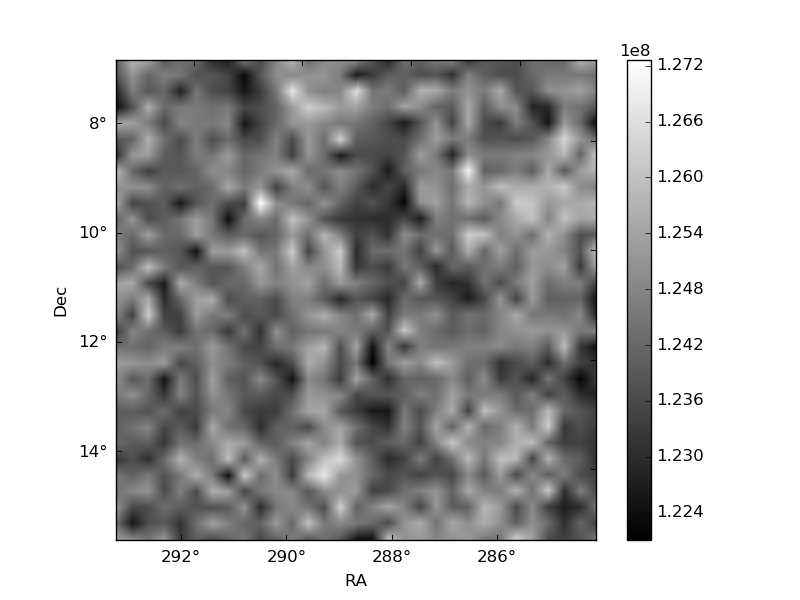
Histogram calculated using DETX and DETY for each event in the final _common_clean file
| Quadrant A | 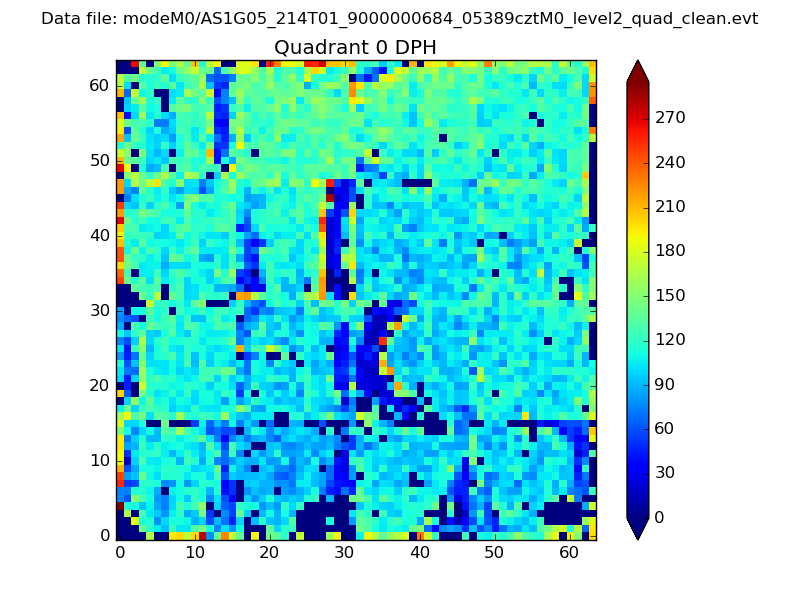 |
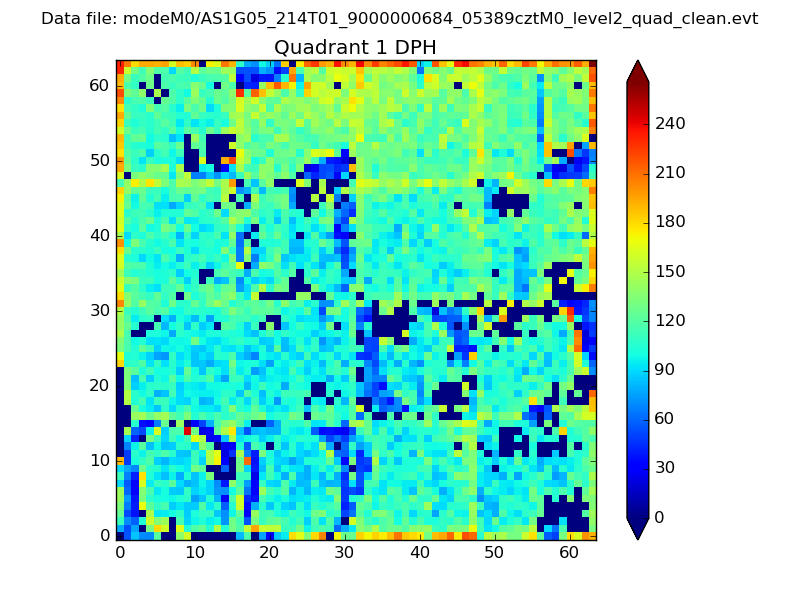 |
Quadrant B |
|---|---|---|---|
| Quadrant D | 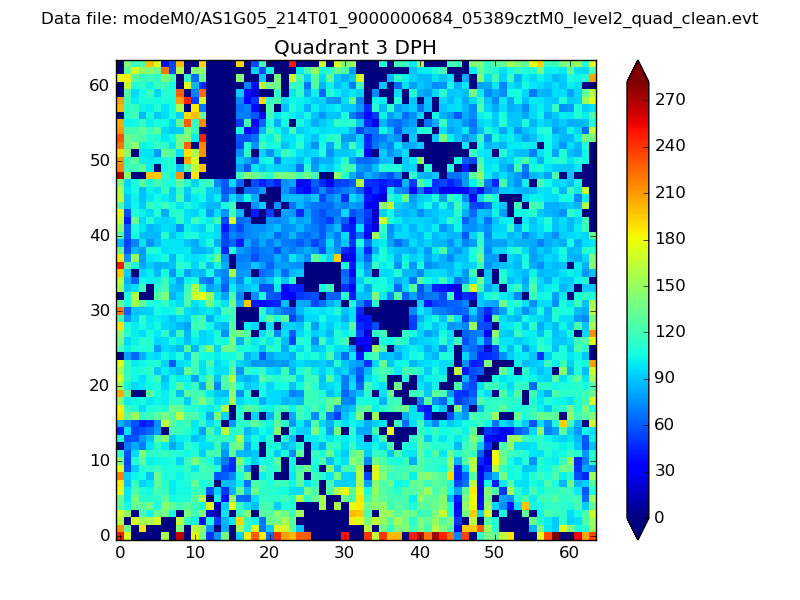 |
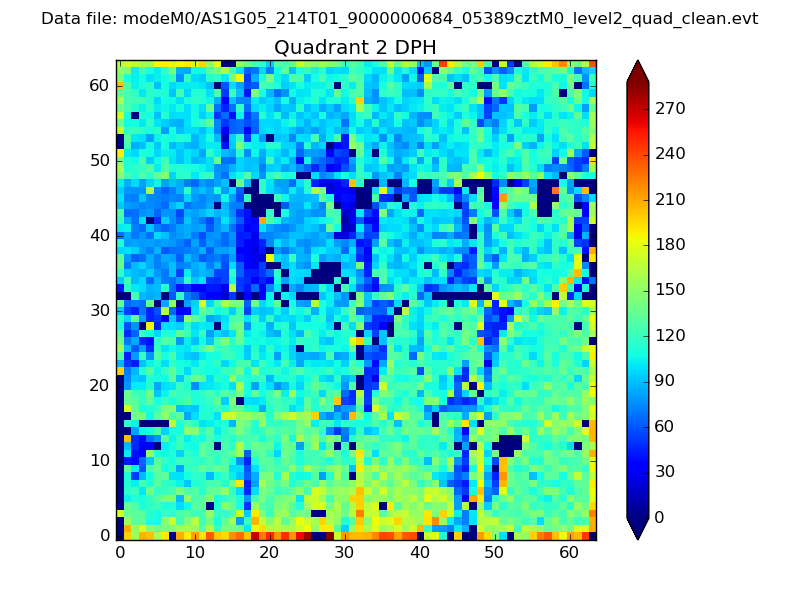 |
Quadrant C |
| Plot type | Count rate plots | Images |
|---|---|---|
| Comparison with Poisson distribution Blue bars denote a histogram of data divided into 1 sec bins. Red curve is a Poisson curve with rate = median count rate of data. |
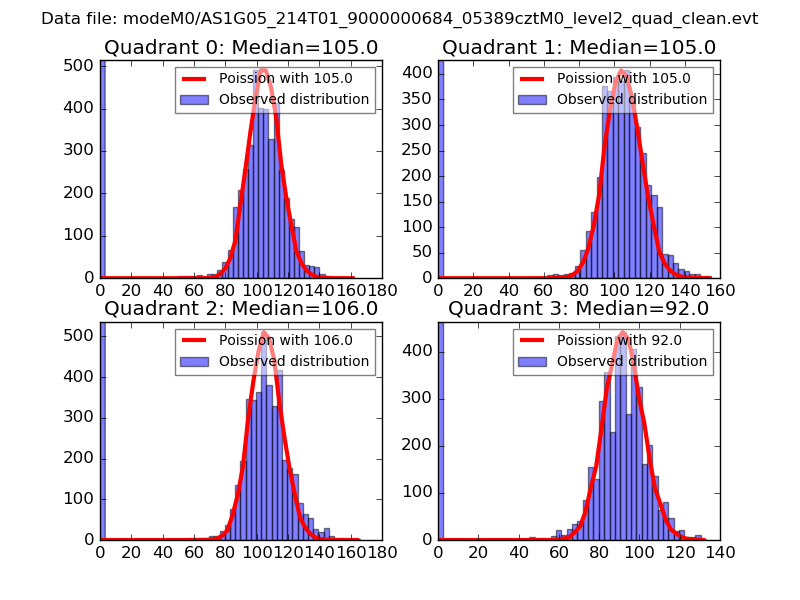 |
 |
| Quadrant-wise count rates Data is divided into 100 sec bins |
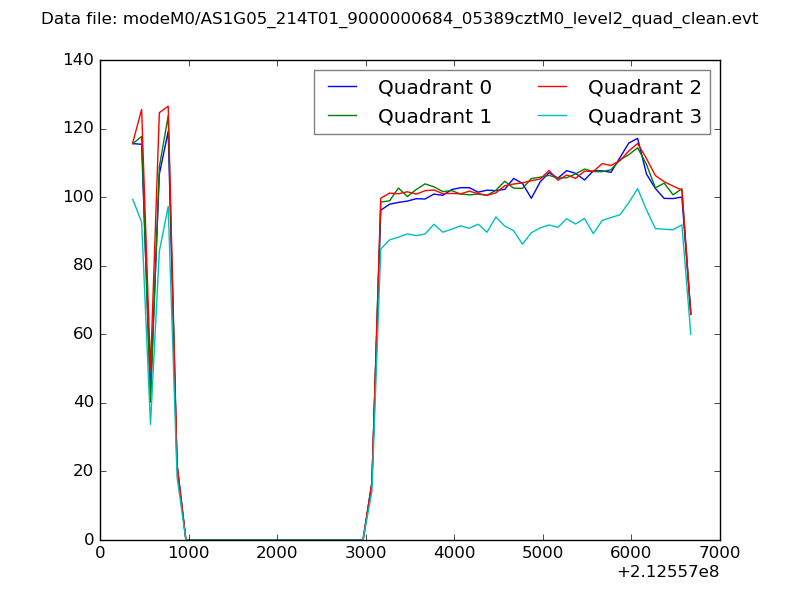 |
|
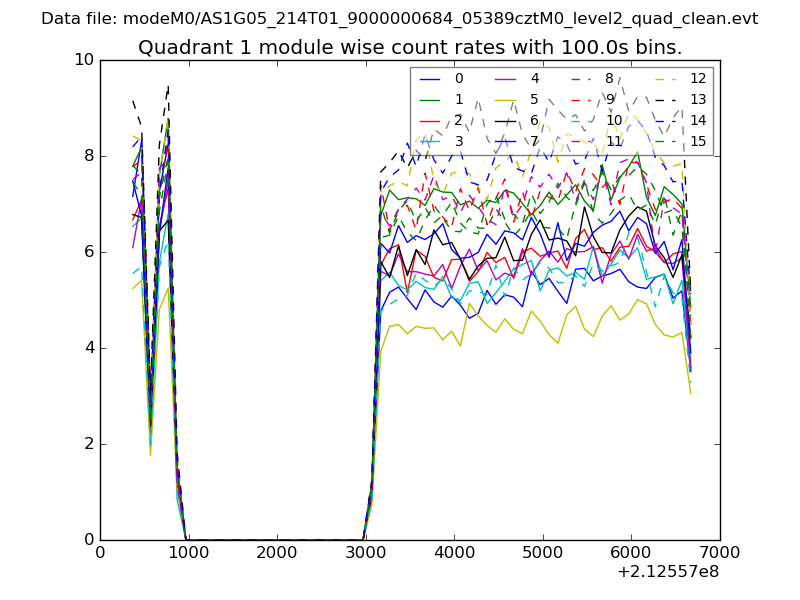
| Module-wise count rates for Quadrant A Data is divided into 100 sec bins |
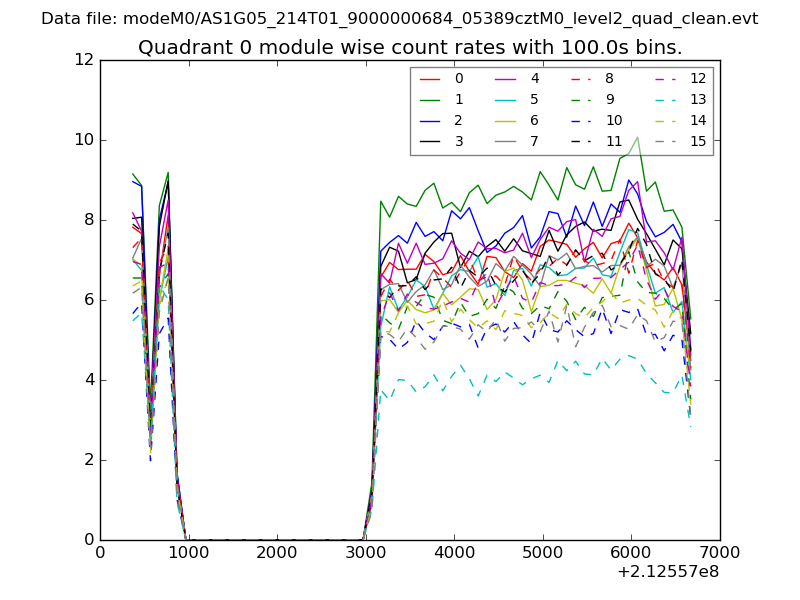 |
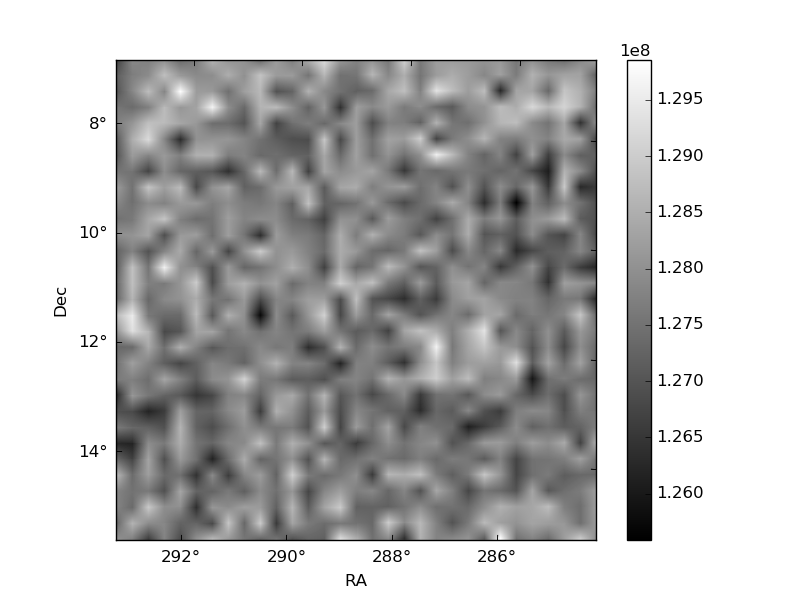 |
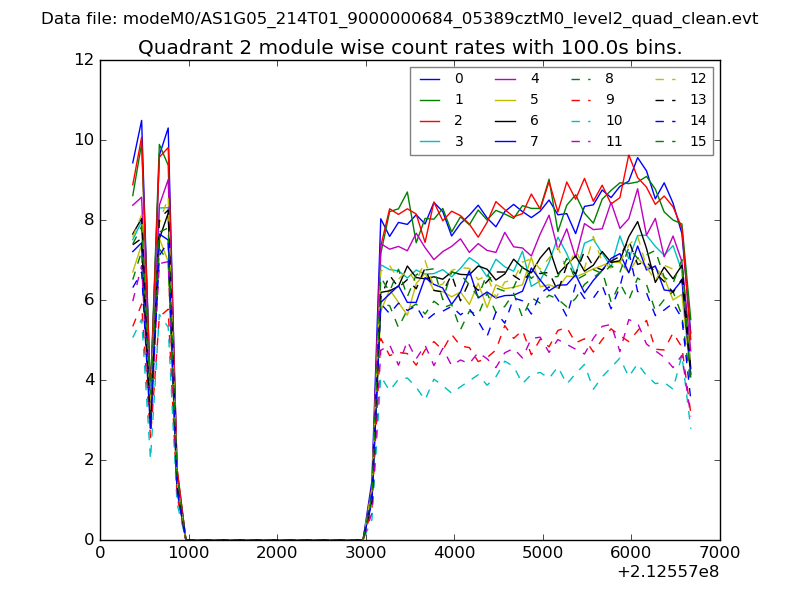
| Module-wise count rates for Quadrant B Data is divided into 100 sec bins |
 |
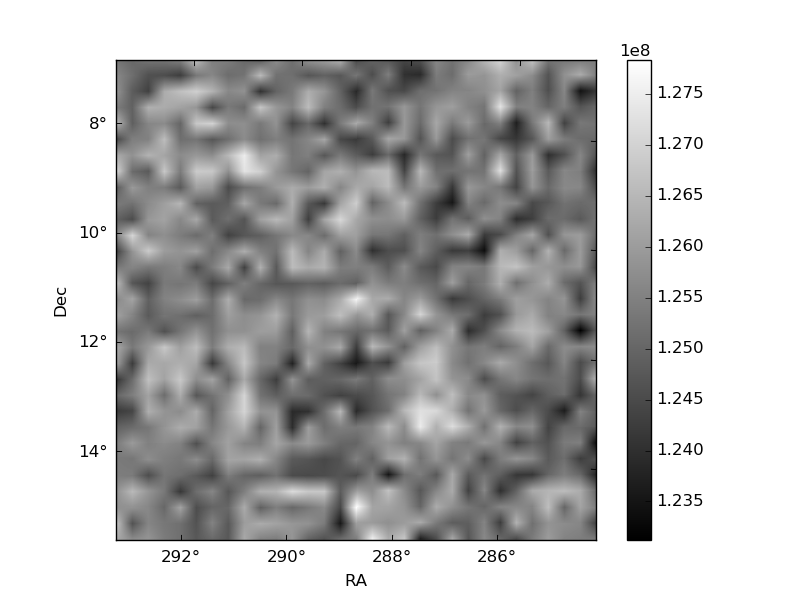 |
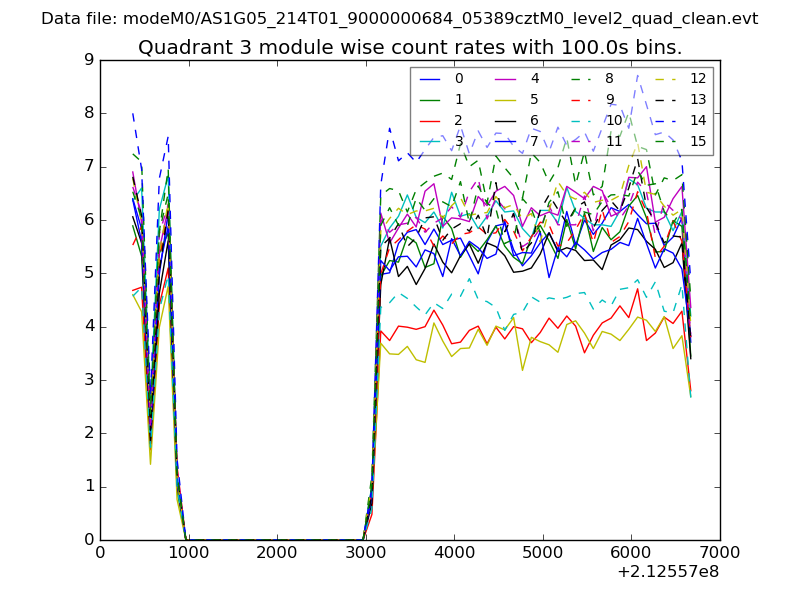
| Module-wise count rates for Quadrant C Data is divided into 100 sec bins |
 |
 |
| Module-wise count rates for Quadrant D Data is divided into 100 sec bins |
 |
 |
| Parameter | Plot |
|---|---|
| CZT HV Monitor | 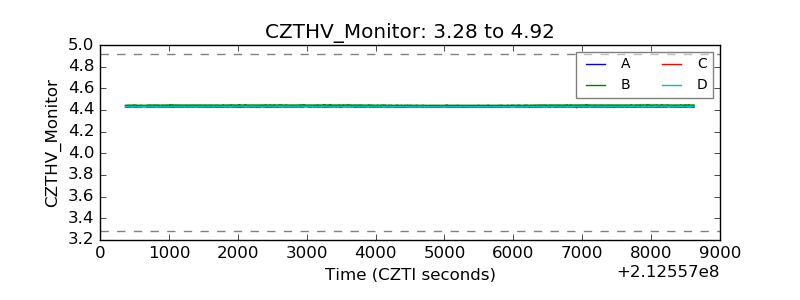 |
| D_VDD | 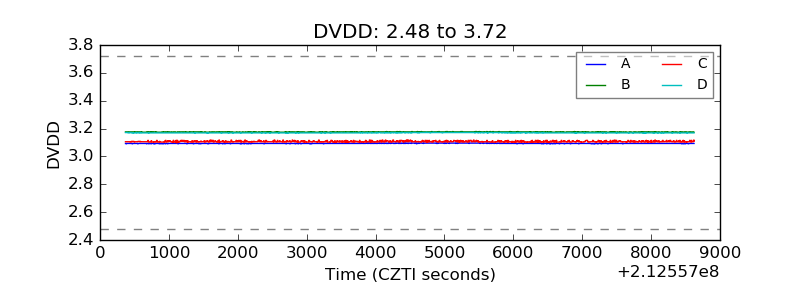 |
| Temperature 1 | 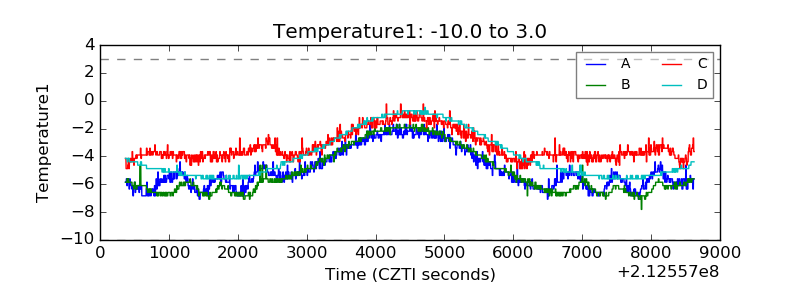 |
| Veto HV Monitor | 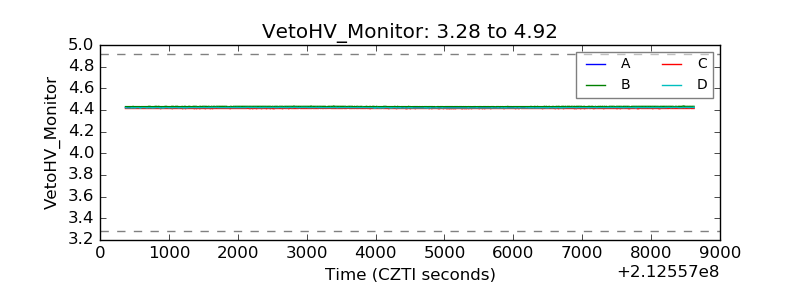 |
| Veto LLD | 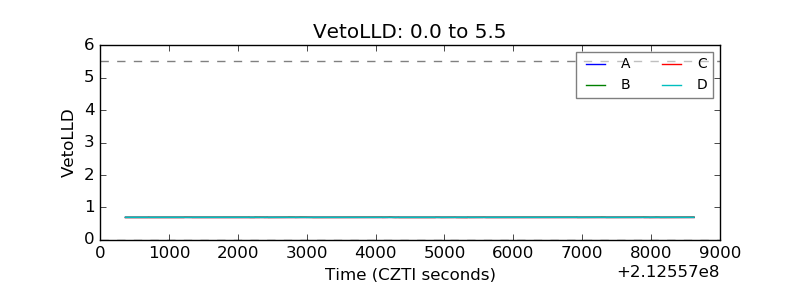 |
| Alpha Counter | 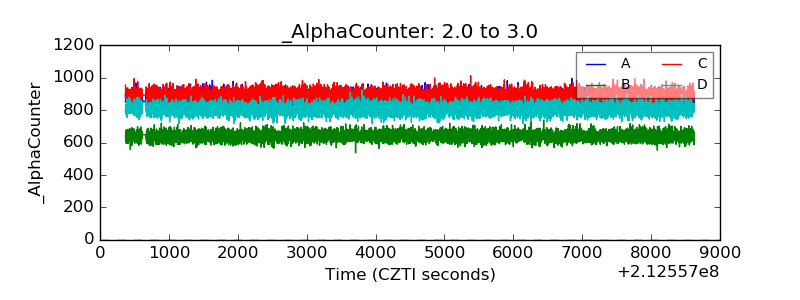 |
| _CPM_Rate | 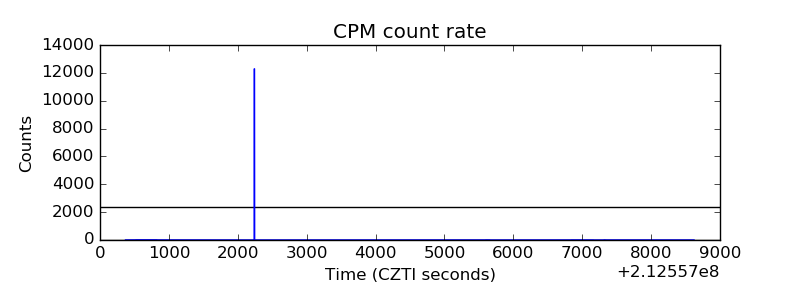 |
| CZT Counter | 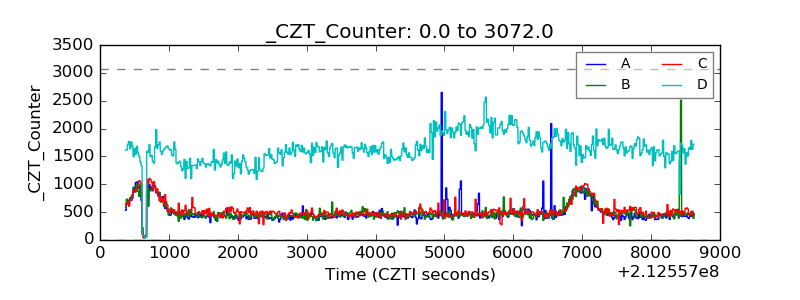 |
| +2.5 Volts monitor |  |
| +5 Volts monitor |  |
| _ROLL_ROT | 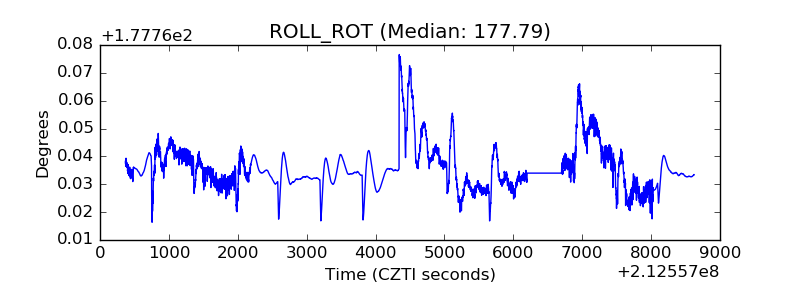 |
| _Roll_DEC | 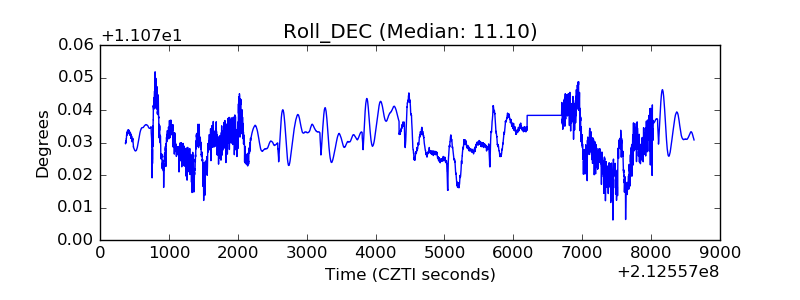 |
| _Roll_RA | 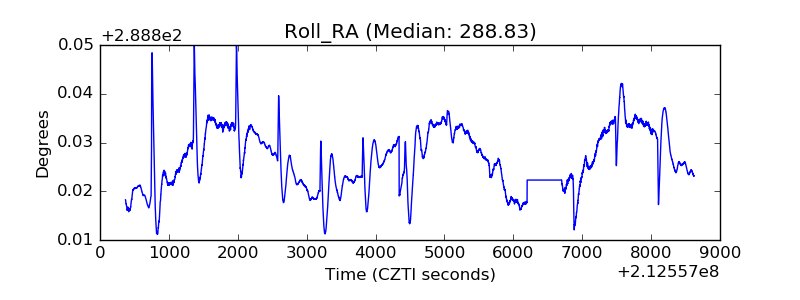 |
| Veto Counter | 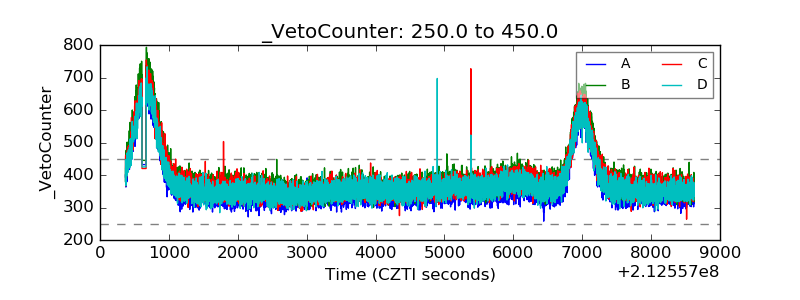 |