| Param | Original file | Final file |
|---|---|---|
| Filename | modeM0/AS1G05_214T01_9000000684_05390cztM0_level2.evt | modeM0/AS1G05_214T01_9000000684_05390cztM0_level2_quad_clean.evt |
| Size (bytes) | 918,210,240 | 69,857,280 |
| Size | 875.7 MB | 66.6 MB |
| Events in quadrant A | 3,973,506 | 399,177 |
| Events in quadrant B | 4,071,001 | 401,859 |
| Events in quadrant C | 4,440,158 | 402,966 |
| Events in quadrant D | 14,770,307 | 339,990 |
| Mode M9 | |||
|---|---|---|---|
| Quadrant | BADHDUFLAG | Total packets | Discarded packets |
| A | 0 | 2 | 0 |
| B | 0 | 2 | 0 |
| C | 0 | 2 | 0 |
| D | 0 | 2 | 0 |
| Mode SS | |||
|---|---|---|---|
| Quadrant | BADHDUFLAG | Total packets | Discarded packets |
| A | 0 | 166 | 0 |
| B | 0 | 166 | 0 |
| C | 0 | 166 | 0 |
| D | 0 | 166 | 0 |
| Mode M0 | |||
|---|---|---|---|
| Quadrant | BADHDUFLAG | Total packets | Discarded packets |
| A | 0 | 17454 | 2 |
| B | 0 | 17421 | 1 |
| C | 0 | 18065 | 1 |
| D | 0 | 49566 | 7 |
| Quadrant | Total seconds | Saturated seconds | Saturation percentage |
|---|---|---|---|
| A | 8212 | 351 | 4.274233% |
| B | 8212 | 389 | 4.736970% |
| C | 8212 | 191 | 2.325865% |
| D | 8211 | 2129 | 25.928632% |
Noise dominated data is calculated using 1-second bins in cleaned event files. If a bin has >2000 counts, and if more than 50% of those come from <1% of pixels, then it is considered to be noise-dominated and hence unusable.
| Quadrant | # 1 sec bins | Bins with >0 counts | Bins with >2000 counts | High rate bins dominated by noise | Noise dominated (total time) | Noise dominated (detector-on time) | Marked lightcurve |
|---|---|---|---|---|---|---|---|
| A | 8432 | 8213 | 14 | 14 | 0.17% | 0.17% | 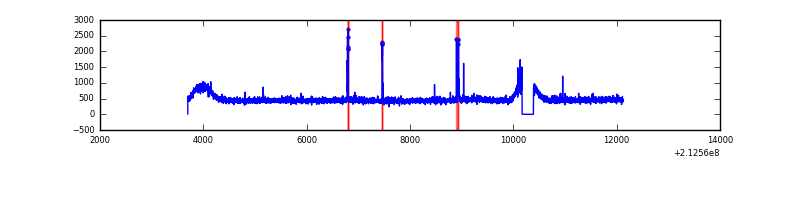 |
| B | 8432 | 8213 | 7 | 7 | 0.08% | 0.09% | 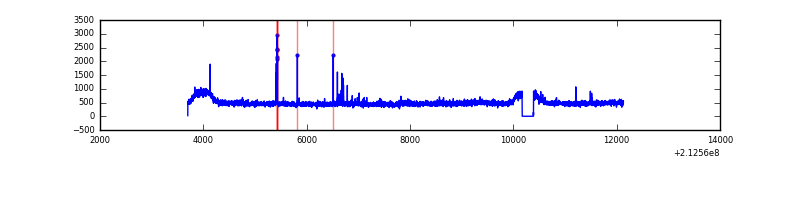 |
| C | 8432 | 8213 | 0 | 0 | 0.00% | 0.00% | 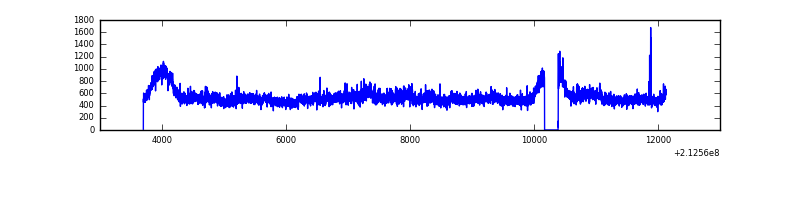 |
| D | 8432 | 8213 | 1837 | 1837 | 21.79% | 22.37% | 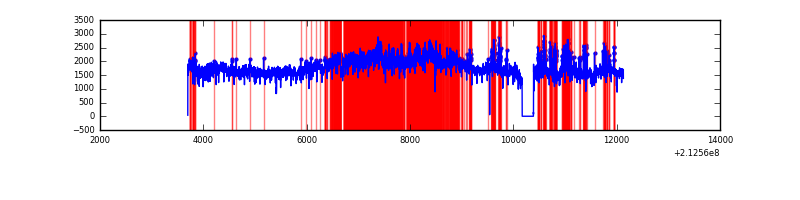 |
Top three noisy pixels from each quadrant. If the there are fewer than three noisy pixels in the level2.evt file, extra rows are filled as -1
| Pixel properties | Quadrant properties | ||||||
|---|---|---|---|---|---|---|---|
| Quadrant | DetID | PixID | Counts | Sigma | Mean | Median | Sigma |
| A | 0 | 50 | 36445 | 169.79 | 1001 | 975 | 208.9 |
| A | 15 | 174 | 34256 | 159.31 | 1001 | 975 | 208.9 |
| A | 0 | 247 | 28863 | 133.5 | 1001 | 975 | 208.9 |
| B | 15 | 204 | 58639 | 289.02 | 1017 | 989 | 199.5 |
| B | 4 | 48 | 30301 | 146.95 | 1017 | 989 | 199.5 |
| B | 0 | 219 | 24531 | 118.02 | 1017 | 989 | 199.5 |
| C | 1 | 16 | 575984 | 2498.11 | 981 | 985 | 230.2 |
| C | 14 | 67 | 11446 | 45.45 | 981 | 985 | 230.2 |
| C | 9 | 247 | 10312 | 40.52 | 981 | 985 | 230.2 |
| D | 7 | 237 | 10471996 | 46121.33 | 909 | 876 | 227.0 |
| D | 4 | 95 | 462994 | 2035.46 | 909 | 876 | 227.0 |
| D | 2 | 33 | 117930 | 515.58 | 909 | 876 | 227.0 |
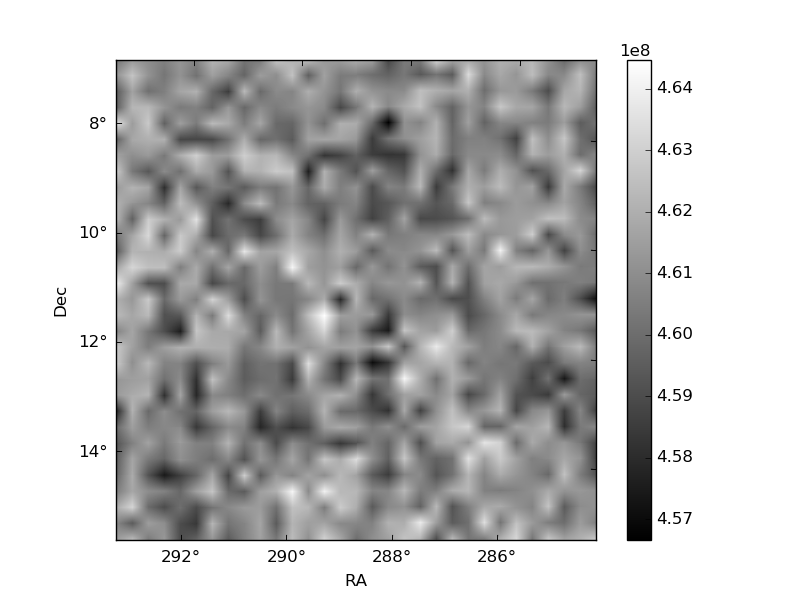
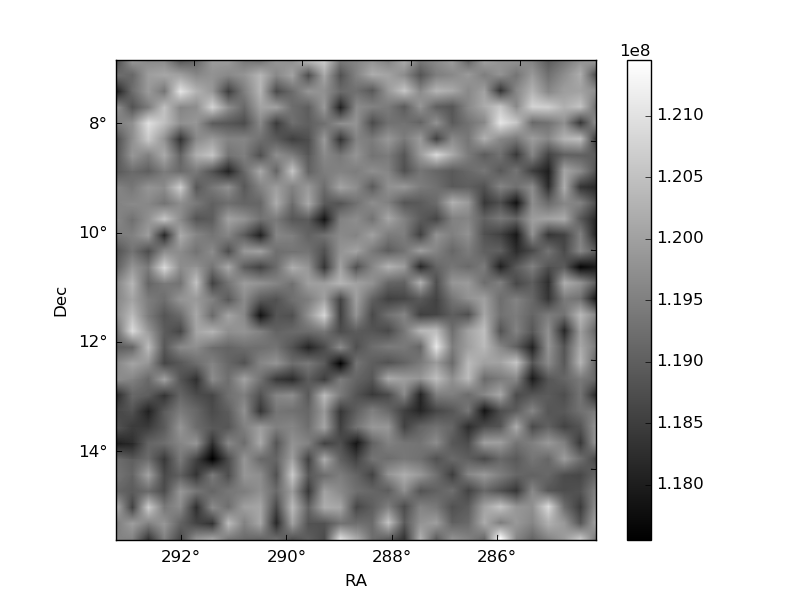
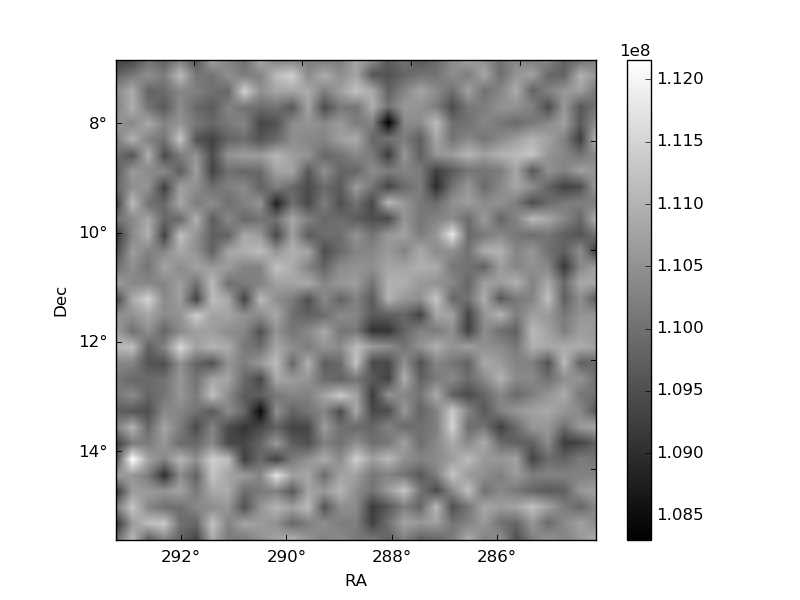
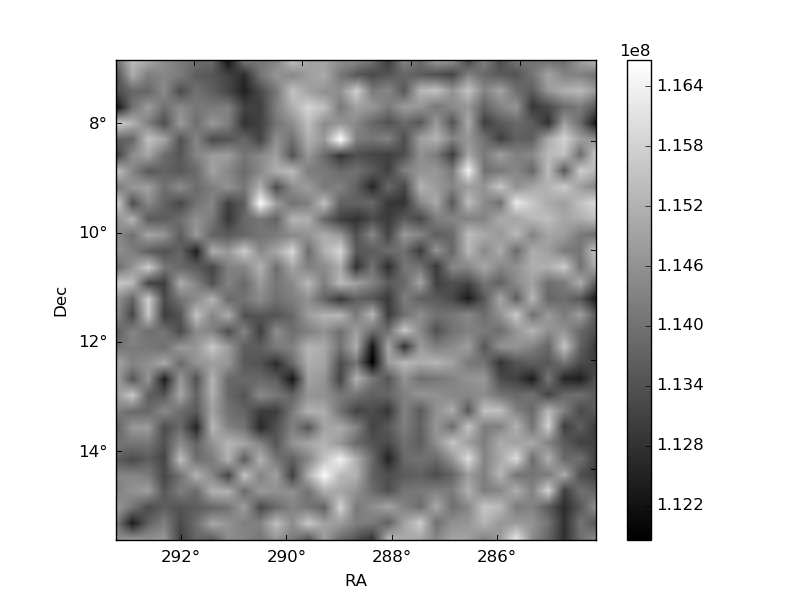
Histogram calculated using DETX and DETY for each event in the final _common_clean file
| Quadrant A | 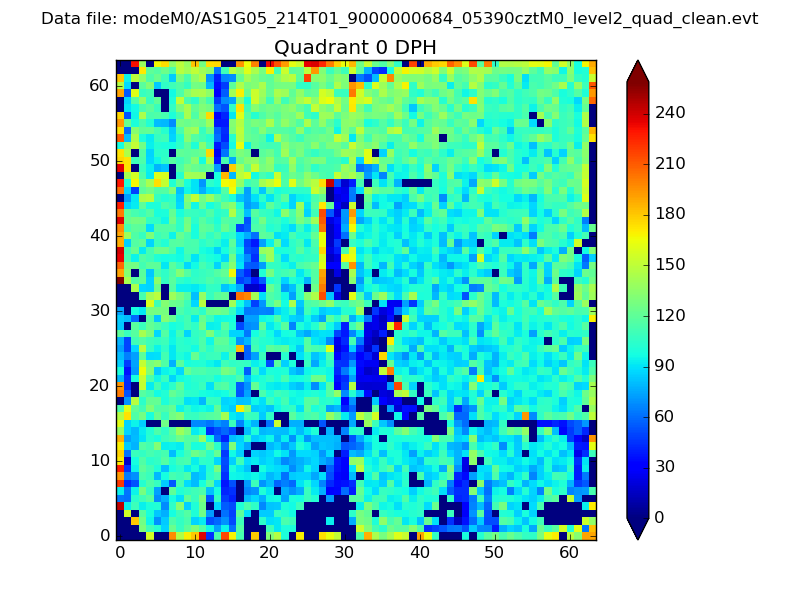 |
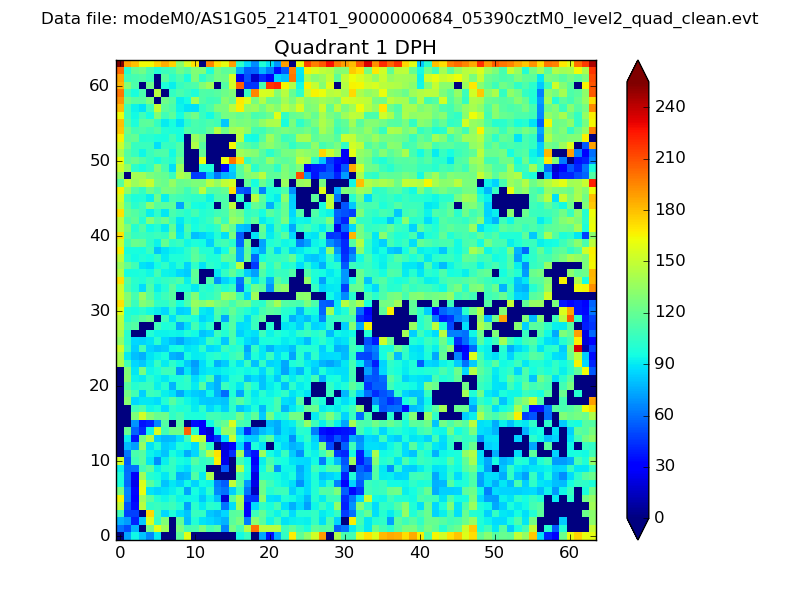 |
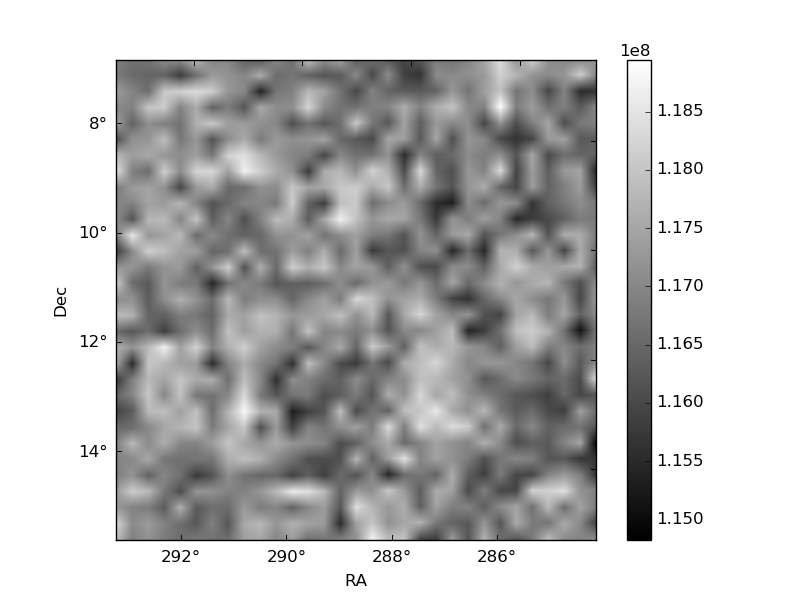
Quadrant B |
|---|---|---|---|
| Quadrant D | 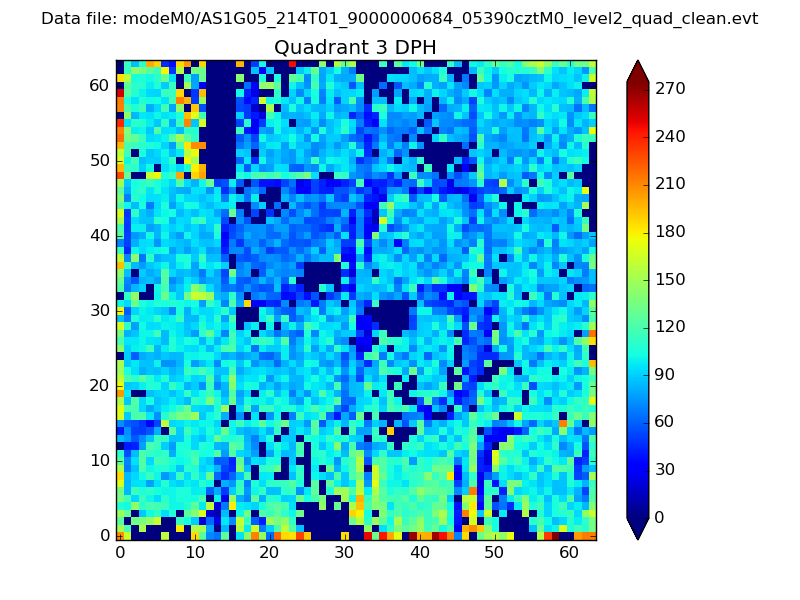 |
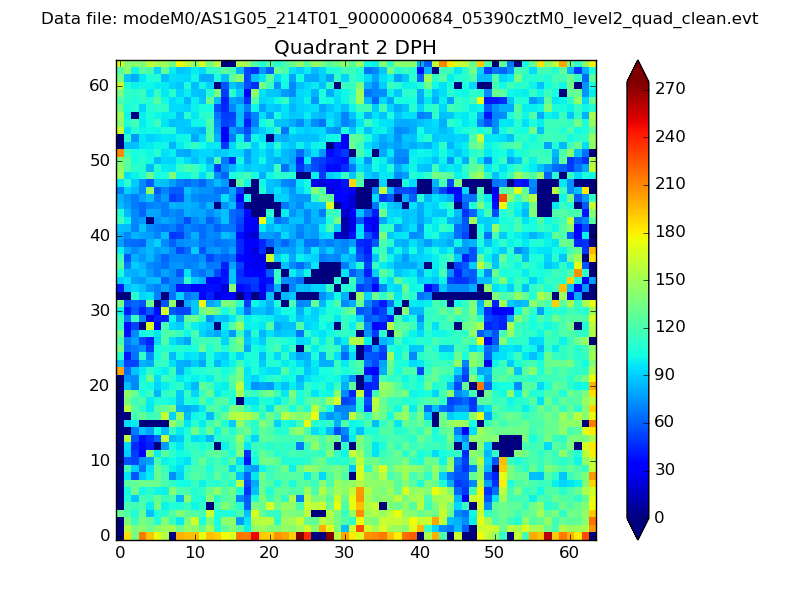 |
Quadrant C |
| Plot type | Count rate plots | Images |
|---|---|---|
| Comparison with Poisson distribution Blue bars denote a histogram of data divided into 1 sec bins. Red curve is a Poisson curve with rate = median count rate of data. |
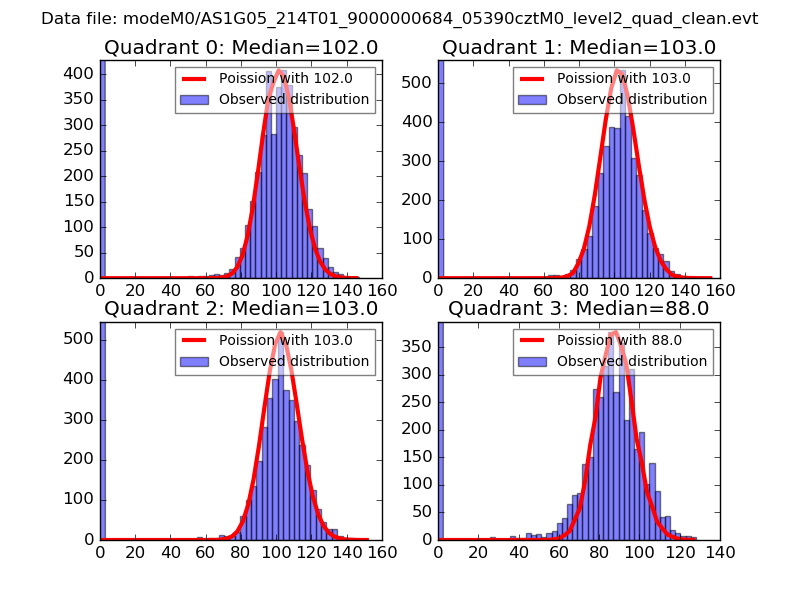 |
 |
| Quadrant-wise count rates Data is divided into 100 sec bins |
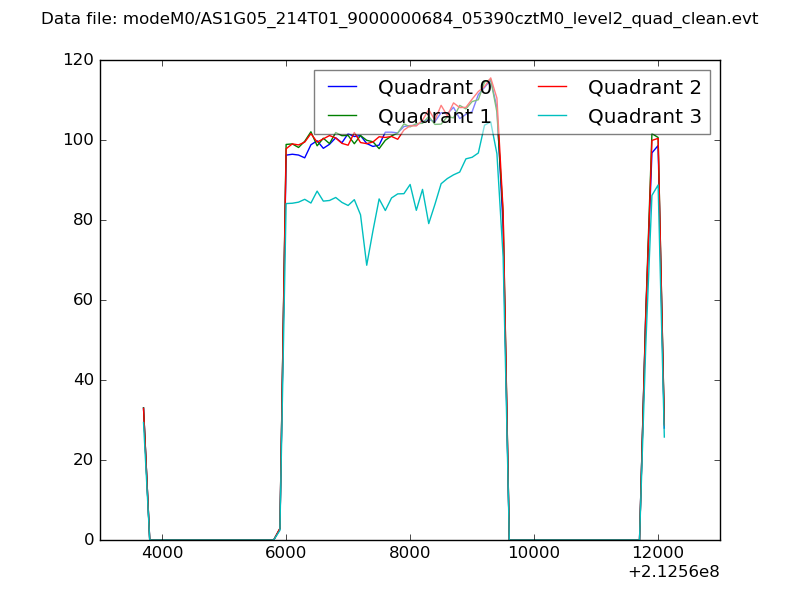 |
|
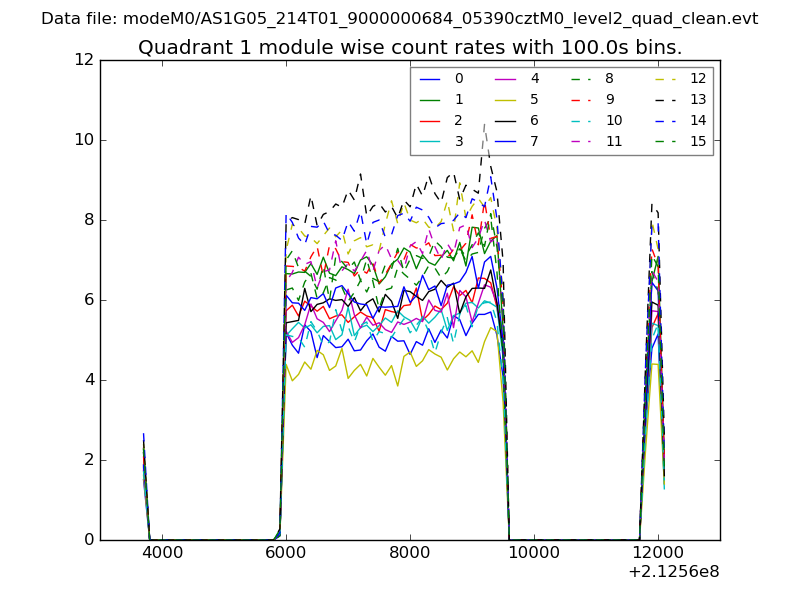
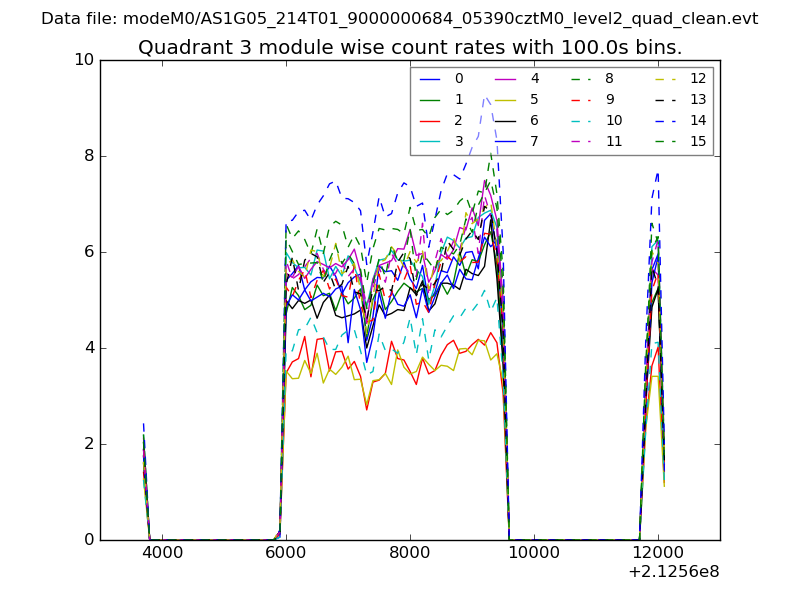
| Module-wise count rates for Quadrant A Data is divided into 100 sec bins |
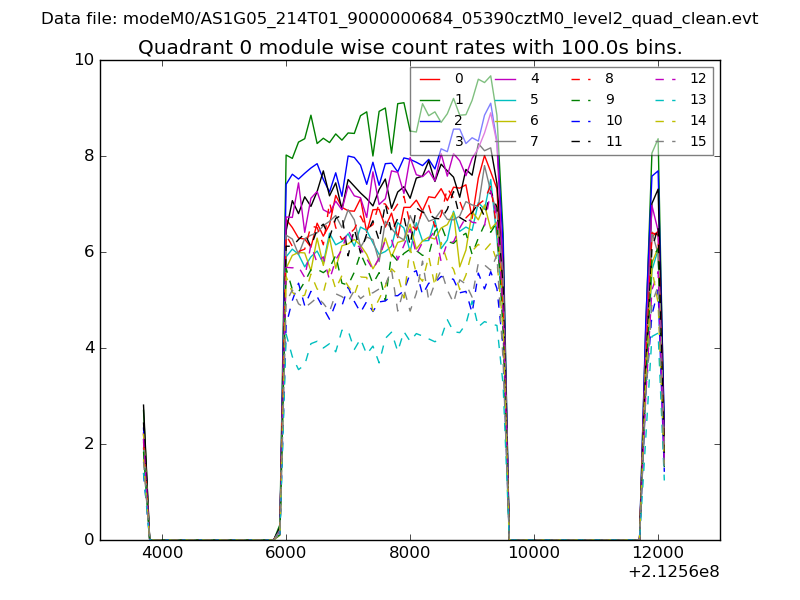 |
 |
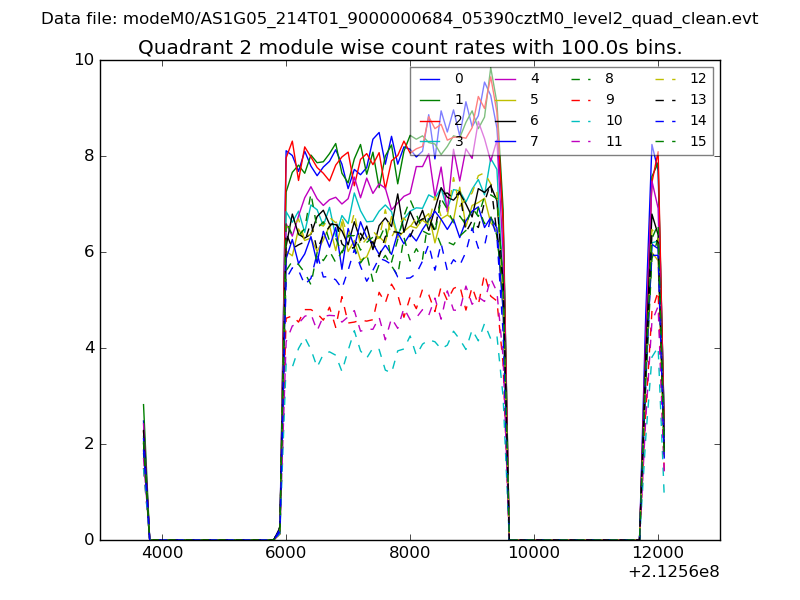
| Module-wise count rates for Quadrant B Data is divided into 100 sec bins |
 |
 |
| Module-wise count rates for Quadrant C Data is divided into 100 sec bins |
 |
 |
| Module-wise count rates for Quadrant D Data is divided into 100 sec bins |
 |
 |
| Parameter | Plot |
|---|---|
| CZT HV Monitor | 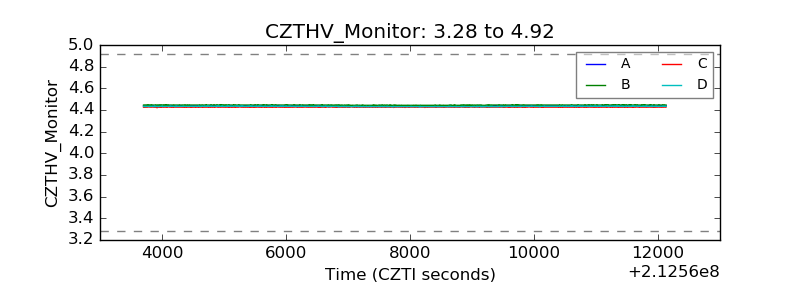 |
| D_VDD | 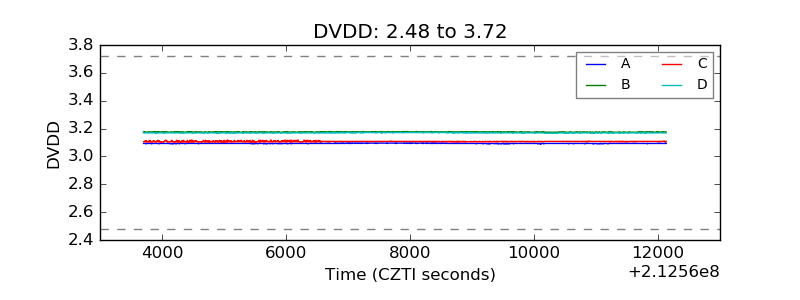 |
| Temperature 1 | 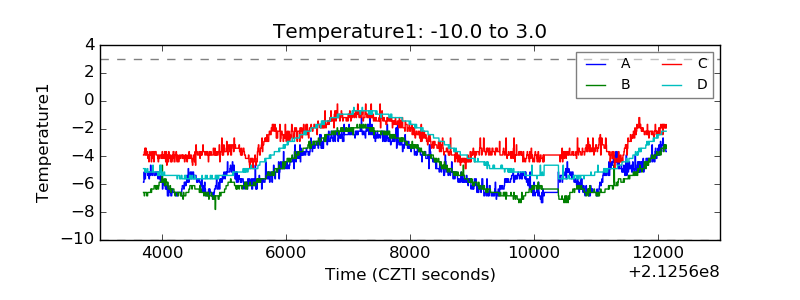 |
| Veto HV Monitor | 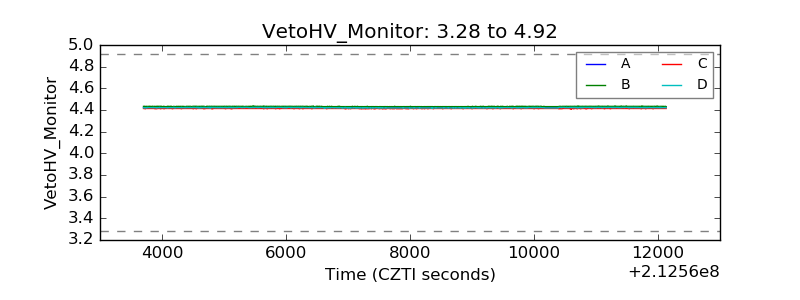 |
| Veto LLD | 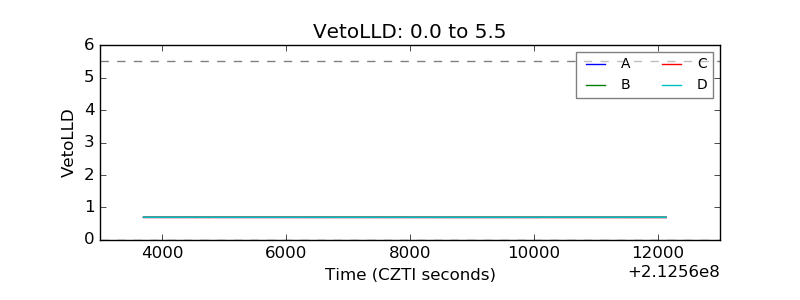 |
| Alpha Counter | 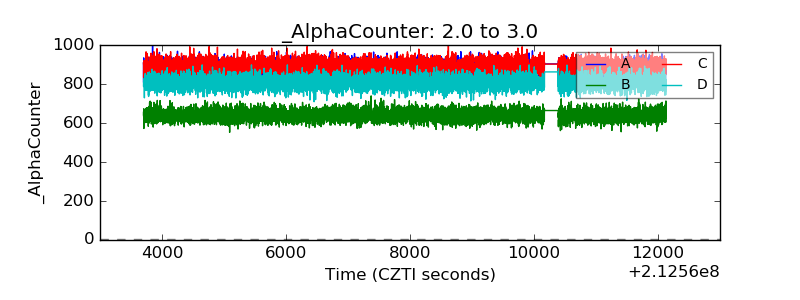 |
| _CPM_Rate | 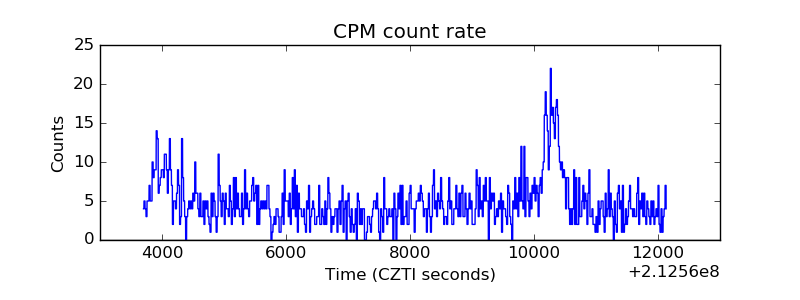 |
| CZT Counter | 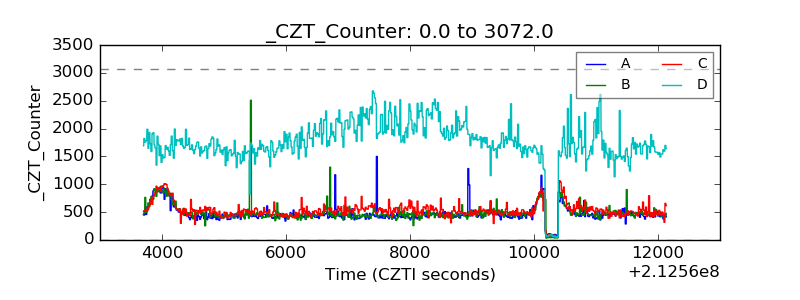 |
| +2.5 Volts monitor |  |
| +5 Volts monitor |  |
| _ROLL_ROT | 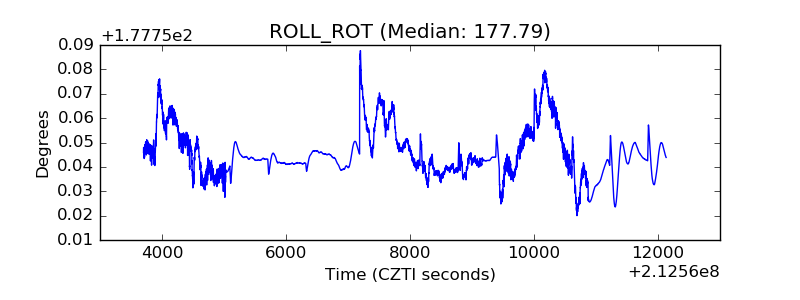 |
| _Roll_DEC | 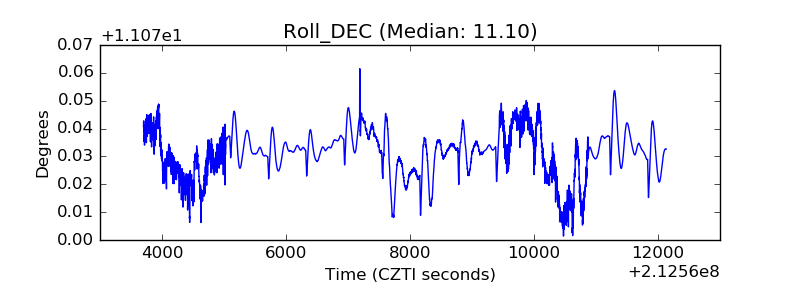 |
| _Roll_RA | 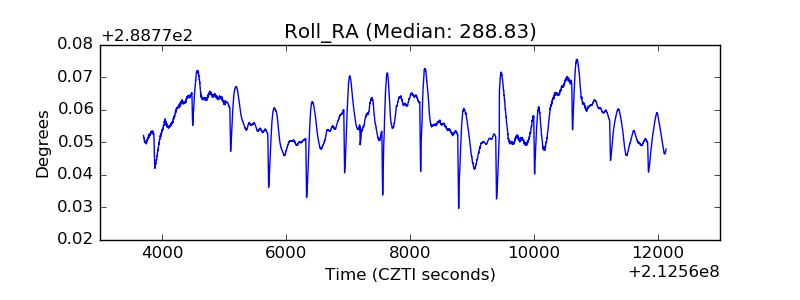 |
| Veto Counter | 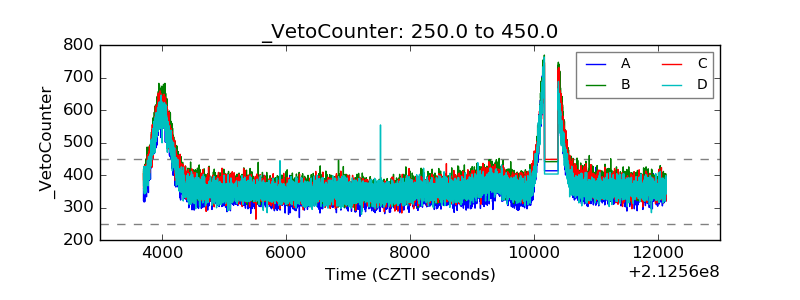 |