| Param | Original file | Final file |
|---|---|---|
| Filename | modeM0/AS1G05_214T01_9000000684_05396cztM0_level2.evt | modeM0/AS1G05_214T01_9000000684_05396cztM0_level2_quad_clean.evt |
| Size (bytes) | 2,450,753,280 | 318,110,400 |
| Size | 2.3 GB | 303.4 MB |
| Events in quadrant A | 13,064,807 | 1,973,362 |
| Events in quadrant B | 13,890,149 | 1,970,883 |
| Events in quadrant C | 15,560,691 | 1,970,667 |
| Events in quadrant D | 29,802,831 | 1,775,111 |
| Mode M9 | |||
|---|---|---|---|
| Quadrant | BADHDUFLAG | Total packets | Discarded packets |
| A | 0 | 40 | 0 |
| B | 0 | 40 | 0 |
| C | 0 | 40 | 0 |
| D | 0 | 40 | 0 |
| Mode SS | |||
|---|---|---|---|
| Quadrant | BADHDUFLAG | Total packets | Discarded packets |
| A | 0 | 578 | 0 |
| B | 0 | 578 | 0 |
| C | 0 | 578 | 0 |
| D | 0 | 578 | 0 |
| Mode M0 | |||
|---|---|---|---|
| Quadrant | BADHDUFLAG | Total packets | Discarded packets |
| A | 0 | 58596 | 6 |
| B | 0 | 59694 | 5 |
| C | 0 | 63997 | 5 |
| D | 0 | 108515 | 6 |
| Quadrant | Total seconds | Saturated seconds | Saturation percentage |
|---|---|---|---|
| A | 28271 | 384 | 1.358282% |
| B | 28271 | 414 | 1.464398% |
| C | 28271 | 347 | 1.227406% |
| D | 28247 | 2973 | 10.525012% |
Noise dominated data is calculated using 1-second bins in cleaned event files. If a bin has >2000 counts, and if more than 50% of those come from <1% of pixels, then it is considered to be noise-dominated and hence unusable.
| Quadrant | # 1 sec bins | Bins with >0 counts | Bins with >2000 counts | High rate bins dominated by noise | Noise dominated (total time) | Noise dominated (detector-on time) | Marked lightcurve |
|---|---|---|---|---|---|---|---|
| A | 32396 | 28277 | 15 | 15 | 0.05% | 0.05% | 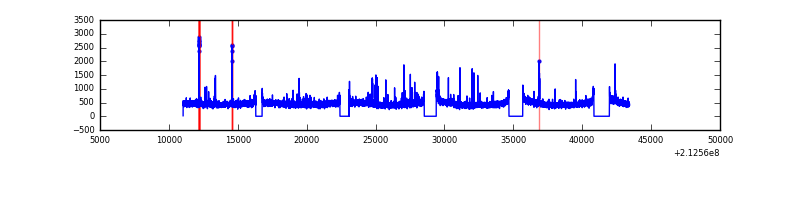 |
| B | 32396 | 28277 | 59 | 59 | 0.18% | 0.21% | 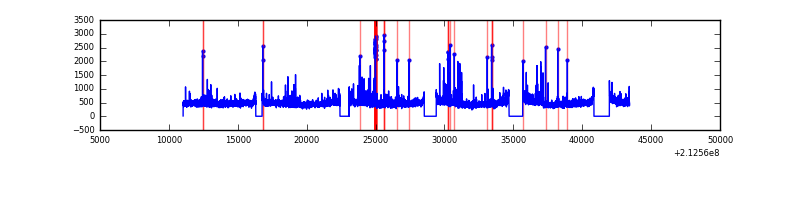 |
| C | 32396 | 28277 | 23 | 23 | 0.07% | 0.08% | 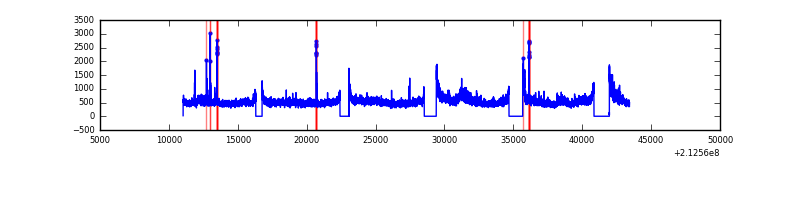 |
| D | 32396 | 28253 | 2527 | 2527 | 7.80% | 8.94% | 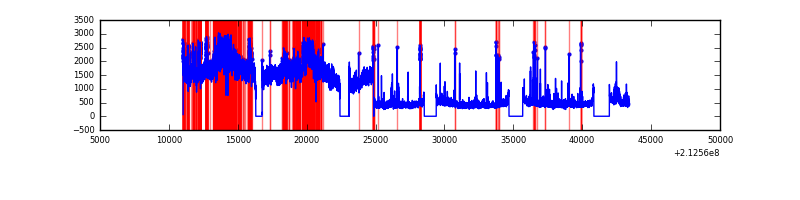 |
Top three noisy pixels from each quadrant. If the there are fewer than three noisy pixels in the level2.evt file, extra rows are filled as -1
| Pixel properties | Quadrant properties | ||||||
|---|---|---|---|---|---|---|---|
| Quadrant | DetID | PixID | Counts | Sigma | Mean | Median | Sigma |
| A | 0 | 50 | 170710 | 249.64 | 3298 | 3225 | 670.9 |
| A | 4 | 2 | 74824 | 106.72 | 3298 | 3225 | 670.9 |
| A | 13 | 6 | 55199 | 77.47 | 3298 | 3225 | 670.9 |
| B | 15 | 204 | 304327 | 476.11 | 3327 | 3249 | 632.4 |
| B | 4 | 81 | 197947 | 307.89 | 3327 | 3249 | 632.4 |
| B | 4 | 48 | 143615 | 221.97 | 3327 | 3249 | 632.4 |
| C | 1 | 16 | 2887866 | 3896.02 | 3209 | 3228 | 740.4 |
| C | 9 | 247 | 131227 | 172.88 | 3209 | 3228 | 740.4 |
| C | 13 | 61 | 25890 | 30.61 | 3209 | 3228 | 740.4 |
| D | 7 | 237 | 14622297 | 19171.04 | 3118 | 3017 | 762.6 |
| D | 2 | 63 | 1176742 | 1539.17 | 3118 | 3017 | 762.6 |
| D | 7 | 203 | 787043 | 1028.13 | 3118 | 3017 | 762.6 |
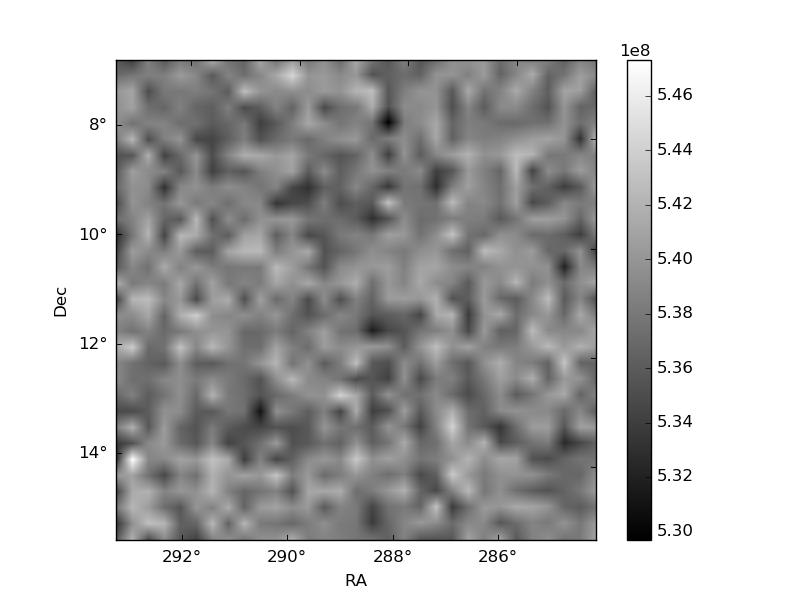
Histogram calculated using DETX and DETY for each event in the final _common_clean file
| Quadrant A | 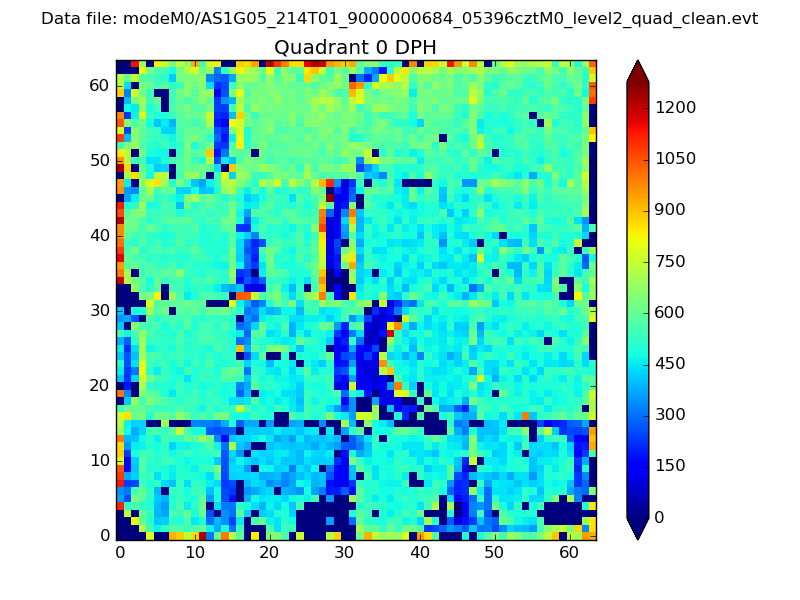 |
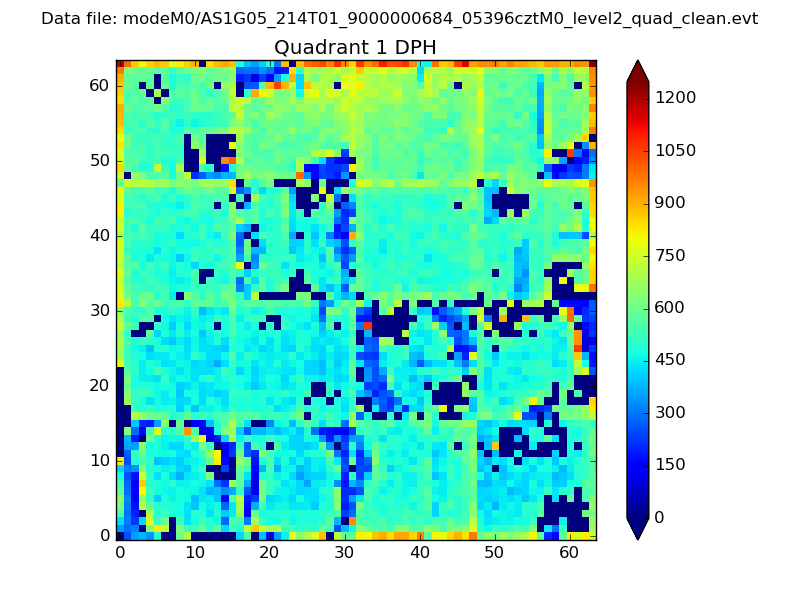 |
Quadrant B |
|---|---|---|---|
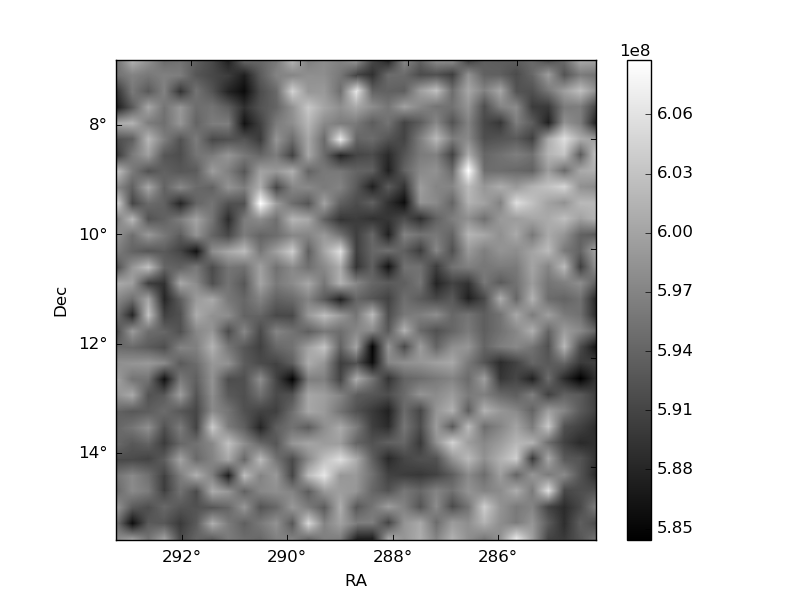
| Quadrant D |  |
 |
Quadrant C |
| Plot type | Count rate plots | Images |
|---|---|---|
| Comparison with Poisson distribution Blue bars denote a histogram of data divided into 1 sec bins. Red curve is a Poisson curve with rate = median count rate of data. |
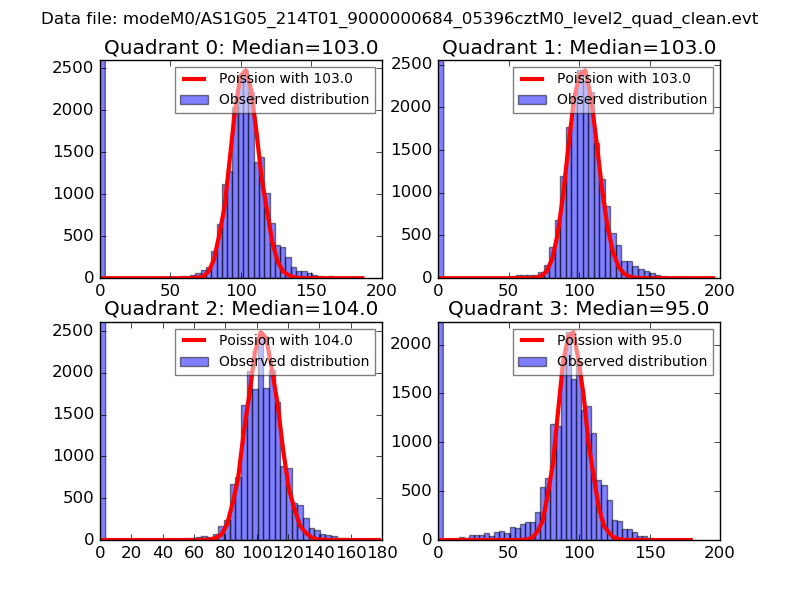 |
 |
| Quadrant-wise count rates Data is divided into 100 sec bins |
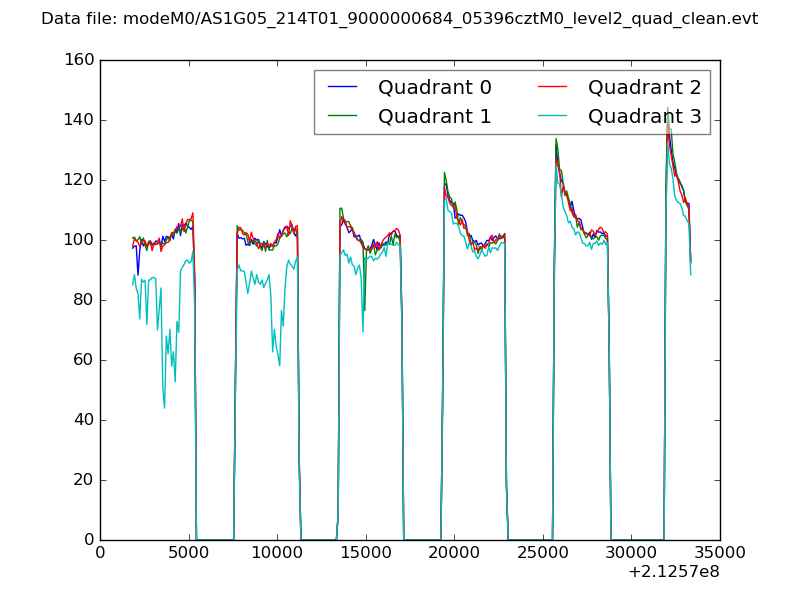 |
|
| Module-wise count rates for Quadrant A Data is divided into 100 sec bins |
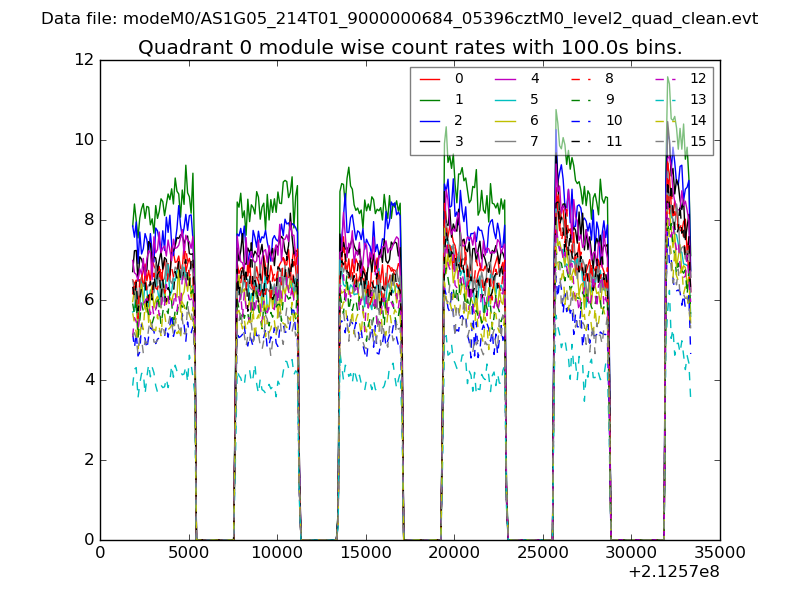 |
 |
| Module-wise count rates for Quadrant B Data is divided into 100 sec bins |
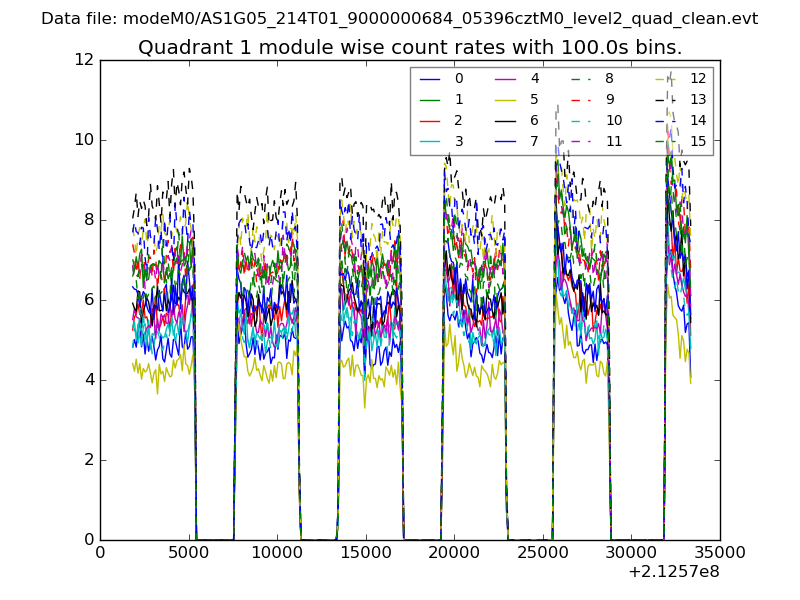 |
 |
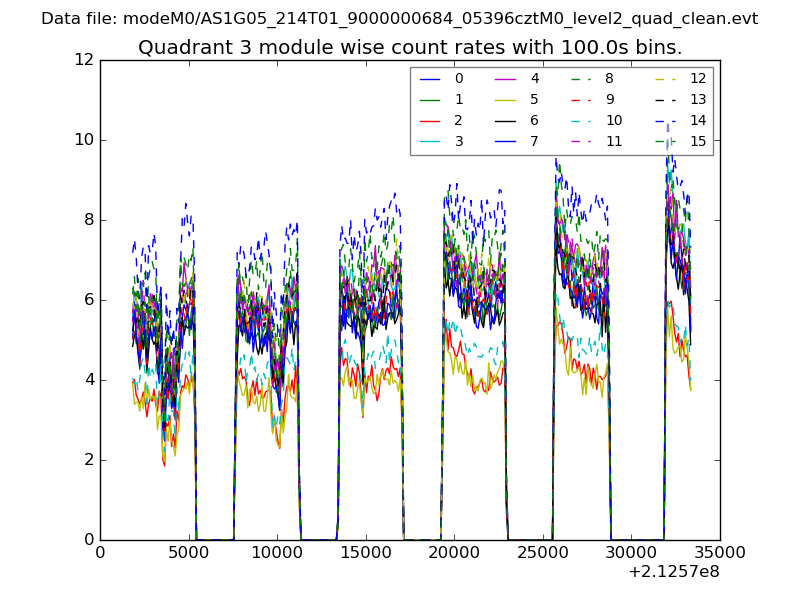
| Module-wise count rates for Quadrant C Data is divided into 100 sec bins |
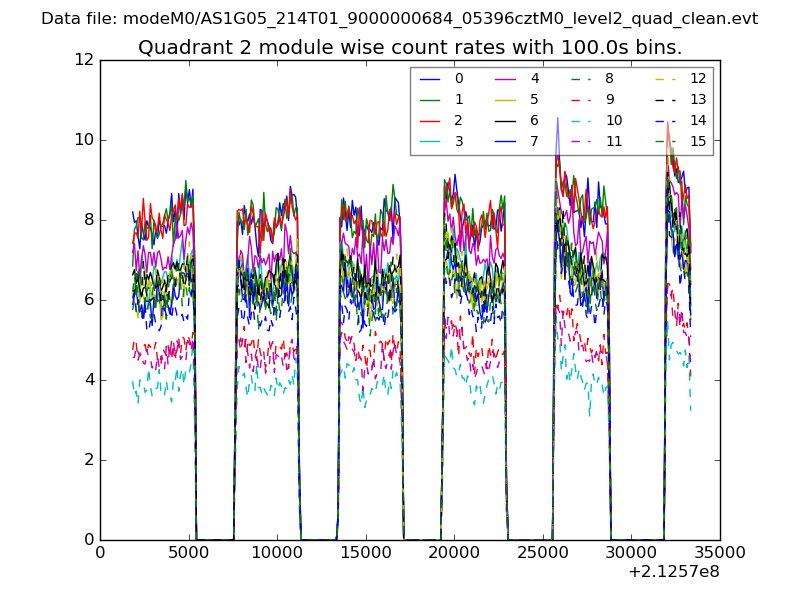 |
 |
| Module-wise count rates for Quadrant D Data is divided into 100 sec bins |
 |
 |
| Parameter | Plot |
|---|---|
| CZT HV Monitor | 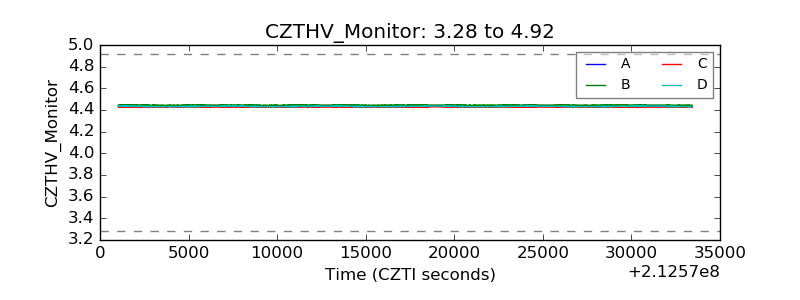 |
| D_VDD |  |
| Temperature 1 | 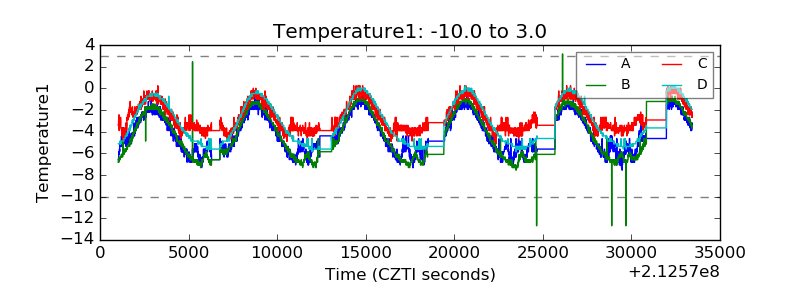 |
| Veto HV Monitor | 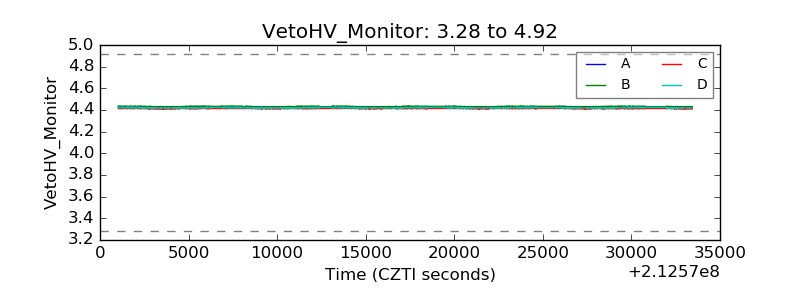 |
| Veto LLD | 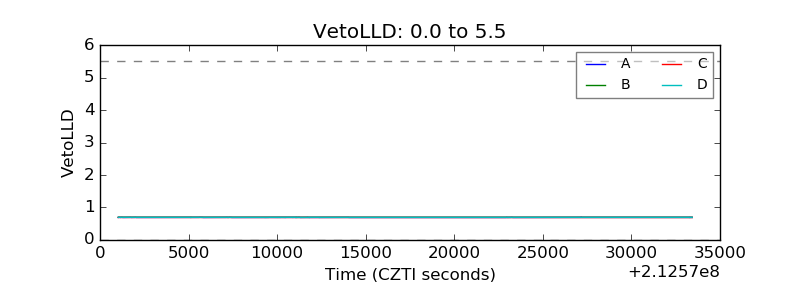 |
| Alpha Counter | 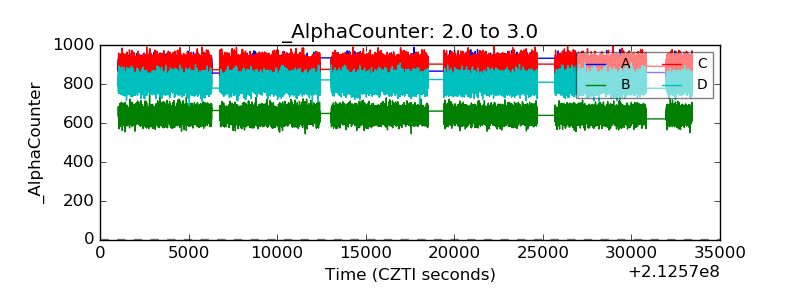 |
| _CPM_Rate | 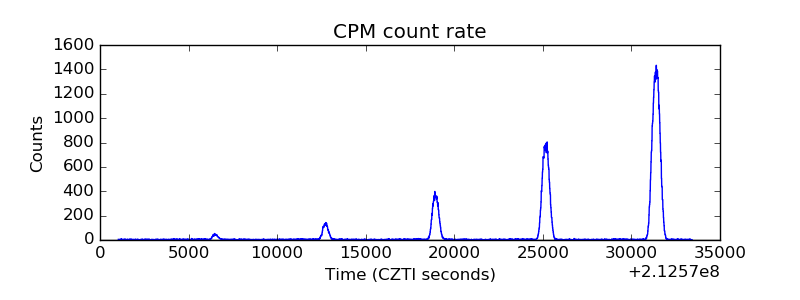 |
| CZT Counter |  |
| +2.5 Volts monitor |  |
| +5 Volts monitor |  |
| _ROLL_ROT | 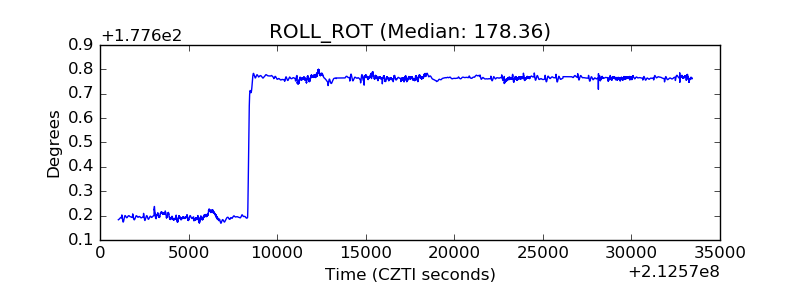 |
| _Roll_DEC | 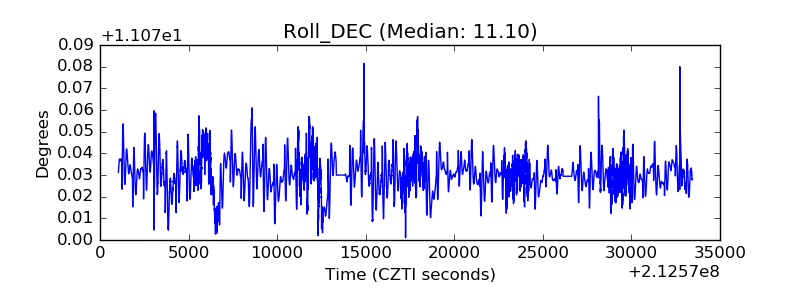 |
| _Roll_RA | 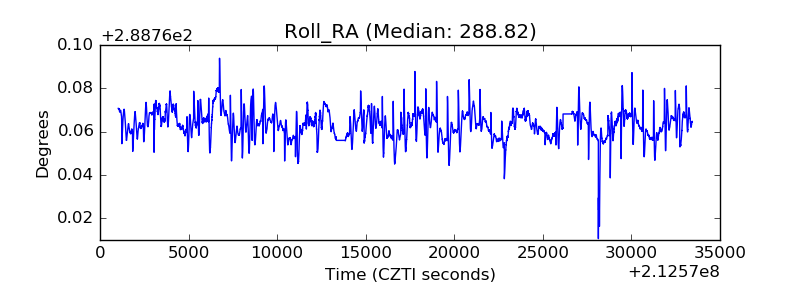 |
| Veto Counter | 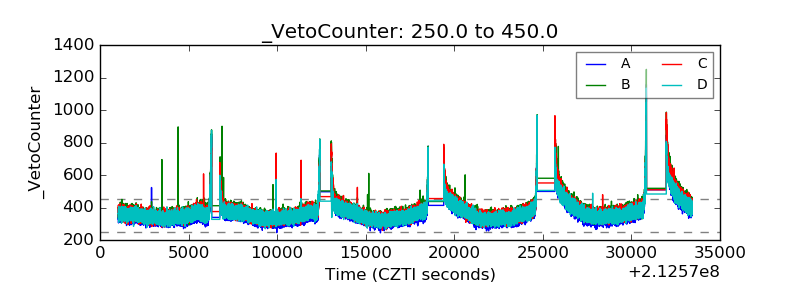 |