| Param | Original file | Final file |
|---|---|---|
| Filename | modeM0/AS1G05_214T01_9000000684_05398cztM0_level2.evt | modeM0/AS1G05_214T01_9000000684_05398cztM0_level2_quad_clean.evt |
| Size (bytes) | 494,455,680 | 75,369,600 |
| Size | 471.5 MB | 71.9 MB |
| Events in quadrant A | 3,171,929 | 470,427 |
| Events in quadrant B | 3,410,508 | 477,716 |
| Events in quadrant C | 3,609,042 | 470,389 |
| Events in quadrant D | 4,365,335 | 433,562 |
| Mode M9 | |||
|---|---|---|---|
| Quadrant | BADHDUFLAG | Total packets | Discarded packets |
| A | 0 | 13 | 0 |
| B | 0 | 13 | 0 |
| C | 0 | 13 | 0 |
| D | 0 | 13 | 0 |
| Mode SS | |||
|---|---|---|---|
| Quadrant | BADHDUFLAG | Total packets | Discarded packets |
| A | 0 | 124 | 0 |
| B | 0 | 124 | 0 |
| C | 0 | 124 | 0 |
| D | 0 | 124 | 0 |
| Mode M0 | |||
|---|---|---|---|
| Quadrant | BADHDUFLAG | Total packets | Discarded packets |
| A | 0 | 13384 | 2 |
| B | 0 | 14109 | 1 |
| C | 0 | 14770 | 1 |
| D | 0 | 17143 | 1 |
| Quadrant | Total seconds | Saturated seconds | Saturation percentage |
|---|---|---|---|
| A | 6165 | 96 | 1.557178% |
| B | 6165 | 106 | 1.719384% |
| C | 6165 | 114 | 1.849148% |
| D | 6165 | 218 | 3.536091% |
Noise dominated data is calculated using 1-second bins in cleaned event files. If a bin has >2000 counts, and if more than 50% of those come from <1% of pixels, then it is considered to be noise-dominated and hence unusable.
| Quadrant | # 1 sec bins | Bins with >0 counts | Bins with >2000 counts | High rate bins dominated by noise | Noise dominated (total time) | Noise dominated (detector-on time) | Marked lightcurve |
|---|---|---|---|---|---|---|---|
| A | 7460 | 6166 | 44 | 44 | 0.59% | 0.71% | 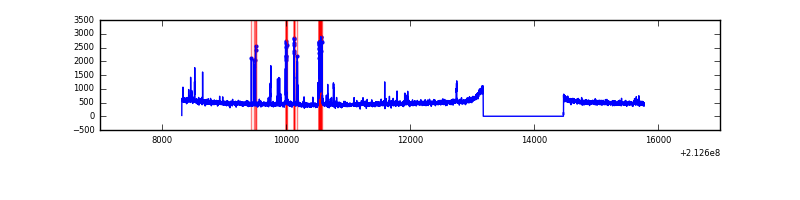 |
| B | 7460 | 6166 | 27 | 27 | 0.36% | 0.44% | 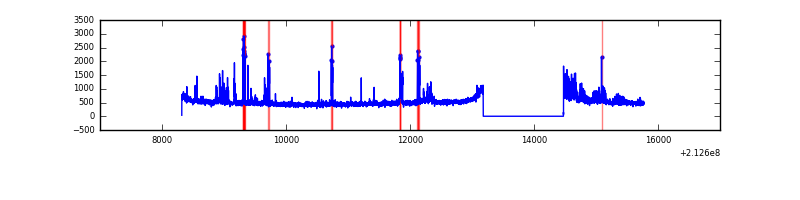 |
| C | 7460 | 6166 | 85 | 85 | 1.14% | 1.38% |  |
| D | 7460 | 6166 | 150 | 150 | 2.01% | 2.43% | 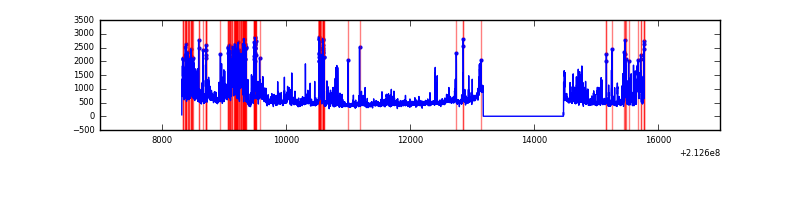 |
Top three noisy pixels from each quadrant. If the there are fewer than three noisy pixels in the level2.evt file, extra rows are filled as -1
| Pixel properties | Quadrant properties | ||||||
|---|---|---|---|---|---|---|---|
| Quadrant | DetID | PixID | Counts | Sigma | Mean | Median | Sigma |
| A | 0 | 50 | 228639 | 1483.77 | 758 | 742 | 153.6 |
| A | 13 | 6 | 13951 | 86.0 | 758 | 742 | 153.6 |
| A | 0 | 226 | 8207 | 48.6 | 758 | 742 | 153.6 |
| B | 10 | 16 | 202133 | 1380.69 | 771 | 755 | 145.9 |
| B | 0 | 219 | 145914 | 995.24 | 771 | 755 | 145.9 |
| B | 4 | 48 | 29328 | 195.9 | 771 | 755 | 145.9 |
| C | 9 | 247 | 447804 | 2609.34 | 736 | 742 | 171.3 |
| C | 1 | 16 | 259132 | 1508.13 | 736 | 742 | 171.3 |
| C | 14 | 67 | 29051 | 165.23 | 736 | 742 | 171.3 |
| D | 2 | 63 | 1360386 | 7544.52 | 726 | 705 | 180.2 |
| D | 2 | 33 | 97768 | 538.58 | 726 | 705 | 180.2 |
| D | 4 | 95 | 69202 | 380.07 | 726 | 705 | 180.2 |
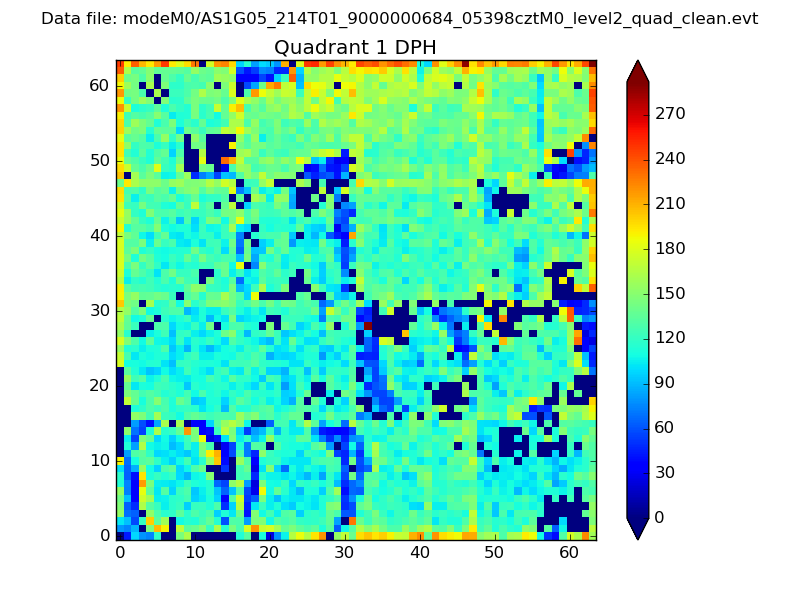
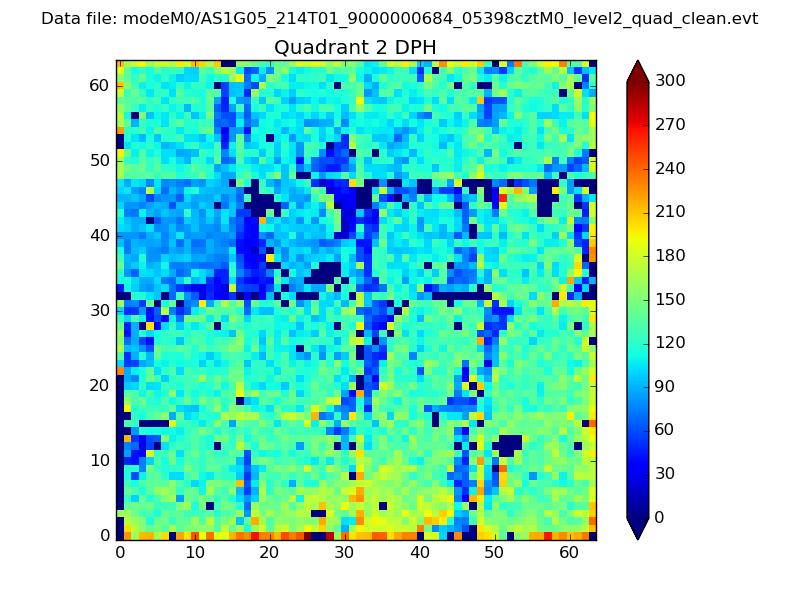
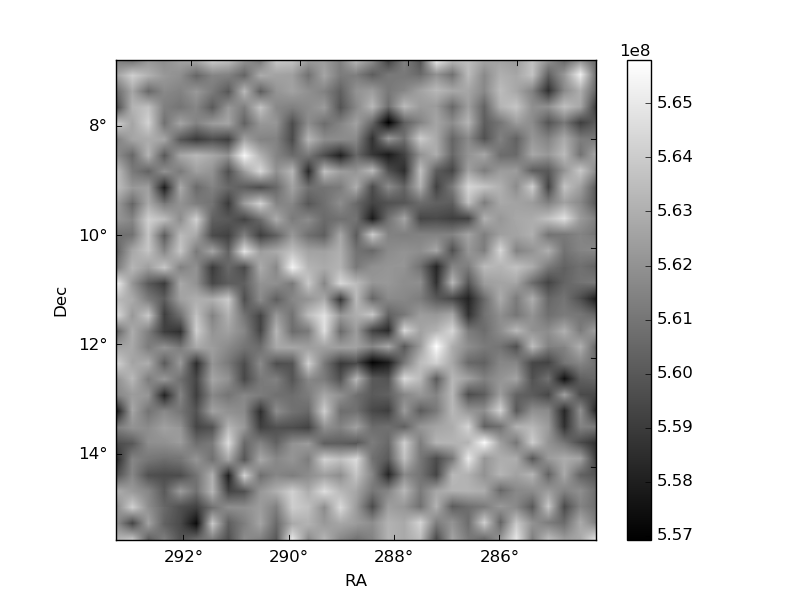
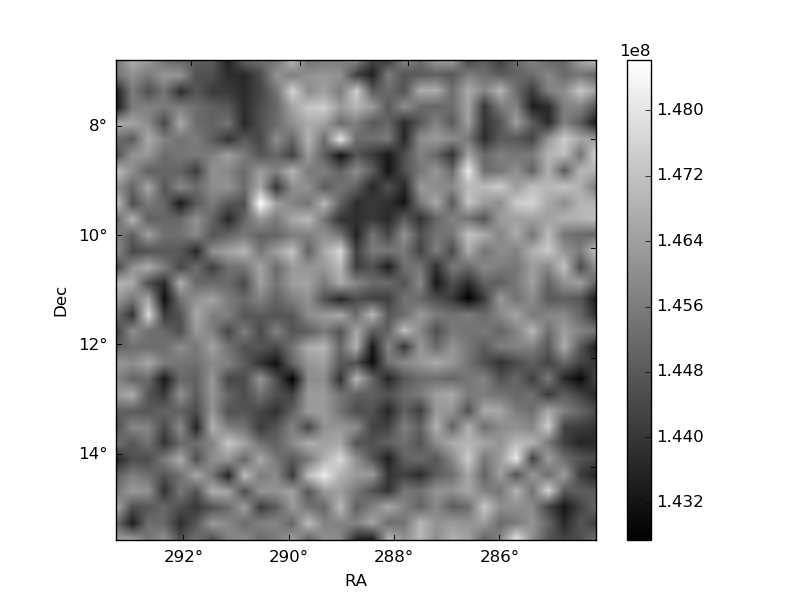
Histogram calculated using DETX and DETY for each event in the final _common_clean file
| Quadrant A | 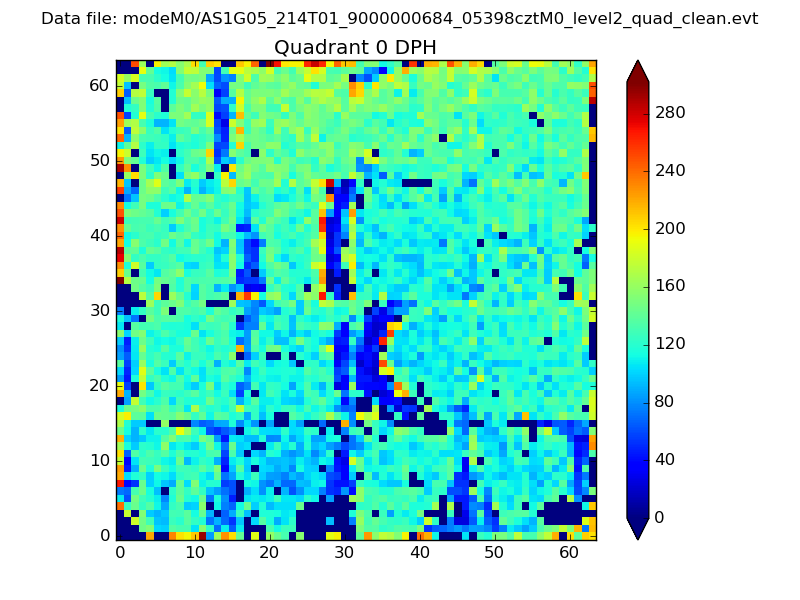 |
 |
Quadrant B |
|---|---|---|---|
| Quadrant D | 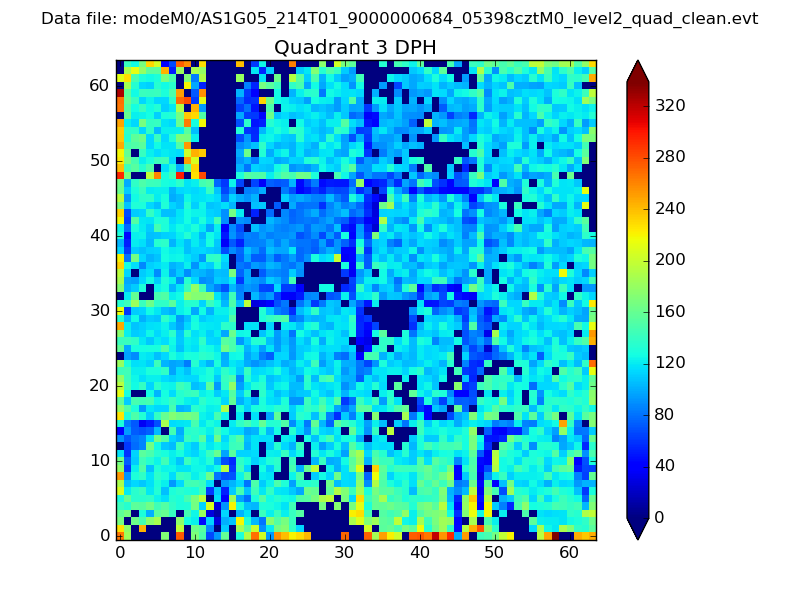 |
 |
Quadrant C |
| Plot type | Count rate plots | Images |
|---|---|---|
| Comparison with Poisson distribution Blue bars denote a histogram of data divided into 1 sec bins. Red curve is a Poisson curve with rate = median count rate of data. |
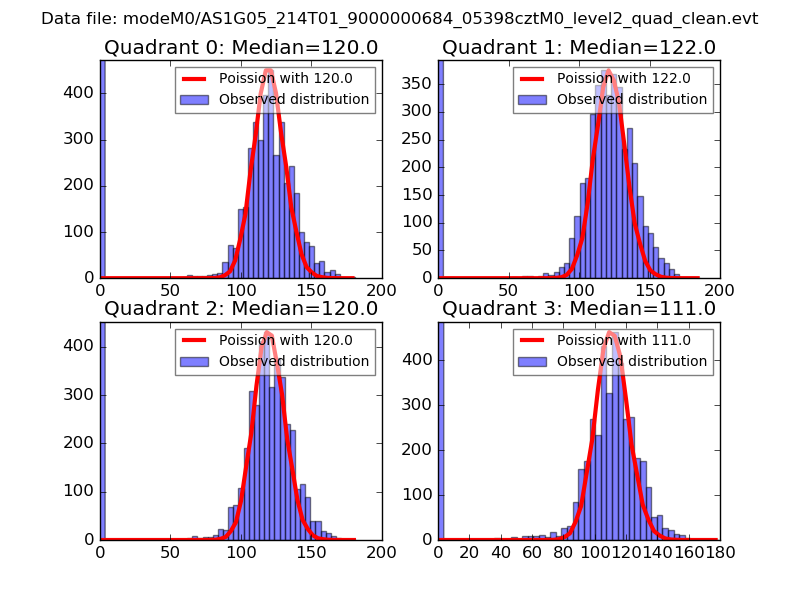 |
 |
| Quadrant-wise count rates Data is divided into 100 sec bins |
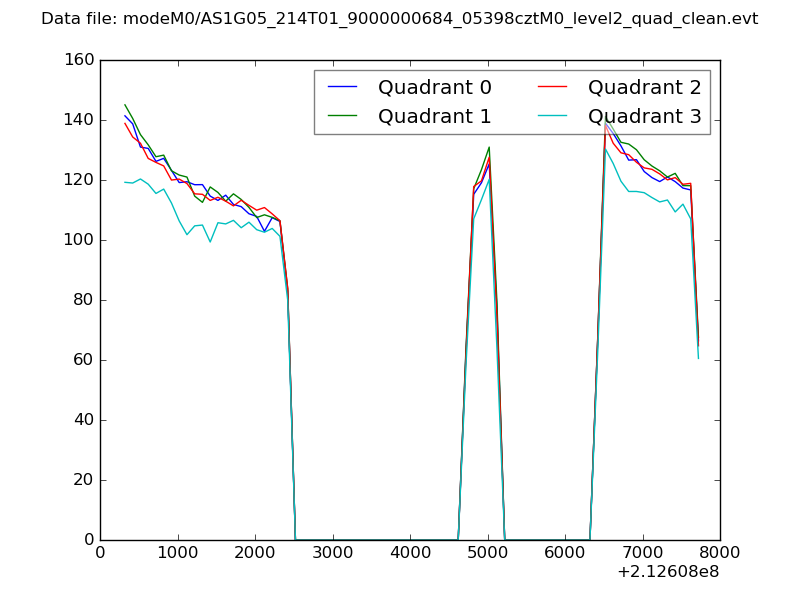 |
|
| Module-wise count rates for Quadrant A Data is divided into 100 sec bins |
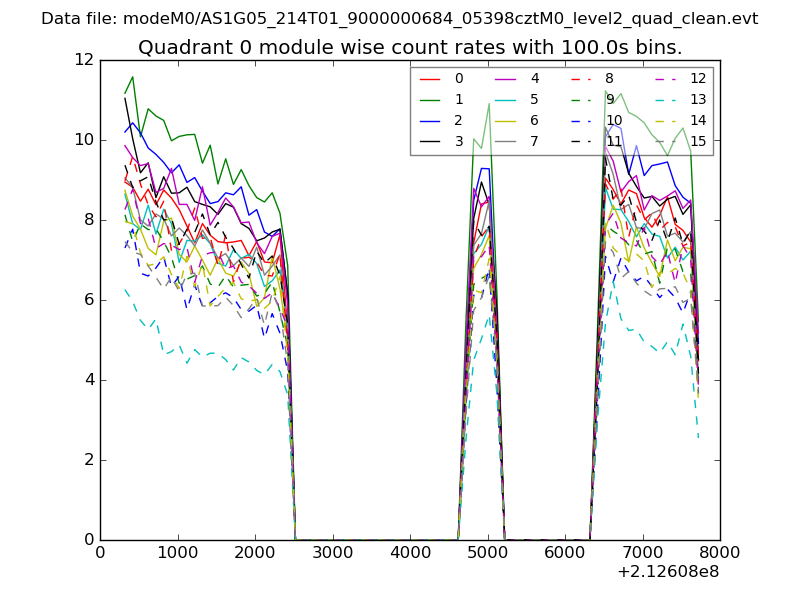 |
 |
| Module-wise count rates for Quadrant B Data is divided into 100 sec bins |
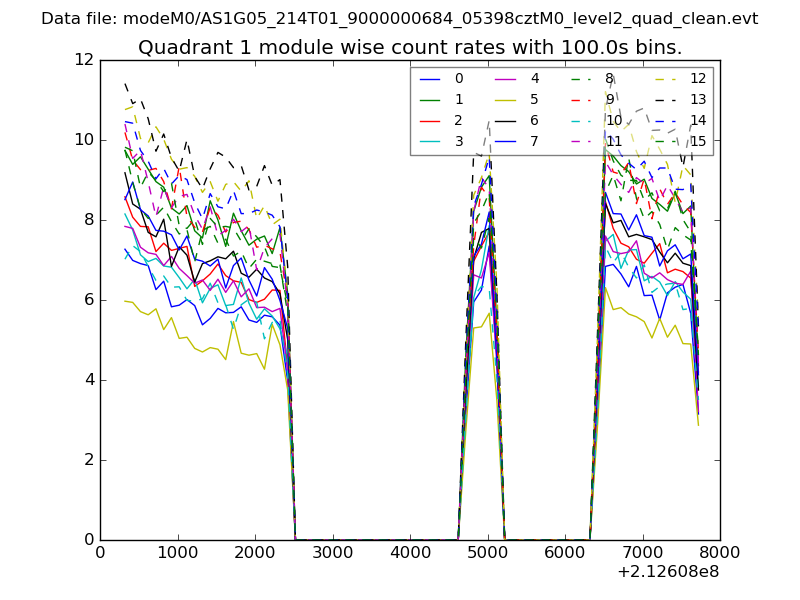 |
 |
| Module-wise count rates for Quadrant C Data is divided into 100 sec bins |
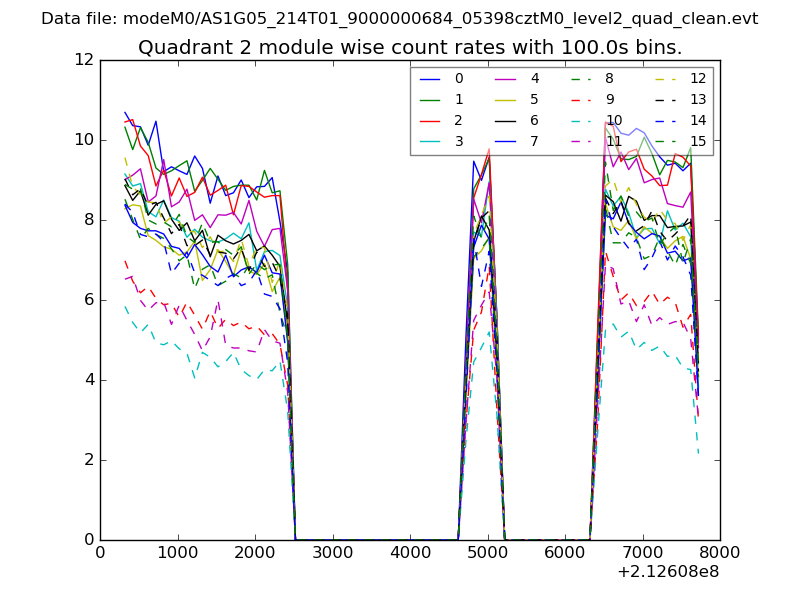 |
 |
| Module-wise count rates for Quadrant D Data is divided into 100 sec bins |
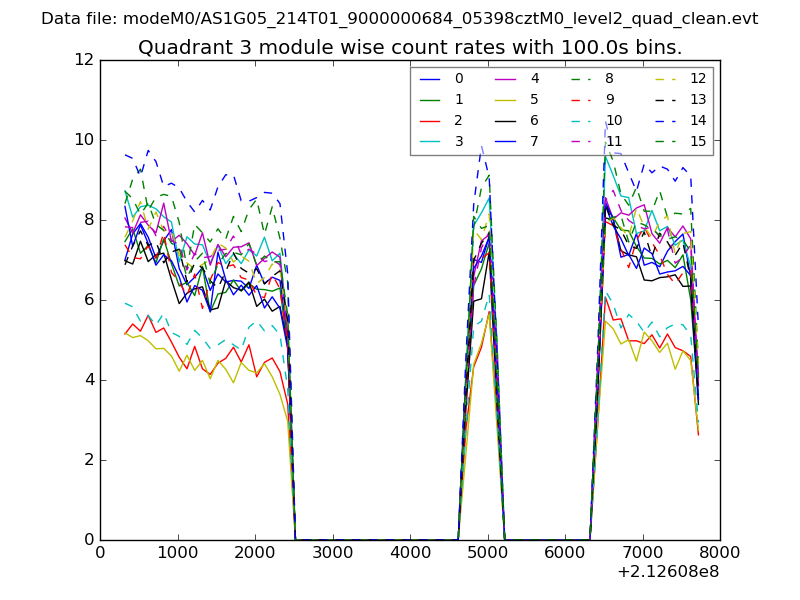 |
 |
| Parameter | Plot |
|---|---|
| CZT HV Monitor | 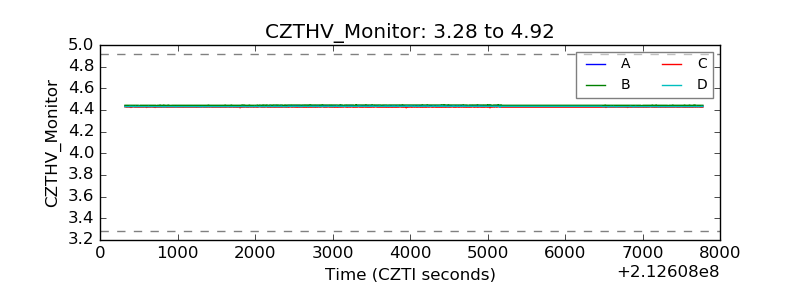 |
| D_VDD | 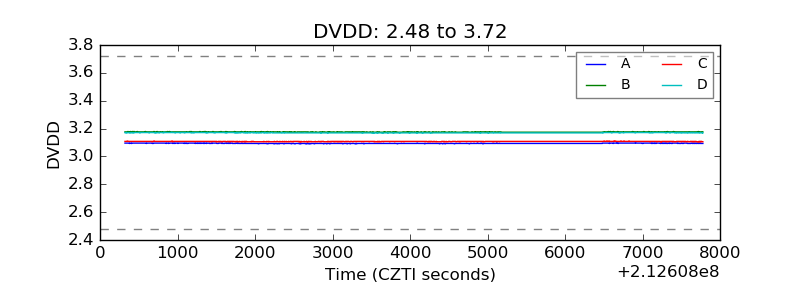 |
| Temperature 1 | 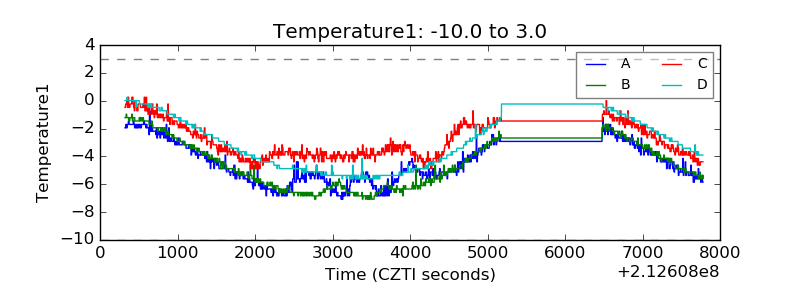 |
| Veto HV Monitor | 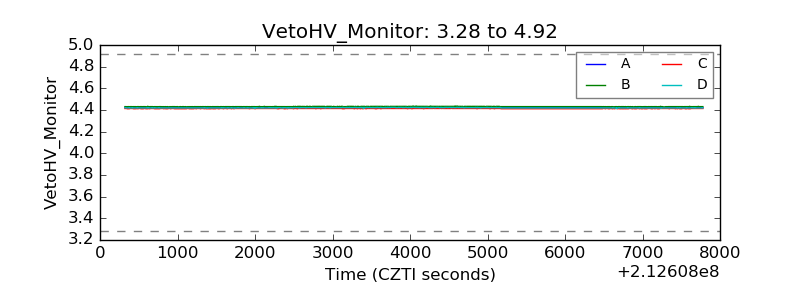 |
| Veto LLD | 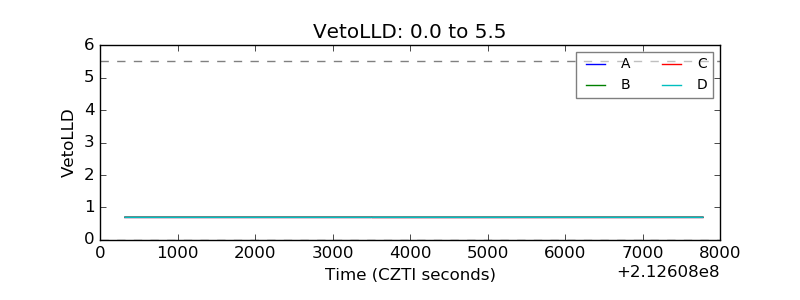 |
| Alpha Counter | 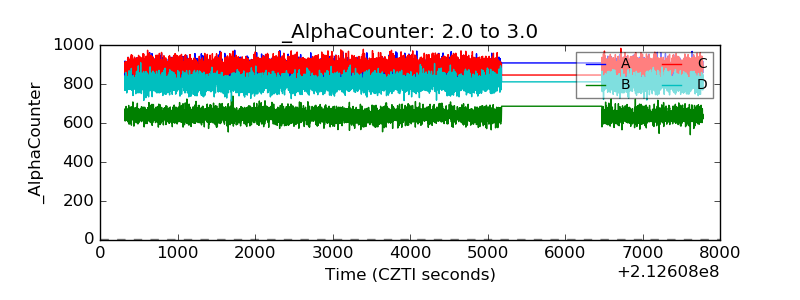 |
| _CPM_Rate | 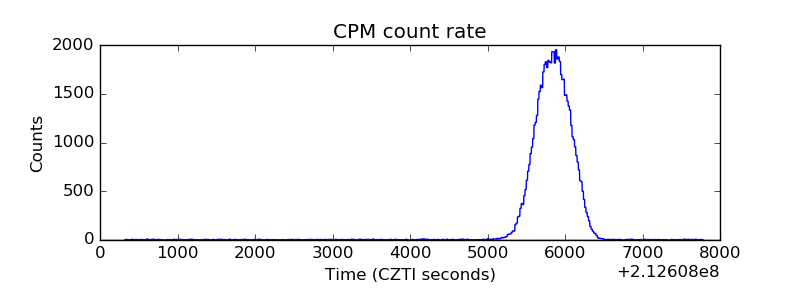 |
| CZT Counter | 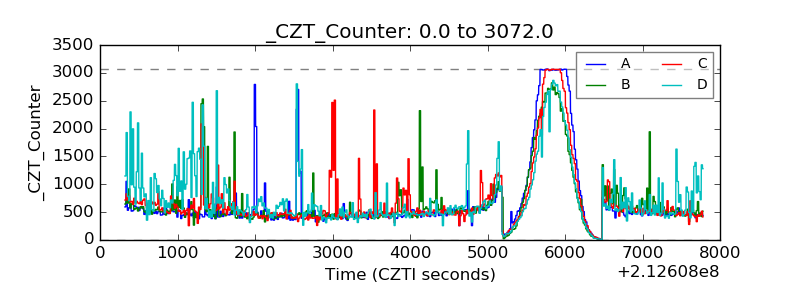 |
| +2.5 Volts monitor |  |
| +5 Volts monitor | 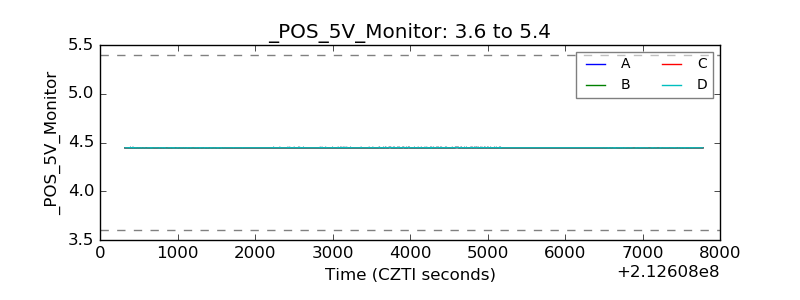 |
| _ROLL_ROT | 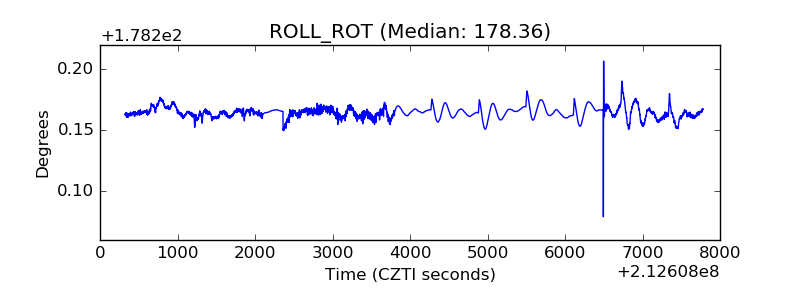 |
| _Roll_DEC | 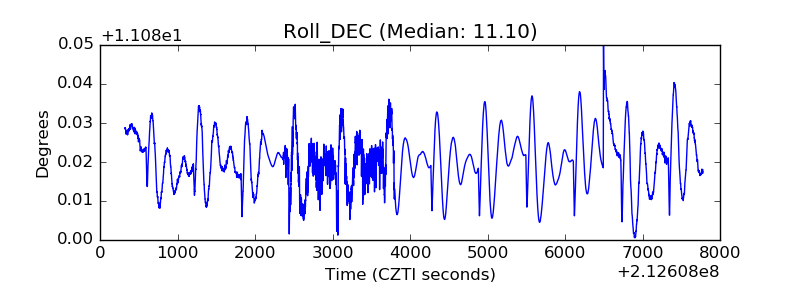 |
| _Roll_RA | 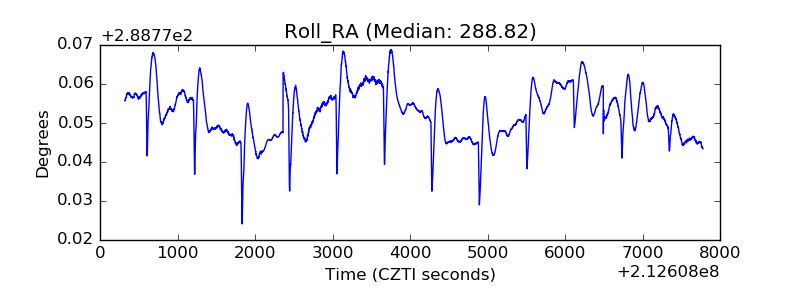 |
| Veto Counter | 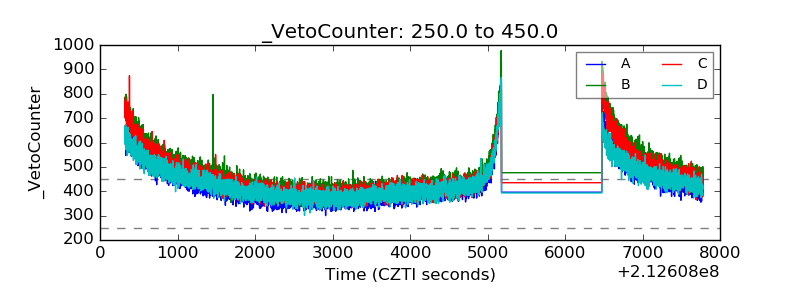 |