| Param | Original file | Final file |
|---|---|---|
| Filename | modeM0/AS1G05_214T01_9000000684_05400cztM0_level2.evt | modeM0/AS1G05_214T01_9000000684_05400cztM0_level2_quad_clean.evt |
| Size (bytes) | 471,617,280 | 65,298,240 |
| Size | 449.8 MB | 62.3 MB |
| Events in quadrant A | 2,953,502 | 391,419 |
| Events in quadrant B | 3,196,532 | 399,289 |
| Events in quadrant C | 2,843,038 | 396,842 |
| Events in quadrant D | 4,879,566 | 367,143 |
| Mode M9 | |||
|---|---|---|---|
| Quadrant | BADHDUFLAG | Total packets | Discarded packets |
| A | 0 | 12 | 0 |
| B | 0 | 12 | 0 |
| C | 0 | 12 | 0 |
| D | 0 | 12 | 0 |
| Mode SS | |||
|---|---|---|---|
| Quadrant | BADHDUFLAG | Total packets | Discarded packets |
| A | 0 | 122 | 0 |
| B | 0 | 122 | 0 |
| C | 0 | 122 | 0 |
| D | 0 | 122 | 0 |
| Mode M0 | |||
|---|---|---|---|
| Quadrant | BADHDUFLAG | Total packets | Discarded packets |
| A | 0 | 12959 | 2 |
| B | 0 | 13526 | 1 |
| C | 0 | 12558 | 1 |
| D | 0 | 18658 | 1 |
| Quadrant | Total seconds | Saturated seconds | Saturation percentage |
|---|---|---|---|
| A | 6048 | 67 | 1.107804% |
| B | 6048 | 72 | 1.190476% |
| C | 6048 | 21 | 0.347222% |
| D | 6048 | 325 | 5.373677% |
Noise dominated data is calculated using 1-second bins in cleaned event files. If a bin has >2000 counts, and if more than 50% of those come from <1% of pixels, then it is considered to be noise-dominated and hence unusable.
| Quadrant | # 1 sec bins | Bins with >0 counts | Bins with >2000 counts | High rate bins dominated by noise | Noise dominated (total time) | Noise dominated (detector-on time) | Marked lightcurve |
|---|---|---|---|---|---|---|---|
| A | 7238 | 6049 | 41 | 41 | 0.57% | 0.68% | 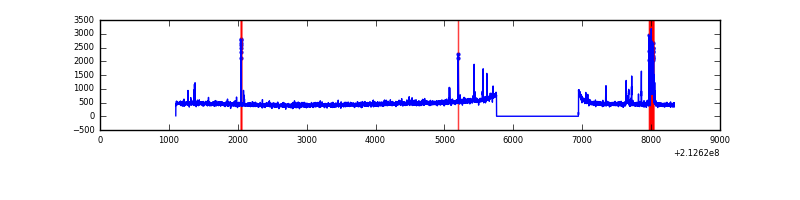 |
| B | 7238 | 6049 | 29 | 29 | 0.40% | 0.48% | 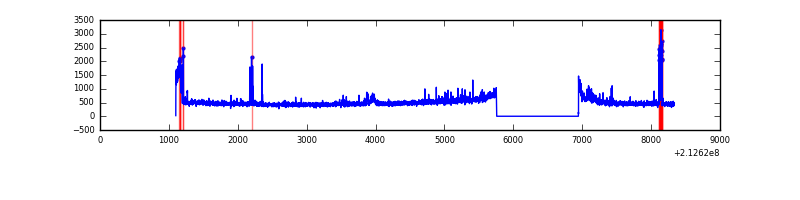 |
| C | 7238 | 6049 | 10 | 10 | 0.14% | 0.17% | 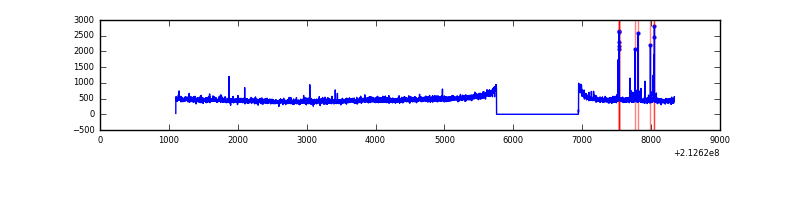 |
| D | 7238 | 6049 | 351 | 351 | 4.85% | 5.80% | 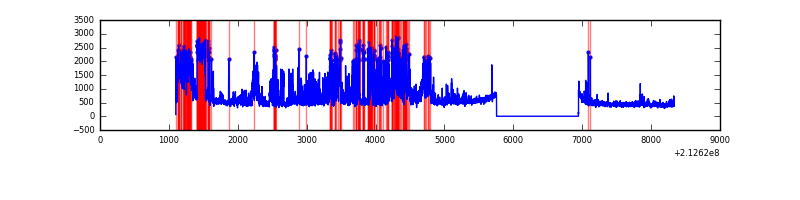 |
Top three noisy pixels from each quadrant. If the there are fewer than three noisy pixels in the level2.evt file, extra rows are filled as -1
| Pixel properties | Quadrant properties | ||||||
|---|---|---|---|---|---|---|---|
| Quadrant | DetID | PixID | Counts | Sigma | Mean | Median | Sigma |
| A | 15 | 174 | 131066 | 889.56 | 712 | 697 | 146.6 |
| A | 0 | 50 | 54450 | 366.78 | 712 | 697 | 146.6 |
| A | 13 | 6 | 16820 | 110.01 | 712 | 697 | 146.6 |
| B | 0 | 187 | 101388 | 721.73 | 729 | 712 | 139.5 |
| B | 15 | 204 | 81414 | 578.54 | 729 | 712 | 139.5 |
| B | 4 | 48 | 66638 | 472.61 | 729 | 712 | 139.5 |
| C | 9 | 247 | 49939 | 300.37 | 699 | 705 | 163.9 |
| C | 1 | 16 | 47339 | 284.51 | 699 | 705 | 163.9 |
| C | 14 | 67 | 14389 | 83.49 | 699 | 705 | 163.9 |
| D | 2 | 63 | 2062798 | 12243.22 | 680 | 658 | 168.4 |
| D | 2 | 33 | 61702 | 362.43 | 680 | 658 | 168.4 |
| D | 2 | 206 | 56818 | 333.43 | 680 | 658 | 168.4 |
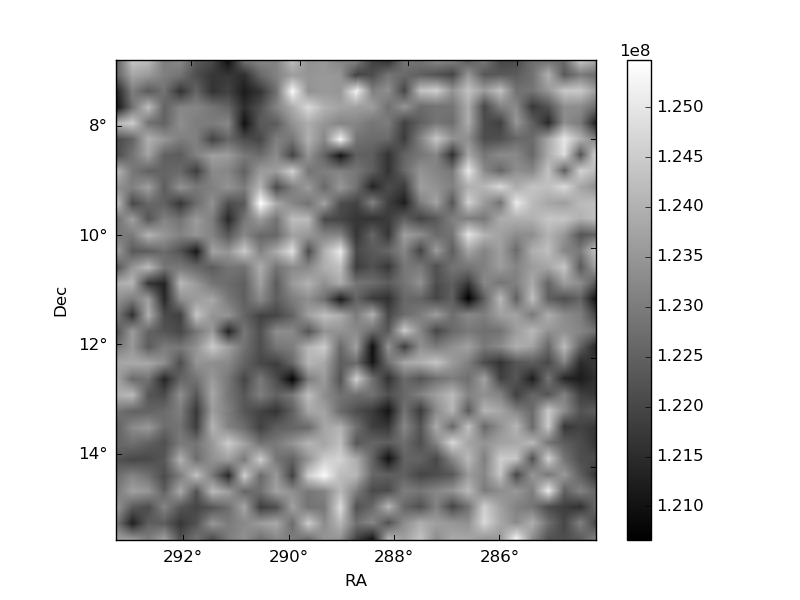
Histogram calculated using DETX and DETY for each event in the final _common_clean file
| Quadrant A | 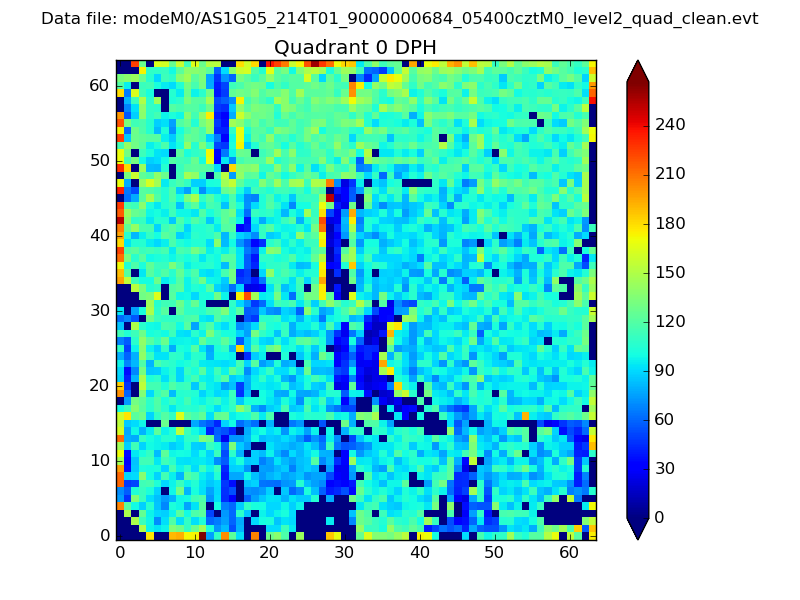 |
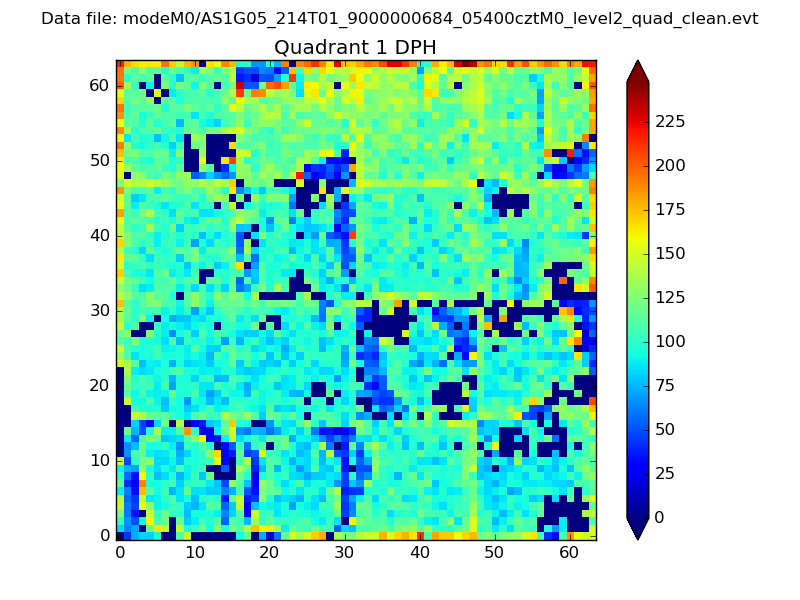 |
Quadrant B |
|---|---|---|---|
| Quadrant D | 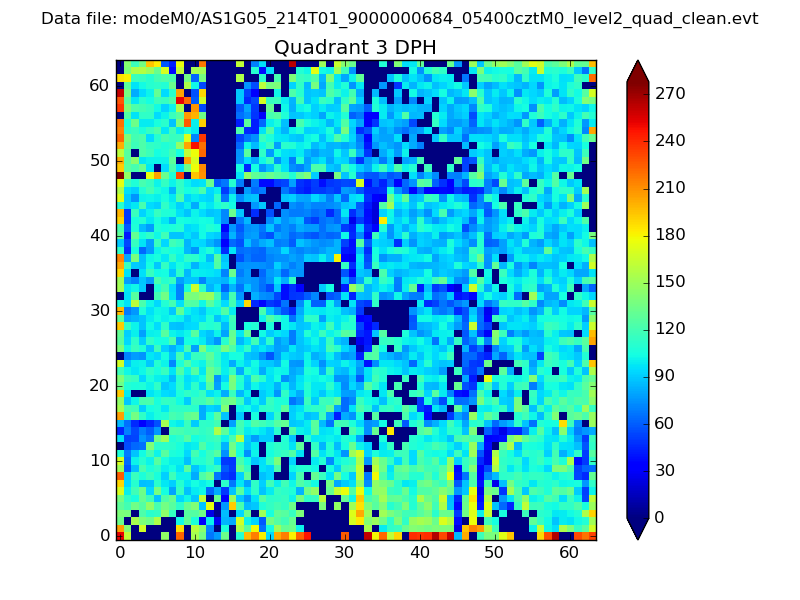 |
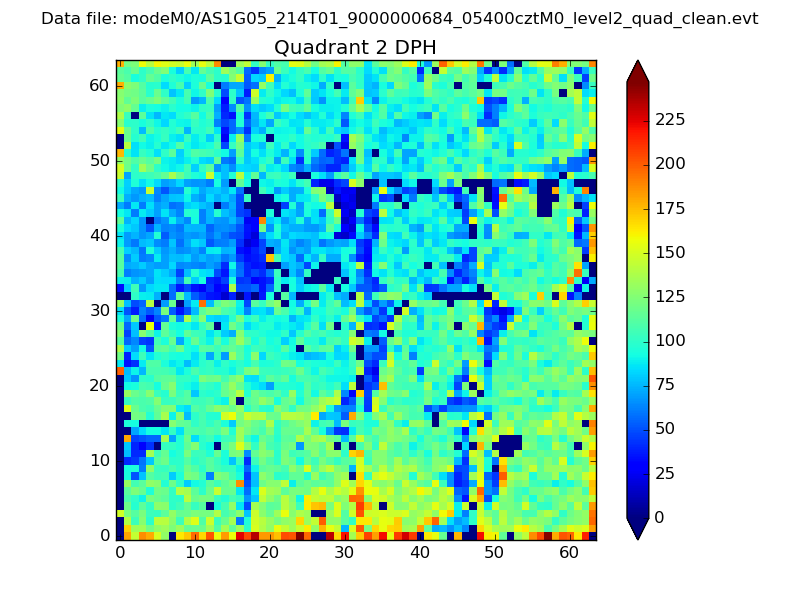 |
Quadrant C |
| Plot type | Count rate plots | Images |
|---|---|---|
| Comparison with Poisson distribution Blue bars denote a histogram of data divided into 1 sec bins. Red curve is a Poisson curve with rate = median count rate of data. |
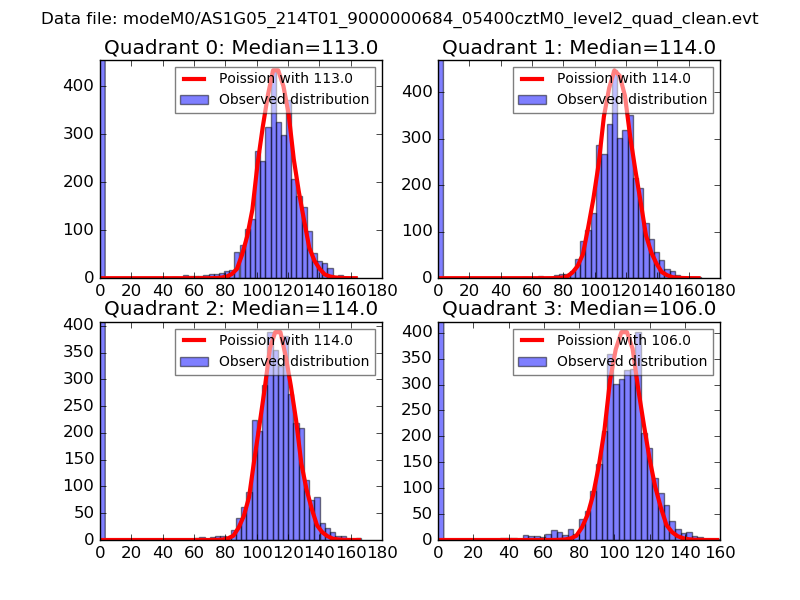 |
 |
| Quadrant-wise count rates Data is divided into 100 sec bins |
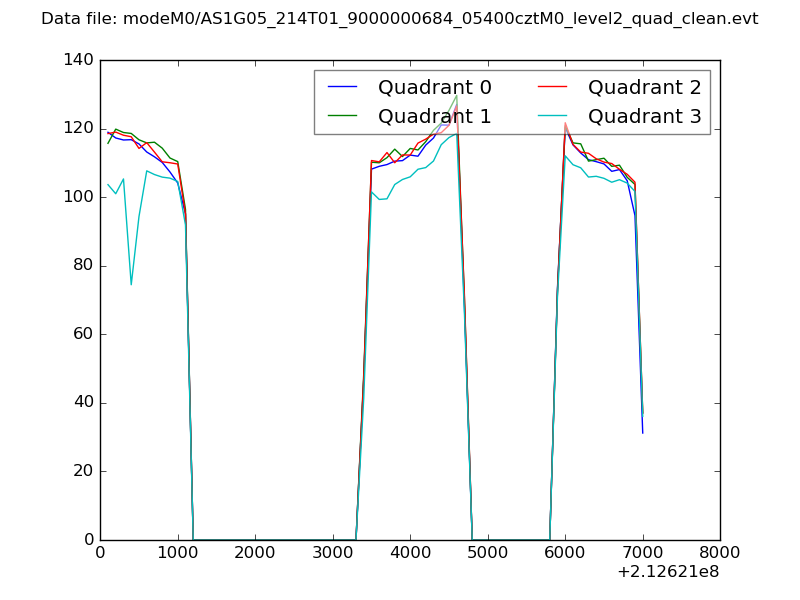 |
|
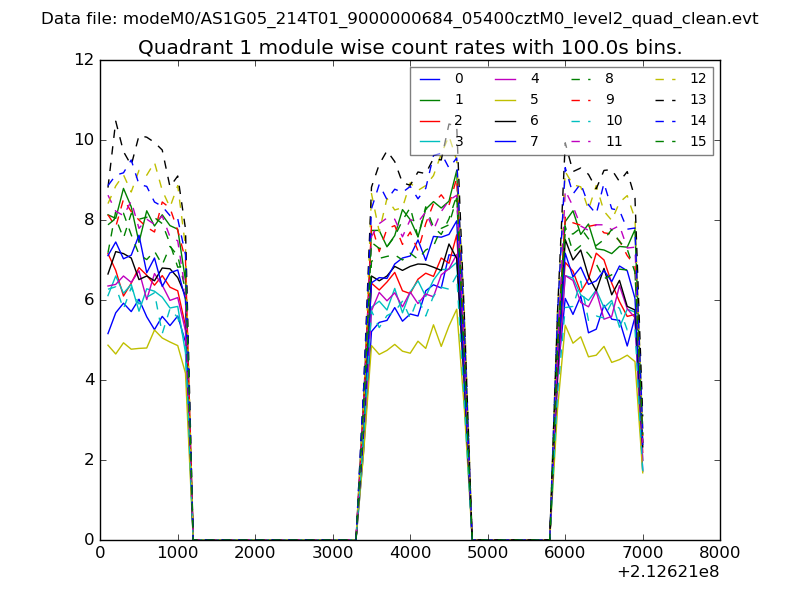
| Module-wise count rates for Quadrant A Data is divided into 100 sec bins |
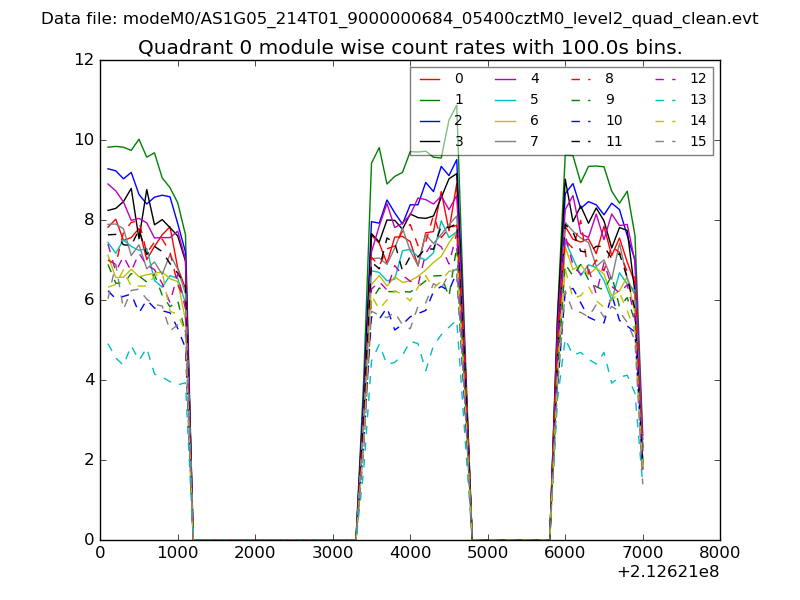 |
 |
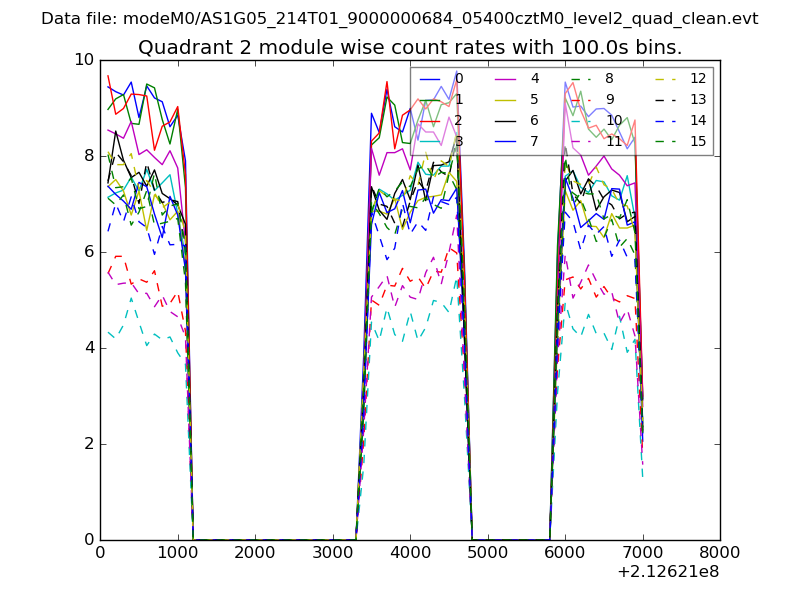
| Module-wise count rates for Quadrant B Data is divided into 100 sec bins |
 |
 |
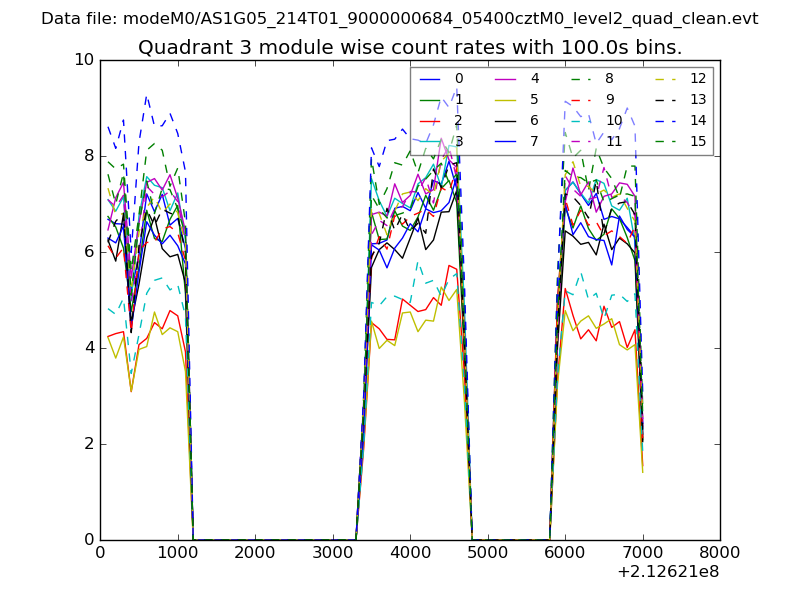
| Module-wise count rates for Quadrant C Data is divided into 100 sec bins |
 |
 |
| Module-wise count rates for Quadrant D Data is divided into 100 sec bins |
 |
 |
| Parameter | Plot |
|---|---|
| CZT HV Monitor | 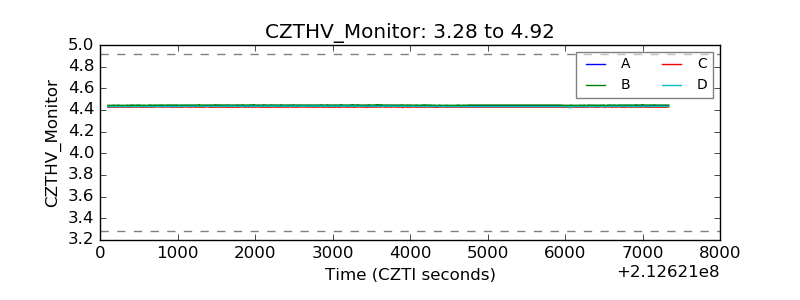 |
| D_VDD | 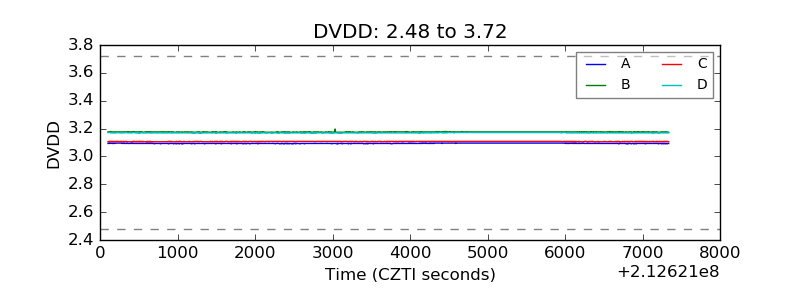 |
| Temperature 1 | 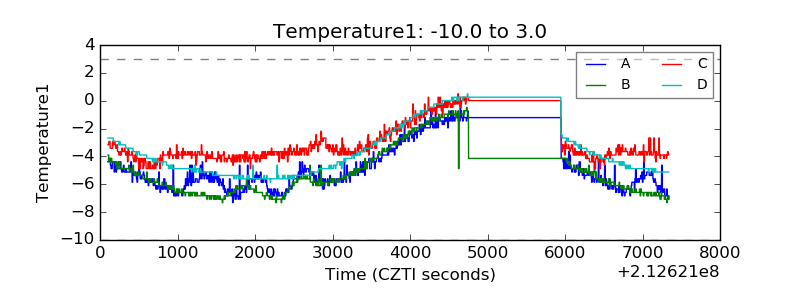 |
| Veto HV Monitor | 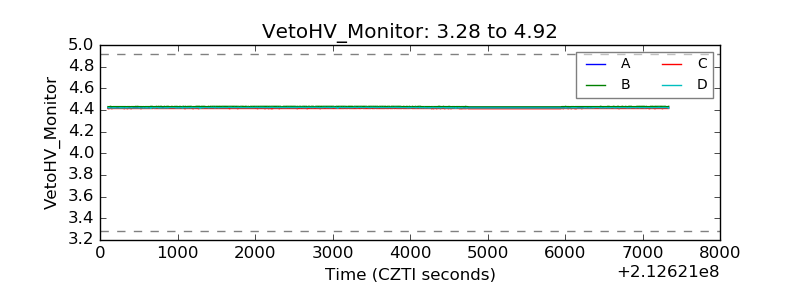 |
| Veto LLD | 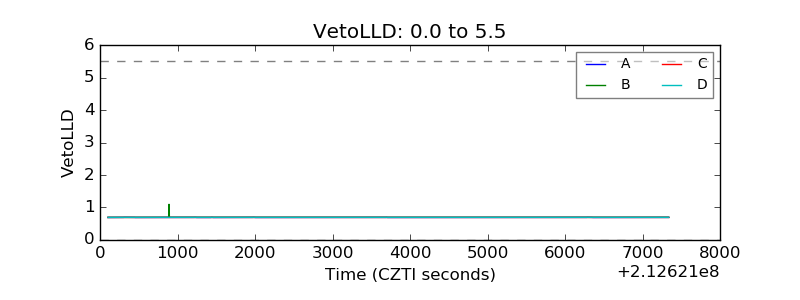 |
| Alpha Counter | 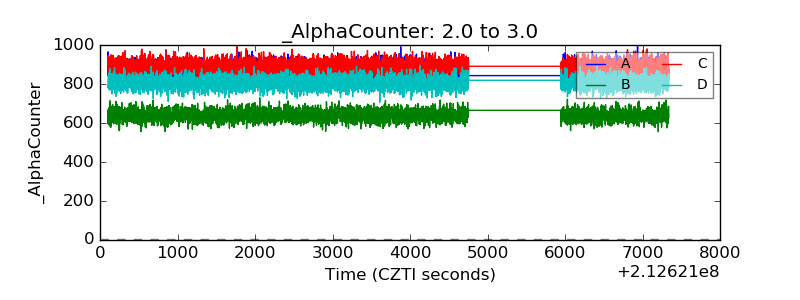 |
| _CPM_Rate | 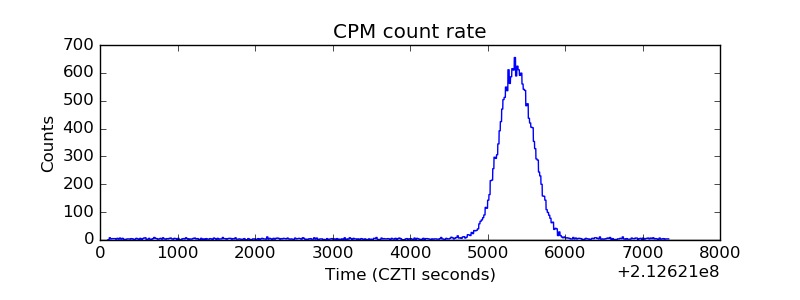 |
| CZT Counter | 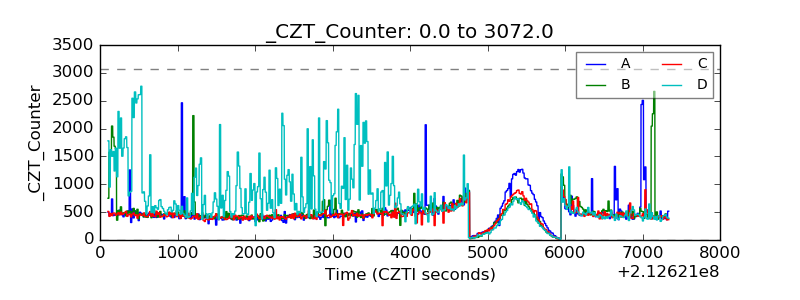 |
| +2.5 Volts monitor |  |
| +5 Volts monitor |  |
| _ROLL_ROT | 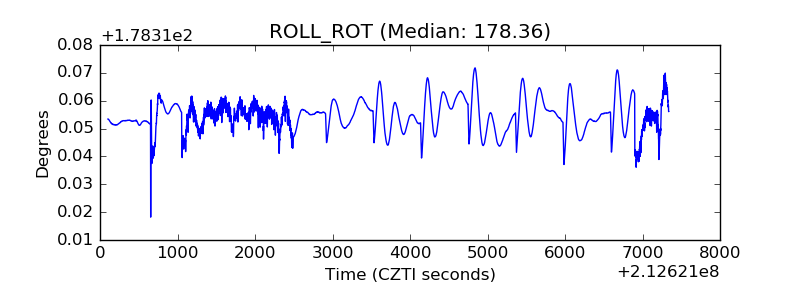 |
| _Roll_DEC | 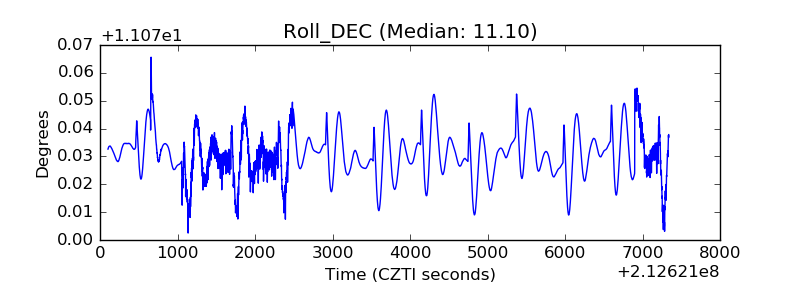 |
| _Roll_RA | 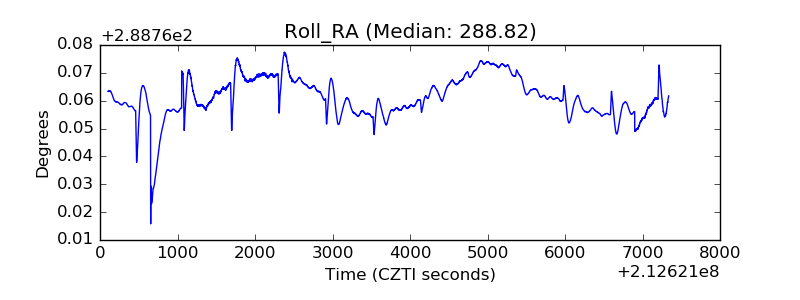 |
| Veto Counter | 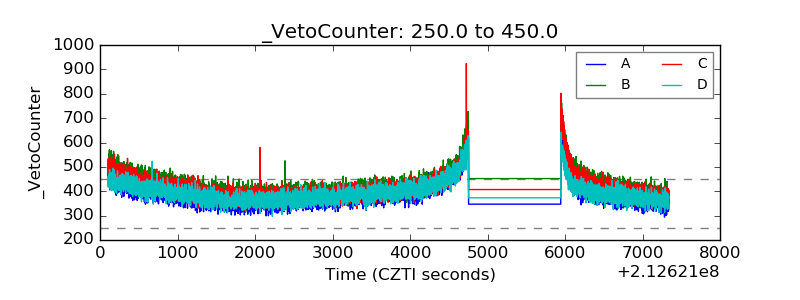 |