| Param | Original file | Final file |
|---|---|---|
| Filename | modeM0/AS1G05_214T01_9000000684_05401cztM0_level2.evt | modeM0/AS1G05_214T01_9000000684_05401cztM0_level2_quad_clean.evt |
| Size (bytes) | 477,982,080 | 71,331,840 |
| Size | 455.8 MB | 68.0 MB |
| Events in quadrant A | 3,282,179 | 427,402 |
| Events in quadrant B | 3,466,403 | 431,664 |
| Events in quadrant C | 3,364,463 | 428,912 |
| Events in quadrant D | 3,901,821 | 398,946 |
| Mode M9 | |||
|---|---|---|---|
| Quadrant | BADHDUFLAG | Total packets | Discarded packets |
| A | 0 | 21 | 0 |
| B | 0 | 21 | 0 |
| C | 0 | 21 | 0 |
| D | 0 | 21 | 0 |
| Mode SS | |||
|---|---|---|---|
| Quadrant | BADHDUFLAG | Total packets | Discarded packets |
| A | 0 | 140 | 0 |
| B | 0 | 140 | 0 |
| C | 0 | 140 | 0 |
| D | 0 | 140 | 0 |
| Mode M0 | |||
|---|---|---|---|
| Quadrant | BADHDUFLAG | Total packets | Discarded packets |
| A | 0 | 14401 | 3 |
| B | 0 | 14737 | 2 |
| C | 0 | 14492 | 2 |
| D | 0 | 16552 | 2 |
| Quadrant | Total seconds | Saturated seconds | Saturation percentage |
|---|---|---|---|
| A | 6782 | 72 | 1.061634% |
| B | 6782 | 98 | 1.445001% |
| C | 6782 | 55 | 0.810970% |
| D | 6782 | 234 | 3.450310% |
Noise dominated data is calculated using 1-second bins in cleaned event files. If a bin has >2000 counts, and if more than 50% of those come from <1% of pixels, then it is considered to be noise-dominated and hence unusable.
| Quadrant | # 1 sec bins | Bins with >0 counts | Bins with >2000 counts | High rate bins dominated by noise | Noise dominated (total time) | Noise dominated (detector-on time) | Marked lightcurve |
|---|---|---|---|---|---|---|---|
| A | 8867 | 6784 | 32 | 32 | 0.36% | 0.47% |  |
| B | 8867 | 6784 | 25 | 25 | 0.28% | 0.37% |  |
| C | 8867 | 6784 | 17 | 17 | 0.19% | 0.25% |  |
| D | 8867 | 6784 | 208 | 208 | 2.35% | 3.07% | 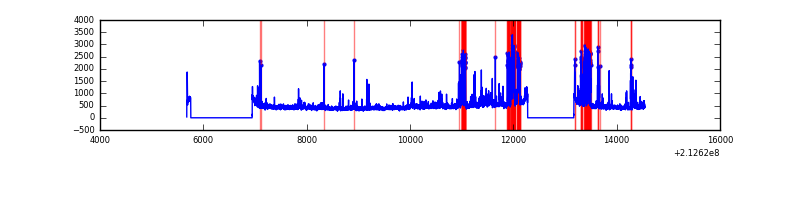 |
Top three noisy pixels from each quadrant. If the there are fewer than three noisy pixels in the level2.evt file, extra rows are filled as -1
| Pixel properties | Quadrant properties | ||||||
|---|---|---|---|---|---|---|---|
| Quadrant | DetID | PixID | Counts | Sigma | Mean | Median | Sigma |
| A | 15 | 174 | 126307 | 763.54 | 800 | 780 | 164.4 |
| A | 0 | 50 | 34853 | 207.25 | 800 | 780 | 164.4 |
| A | 0 | 247 | 25656 | 151.31 | 800 | 780 | 164.4 |
| B | 15 | 204 | 119782 | 756.53 | 815 | 795 | 157.3 |
| B | 4 | 48 | 77486 | 487.61 | 815 | 795 | 157.3 |
| B | 0 | 219 | 39652 | 247.06 | 815 | 795 | 157.3 |
| C | 9 | 247 | 175412 | 950.3 | 782 | 785 | 183.8 |
| C | 1 | 16 | 111098 | 600.31 | 782 | 785 | 183.8 |
| C | 14 | 67 | 17168 | 89.15 | 782 | 785 | 183.8 |
| D | 2 | 63 | 727822 | 3824.04 | 766 | 741 | 190.1 |
| D | 2 | 16 | 111554 | 582.81 | 766 | 741 | 190.1 |
| D | 8 | 195 | 55640 | 288.74 | 766 | 741 | 190.1 |
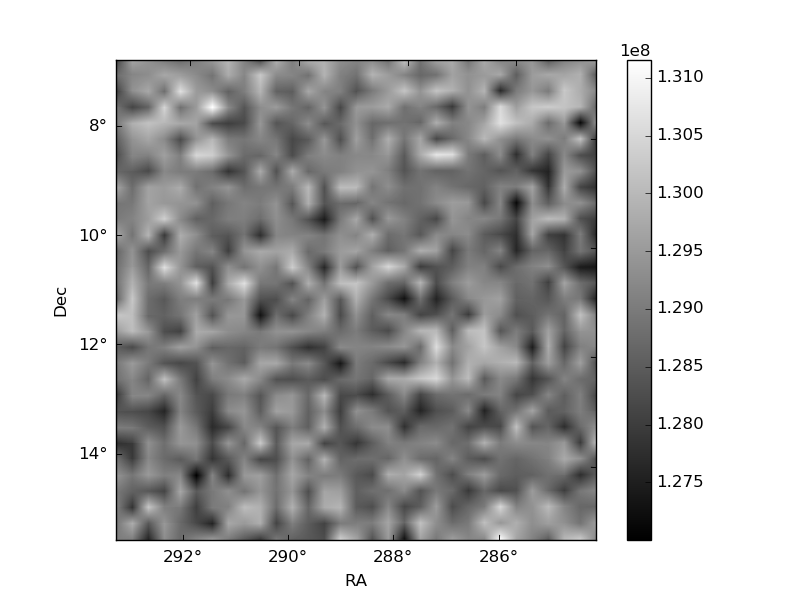
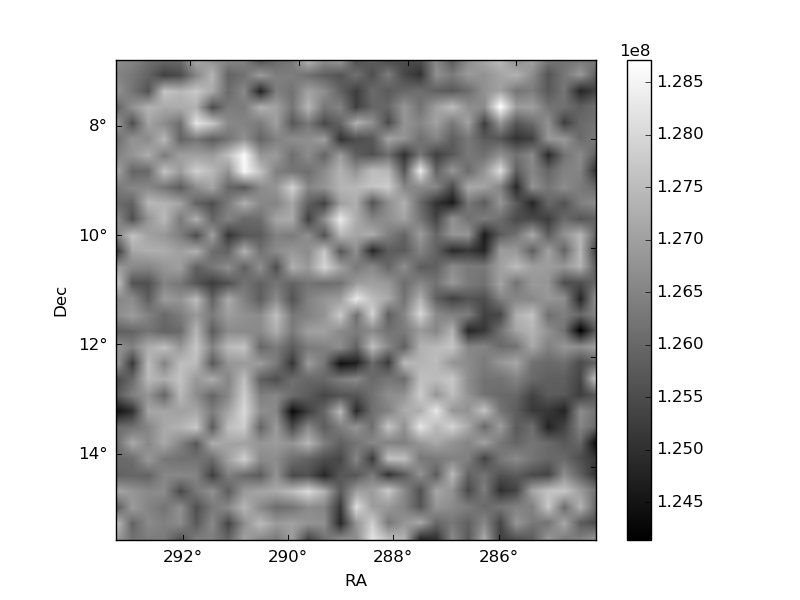
Histogram calculated using DETX and DETY for each event in the final _common_clean file
| Quadrant A | 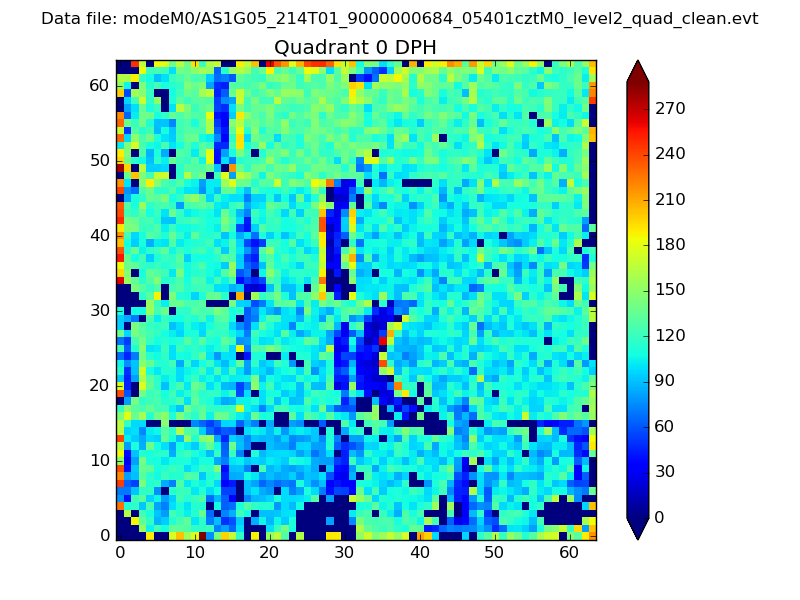 |
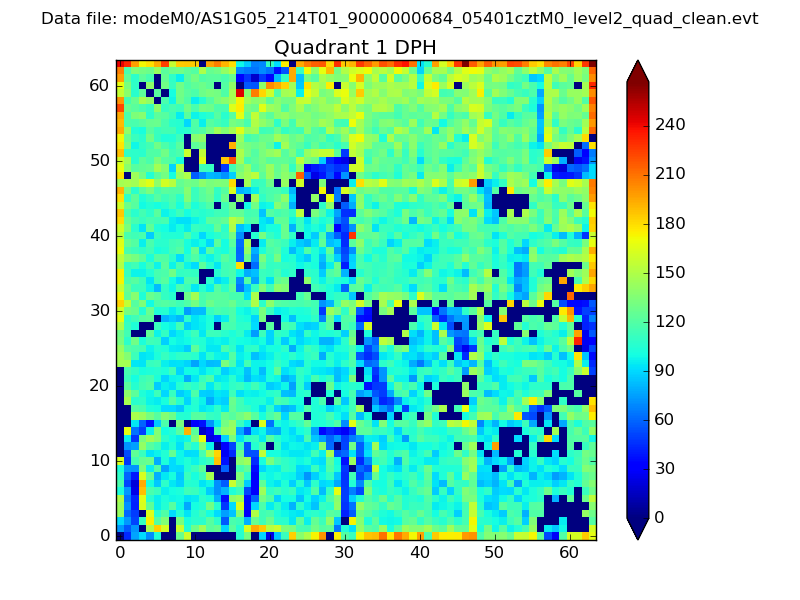 |
Quadrant B |
|---|---|---|---|
| Quadrant D | 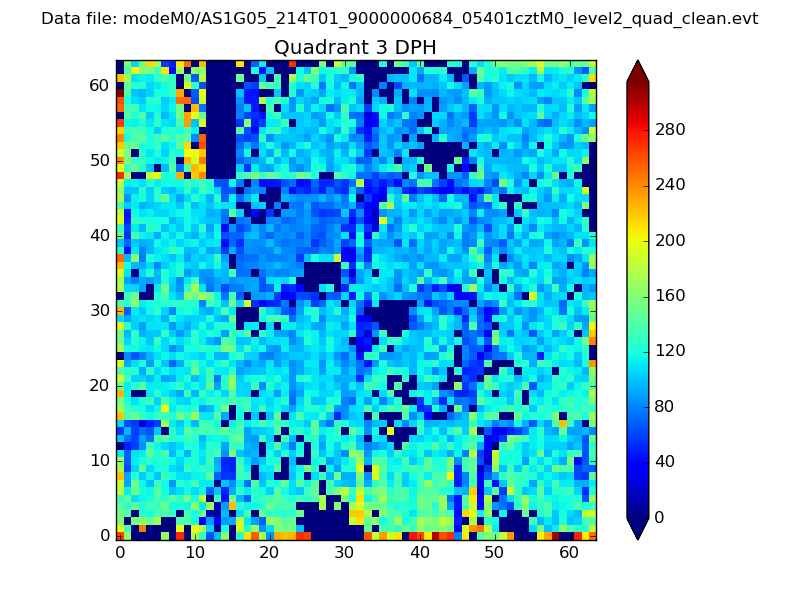 |
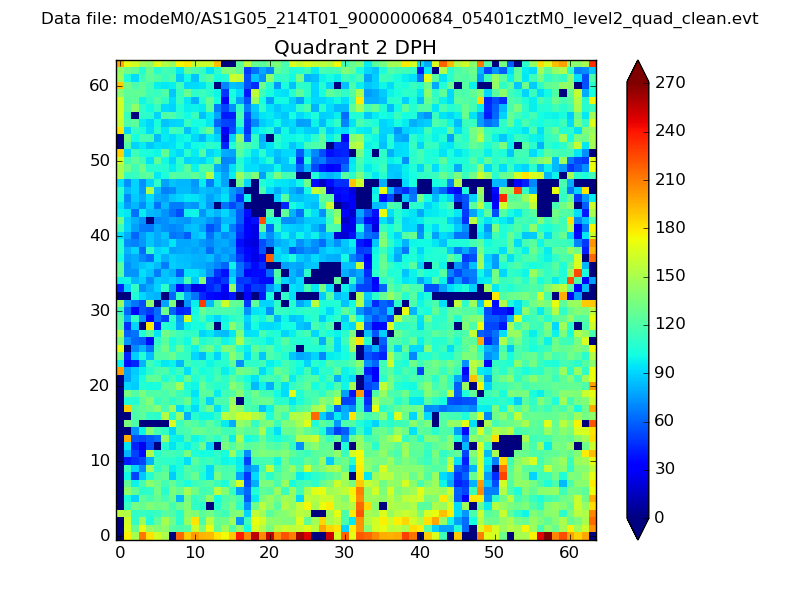 |
Quadrant C |
| Plot type | Count rate plots | Images |
|---|---|---|
| Comparison with Poisson distribution Blue bars denote a histogram of data divided into 1 sec bins. Red curve is a Poisson curve with rate = median count rate of data. |
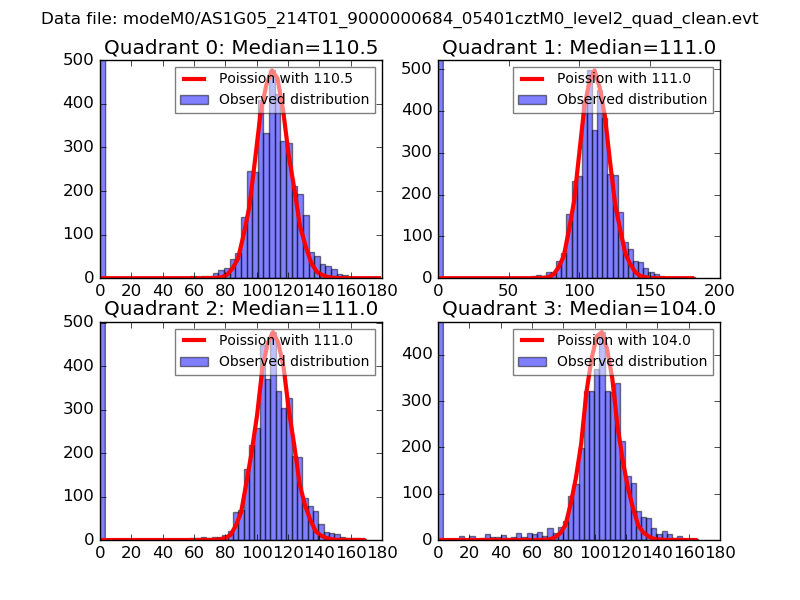 |
 |
| Quadrant-wise count rates Data is divided into 100 sec bins |
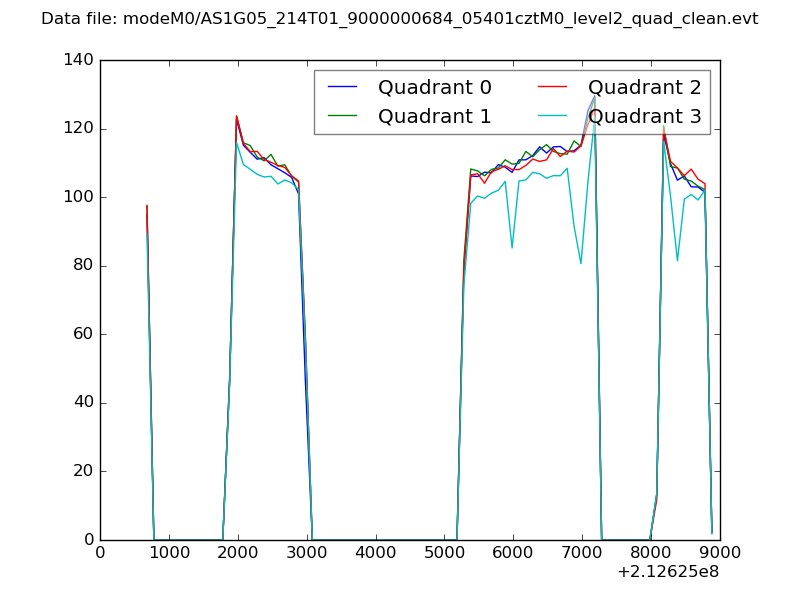 |
|
| Module-wise count rates for Quadrant A Data is divided into 100 sec bins |
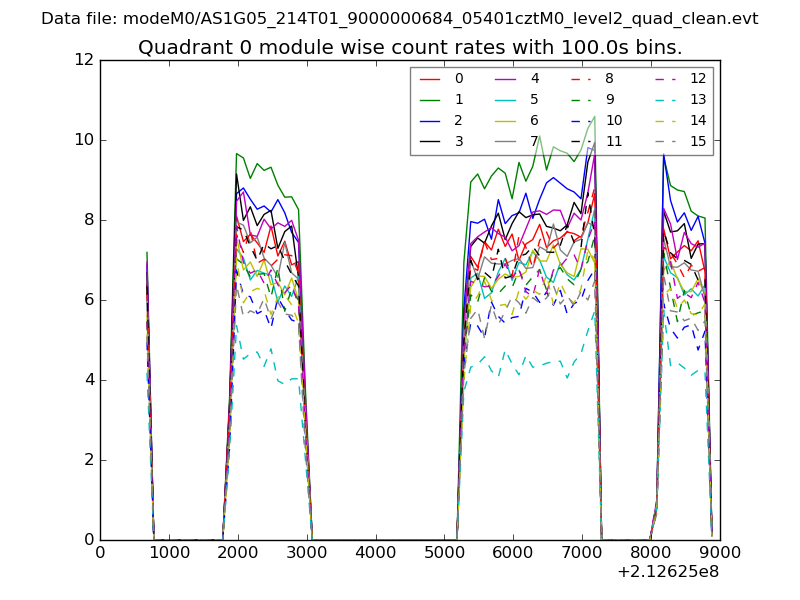 |
 |
| Module-wise count rates for Quadrant B Data is divided into 100 sec bins |
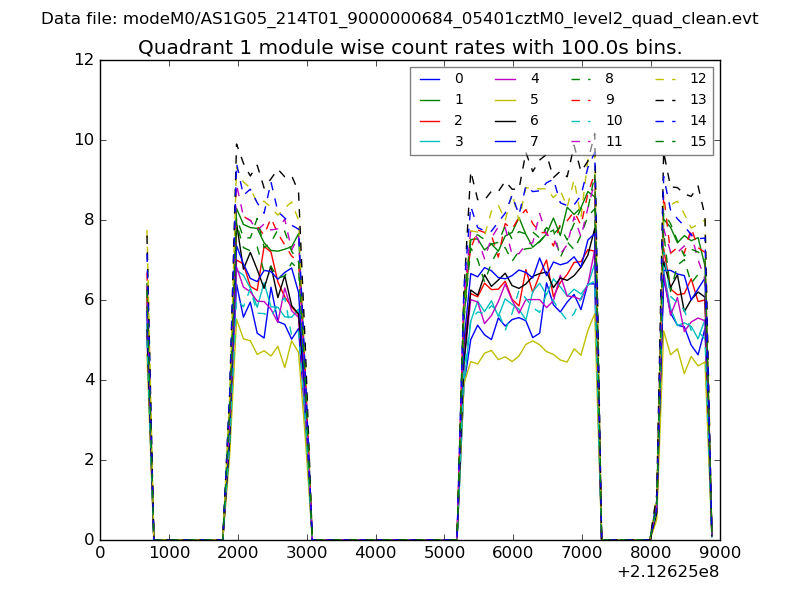 |
 |
| Module-wise count rates for Quadrant C Data is divided into 100 sec bins |
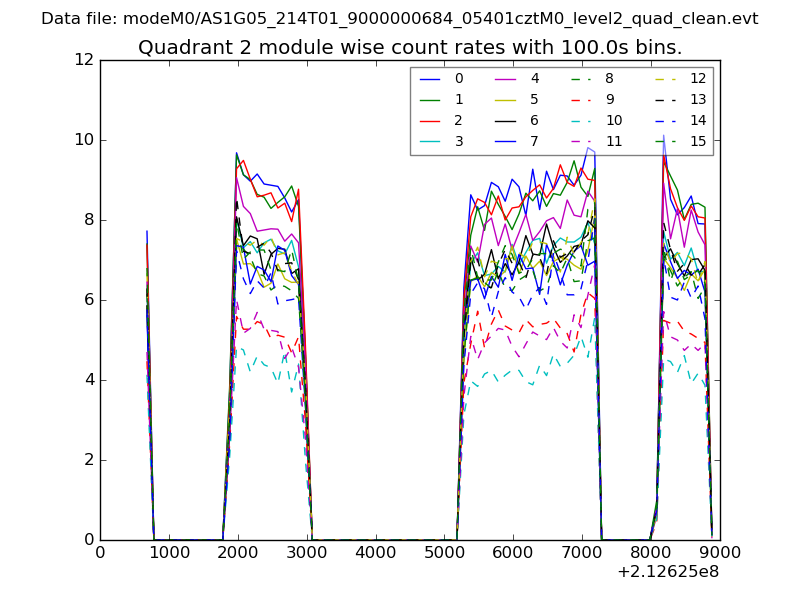 |
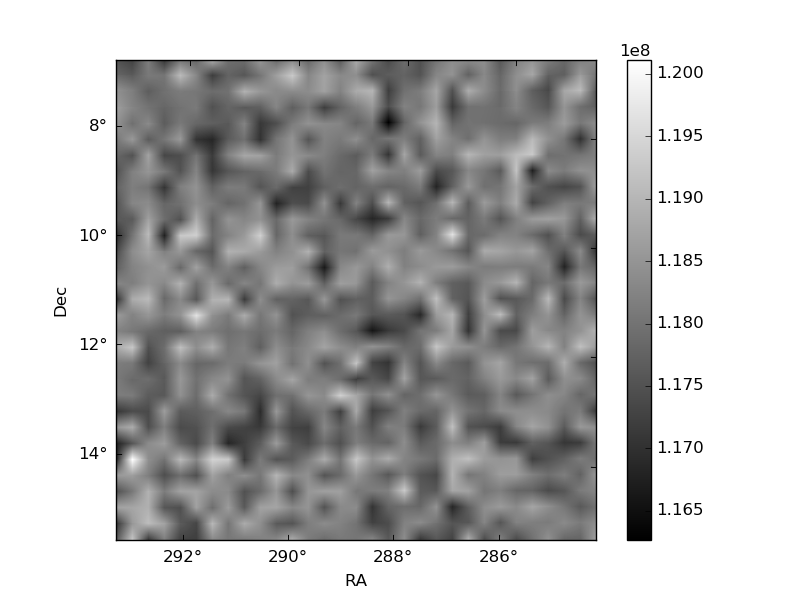 |
| Module-wise count rates for Quadrant D Data is divided into 100 sec bins |
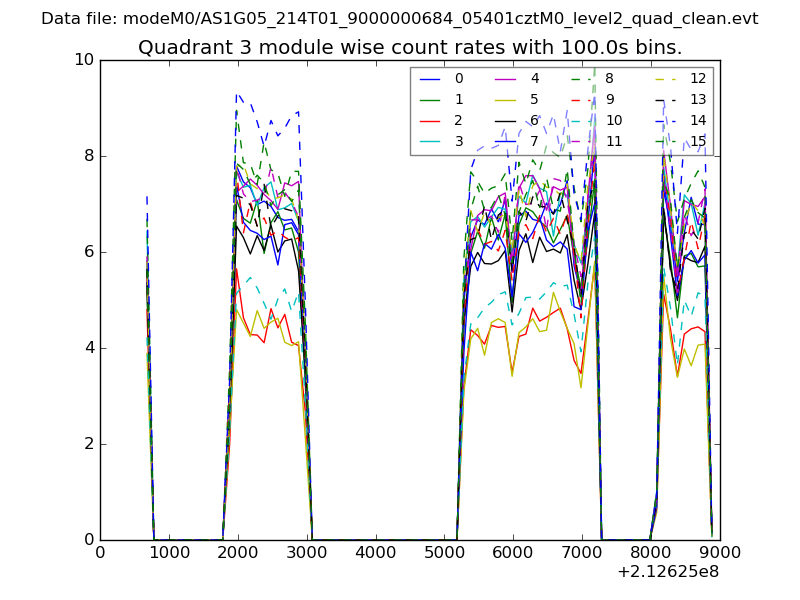 |
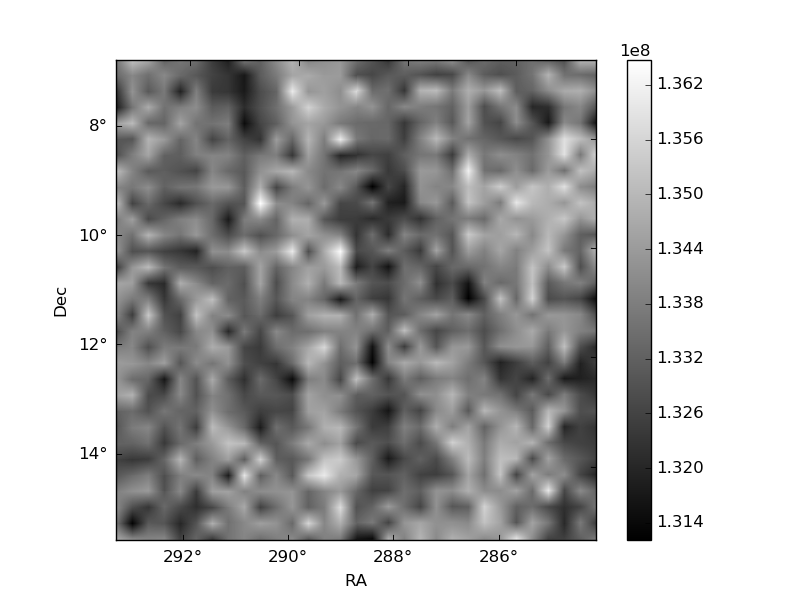 |
| Parameter | Plot |
|---|---|
| CZT HV Monitor | 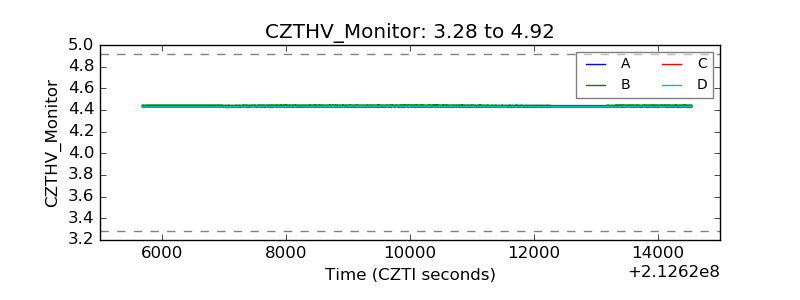 |
| D_VDD | 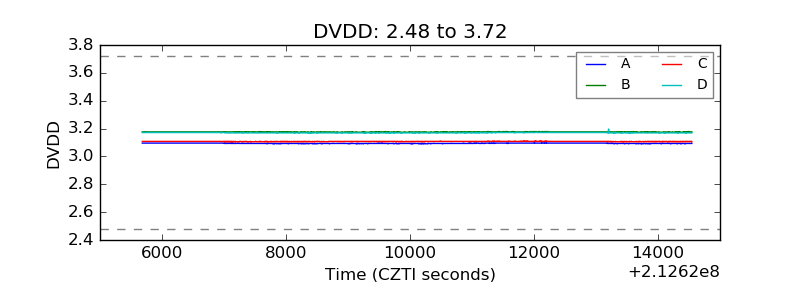 |
| Temperature 1 | 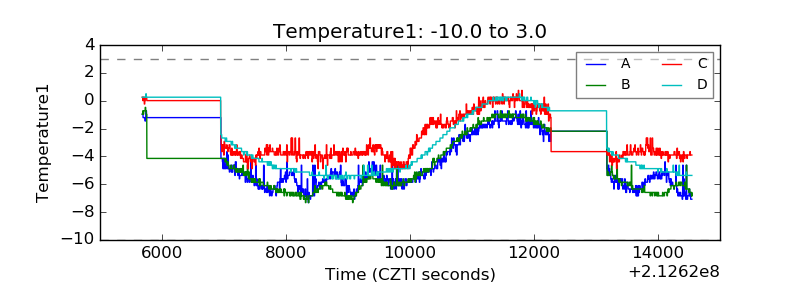 |
| Veto HV Monitor | 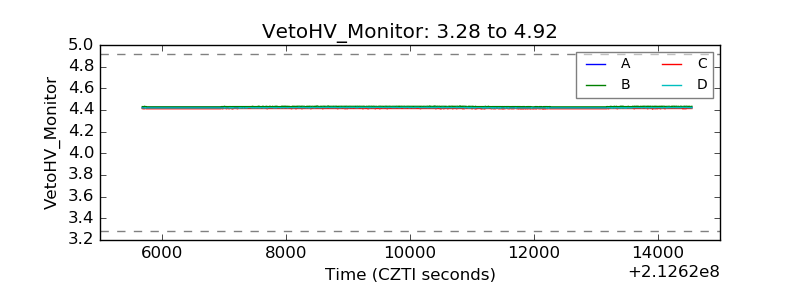 |
| Veto LLD | 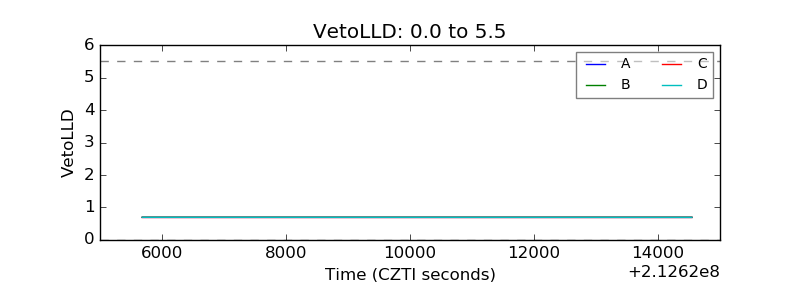 |
| Alpha Counter | 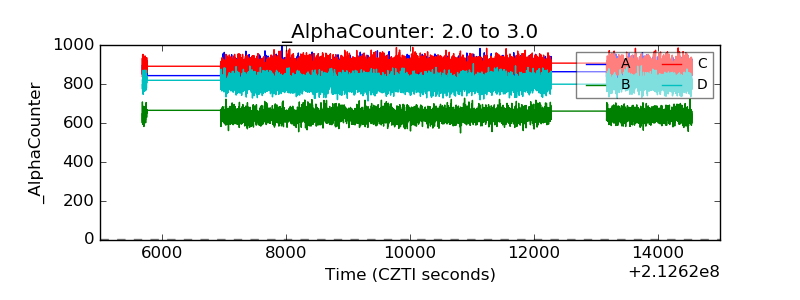 |
| _CPM_Rate | 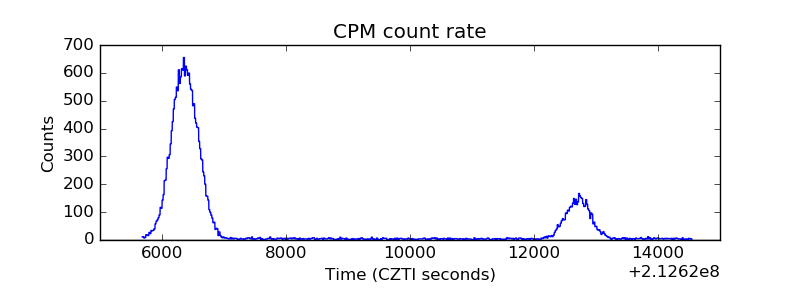 |
| CZT Counter | 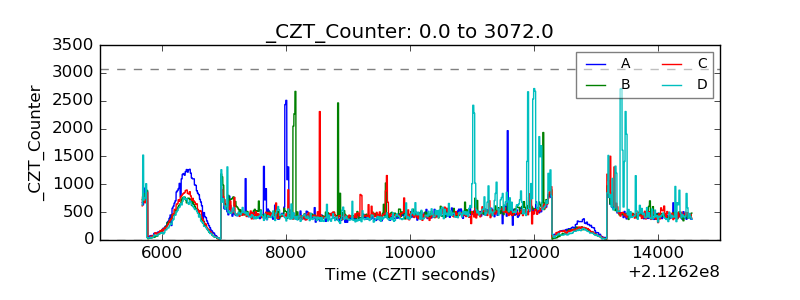 |
| +2.5 Volts monitor |  |
| +5 Volts monitor |  |
| _ROLL_ROT | 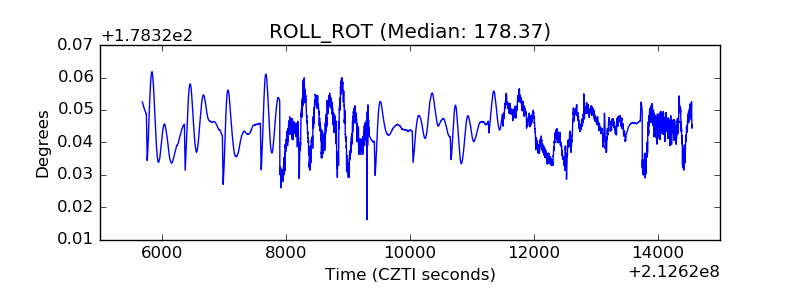 |
| _Roll_DEC | 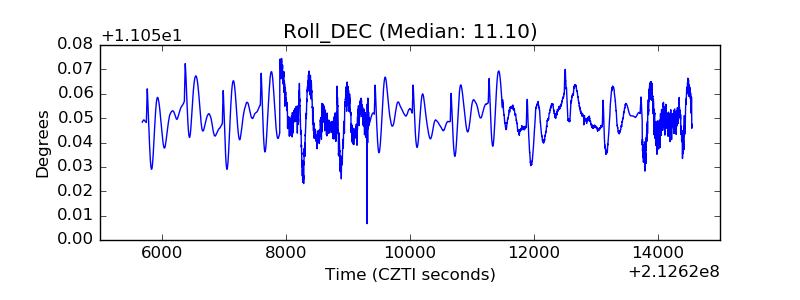 |
| _Roll_RA | 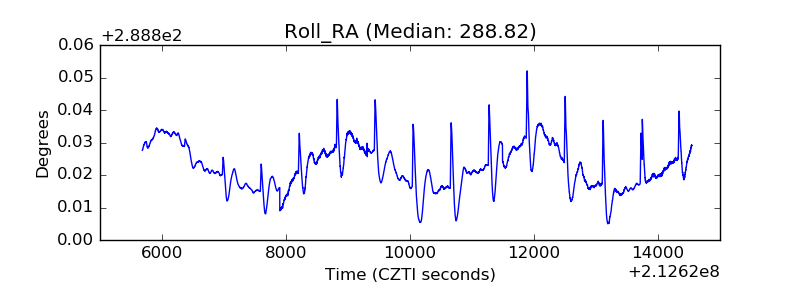 |
| Veto Counter | 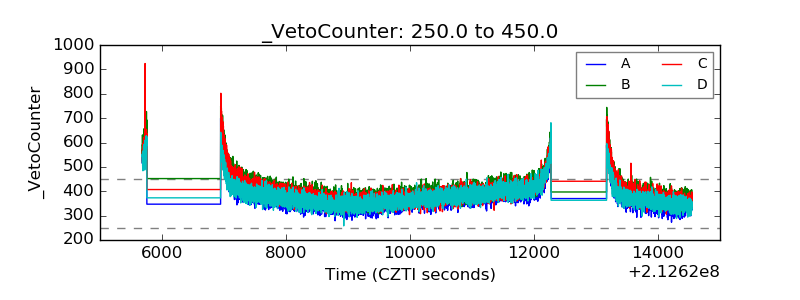 |