| Param | Original file | Final file |
|---|---|---|
| Filename | modeM0/AS1G05_214T01_9000000684_05402cztM0_level2.evt | modeM0/AS1G05_214T01_9000000684_05402cztM0_level2_quad_clean.evt |
| Size (bytes) | 573,238,080 | 71,259,840 |
| Size | 546.7 MB | 68.0 MB |
| Events in quadrant A | 3,599,493 | 416,114 |
| Events in quadrant B | 3,657,880 | 419,786 |
| Events in quadrant C | 3,565,009 | 419,535 |
| Events in quadrant D | 6,030,148 | 380,631 |
| Mode M9 | |||
|---|---|---|---|
| Quadrant | BADHDUFLAG | Total packets | Discarded packets |
| A | 0 | 7 | 0 |
| B | 0 | 7 | 0 |
| C | 0 | 7 | 0 |
| D | 0 | 8 | 0 |
| Mode SS | |||
|---|---|---|---|
| Quadrant | BADHDUFLAG | Total packets | Discarded packets |
| A | 0 | 152 | 0 |
| B | 0 | 152 | 0 |
| C | 0 | 152 | 0 |
| D | 0 | 152 | 0 |
| Mode M0 | |||
|---|---|---|---|
| Quadrant | BADHDUFLAG | Total packets | Discarded packets |
| A | 0 | 15956 | 3 |
| B | 0 | 15754 | 2 |
| C | 0 | 15677 | 2 |
| D | 0 | 23264 | 2 |
| Quadrant | Total seconds | Saturated seconds | Saturation percentage |
|---|---|---|---|
| A | 7490 | 66 | 0.881175% |
| B | 7490 | 89 | 1.188251% |
| C | 7490 | 53 | 0.707610% |
| D | 7490 | 523 | 6.982644% |
Noise dominated data is calculated using 1-second bins in cleaned event files. If a bin has >2000 counts, and if more than 50% of those come from <1% of pixels, then it is considered to be noise-dominated and hence unusable.
| Quadrant | # 1 sec bins | Bins with >0 counts | Bins with >2000 counts | High rate bins dominated by noise | Noise dominated (total time) | Noise dominated (detector-on time) | Marked lightcurve |
|---|---|---|---|---|---|---|---|
| A | 7915 | 7491 | 12 | 12 | 0.15% | 0.16% | 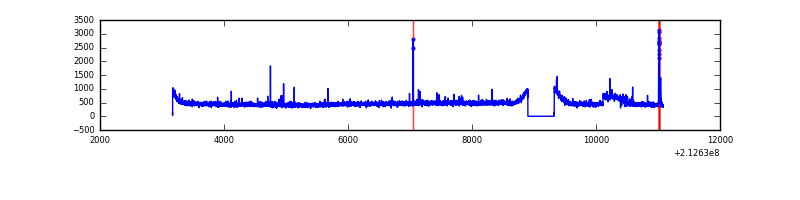 |
| B | 7915 | 7491 | 4 | 4 | 0.05% | 0.05% | 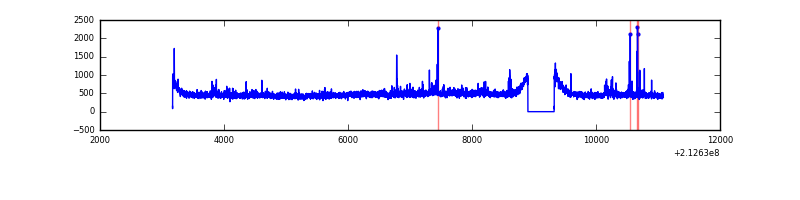 |
| C | 7915 | 7491 | 1 | 1 | 0.01% | 0.01% | 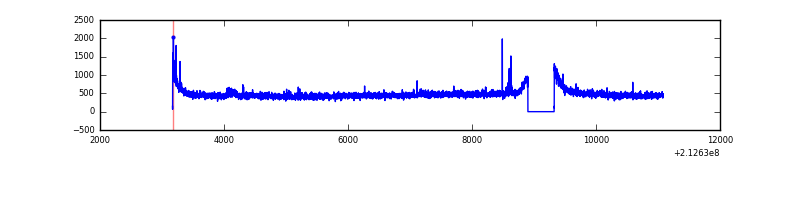 |
| D | 7915 | 7491 | 464 | 464 | 5.86% | 6.19% | 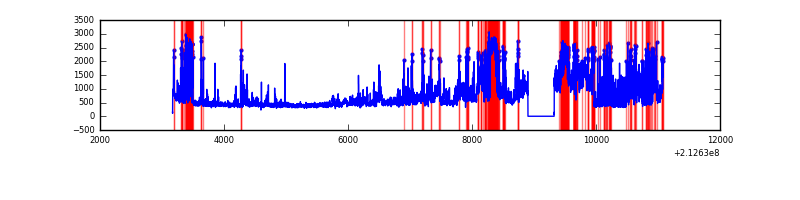 |
Top three noisy pixels from each quadrant. If the there are fewer than three noisy pixels in the level2.evt file, extra rows are filled as -1
| Pixel properties | Quadrant properties | ||||||
|---|---|---|---|---|---|---|---|
| Quadrant | DetID | PixID | Counts | Sigma | Mean | Median | Sigma |
| A | 14 | 111 | 104670 | 572.98 | 878 | 855 | 181.2 |
| A | 0 | 50 | 59108 | 321.51 | 878 | 855 | 181.2 |
| A | 0 | 247 | 29111 | 155.95 | 878 | 855 | 181.2 |
| B | 15 | 204 | 60243 | 340.62 | 895 | 872 | 174.3 |
| B | 0 | 219 | 26281 | 145.78 | 895 | 872 | 174.3 |
| B | 4 | 48 | 24669 | 136.53 | 895 | 872 | 174.3 |
| C | 1 | 16 | 166478 | 819.03 | 859 | 864 | 202.2 |
| C | 14 | 67 | 24842 | 118.58 | 859 | 864 | 202.2 |
| C | 12 | 4 | 19412 | 91.73 | 859 | 864 | 202.2 |
| D | 2 | 63 | 2662754 | 12925.72 | 832 | 805 | 205.9 |
| D | 2 | 33 | 71265 | 342.14 | 832 | 805 | 205.9 |
| D | 8 | 195 | 66475 | 318.88 | 832 | 805 | 205.9 |
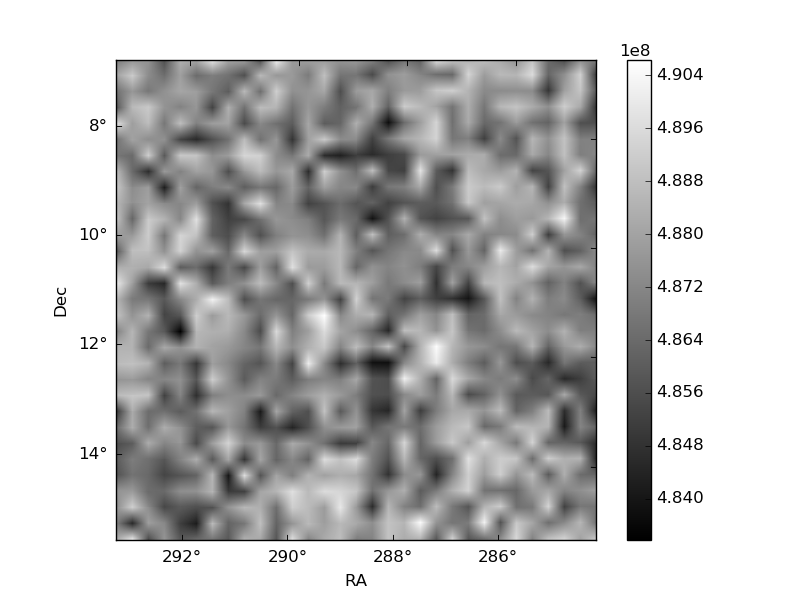
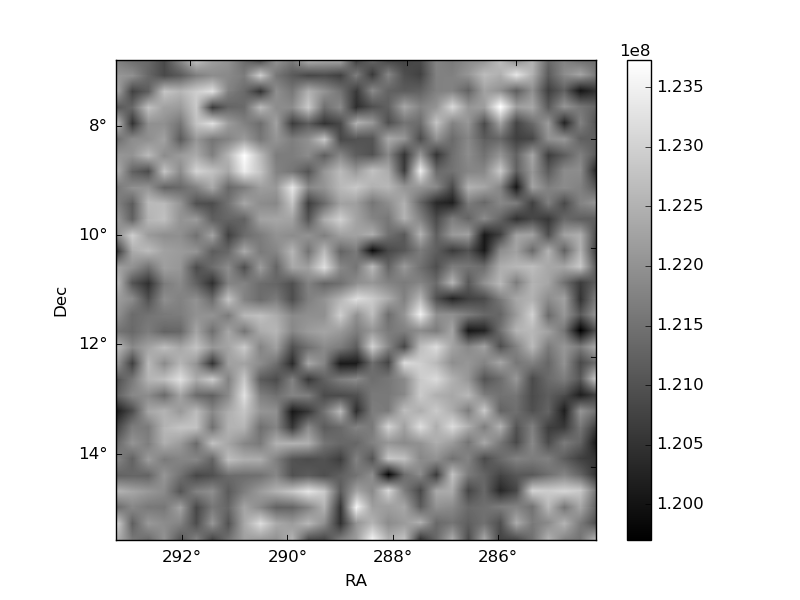
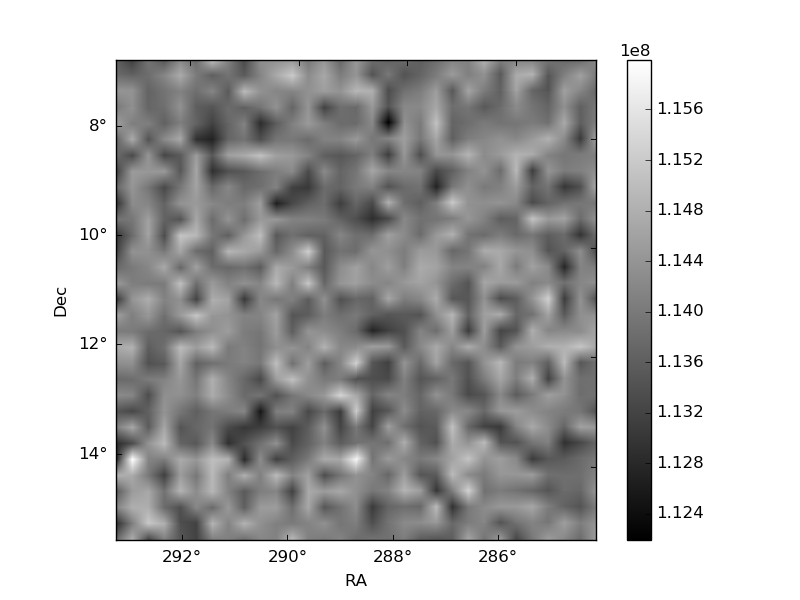
Histogram calculated using DETX and DETY for each event in the final _common_clean file
| Quadrant A |  |
 |
Quadrant B |
|---|---|---|---|
| Quadrant D |  |
 |
Quadrant C |
| Plot type | Count rate plots | Images |
|---|---|---|
| Comparison with Poisson distribution Blue bars denote a histogram of data divided into 1 sec bins. Red curve is a Poisson curve with rate = median count rate of data. |
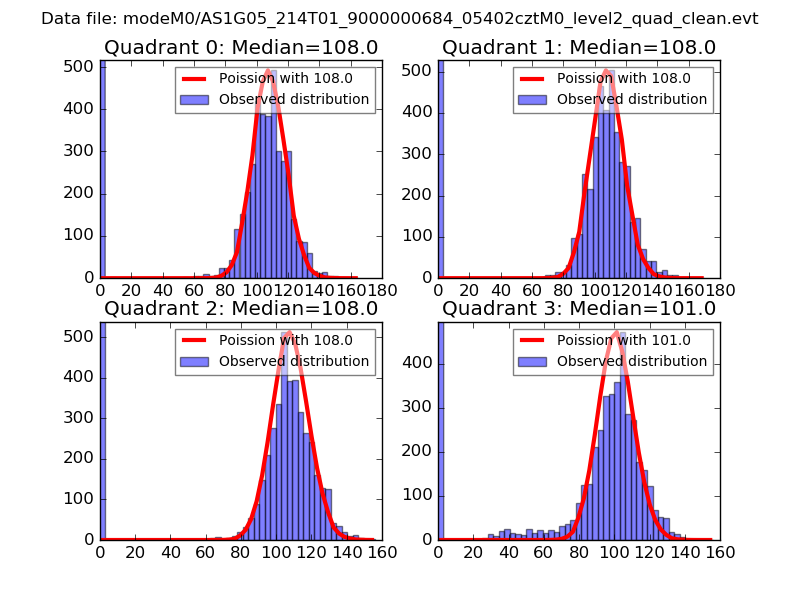 |
 |
| Quadrant-wise count rates Data is divided into 100 sec bins |
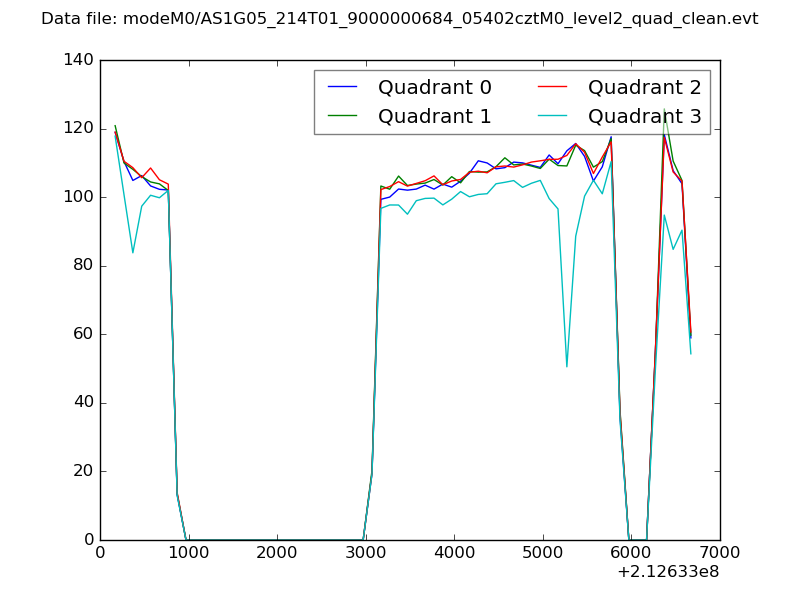 |
|
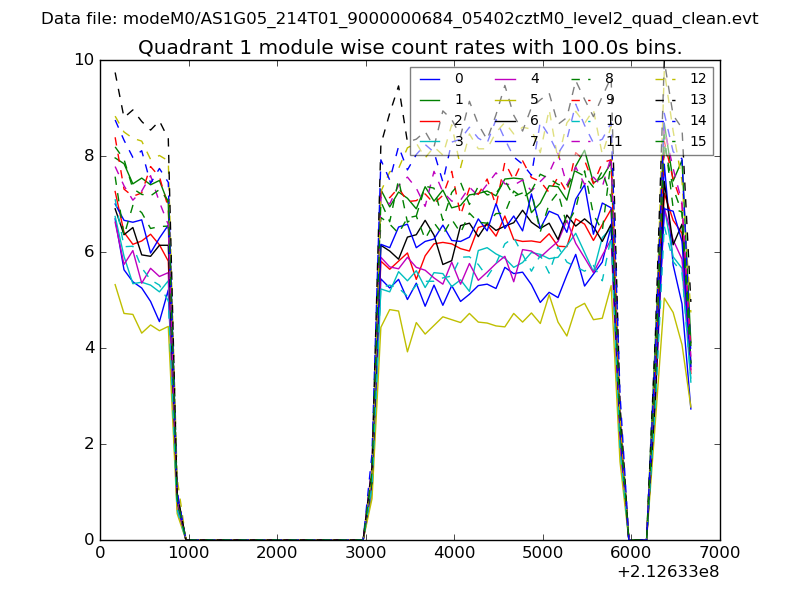
| Module-wise count rates for Quadrant A Data is divided into 100 sec bins |
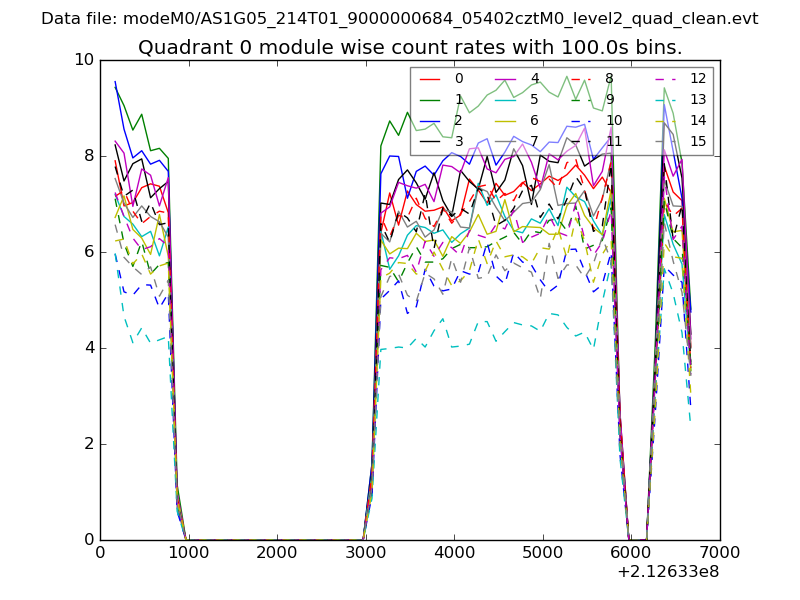 |
 |
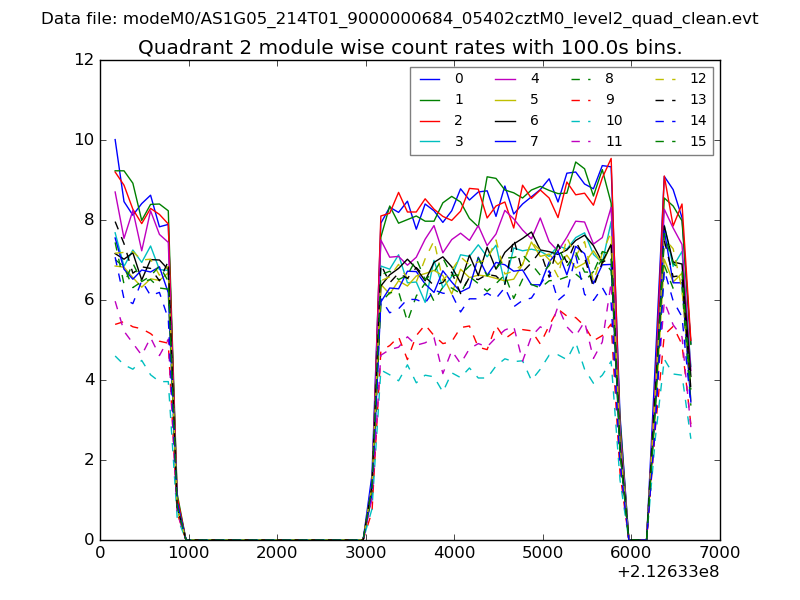
| Module-wise count rates for Quadrant B Data is divided into 100 sec bins |
 |
 |
| Module-wise count rates for Quadrant C Data is divided into 100 sec bins |
 |
 |
| Module-wise count rates for Quadrant D Data is divided into 100 sec bins |
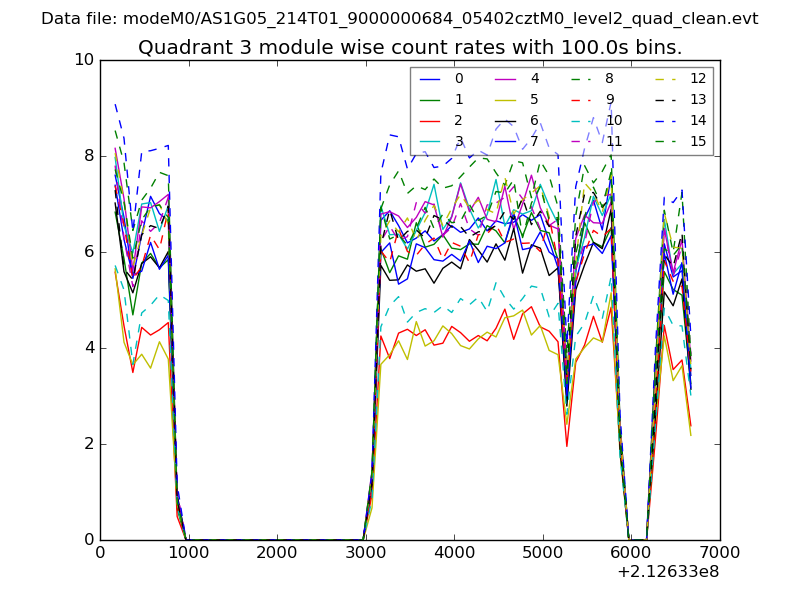 |
 |
| Parameter | Plot |
|---|---|
| CZT HV Monitor | 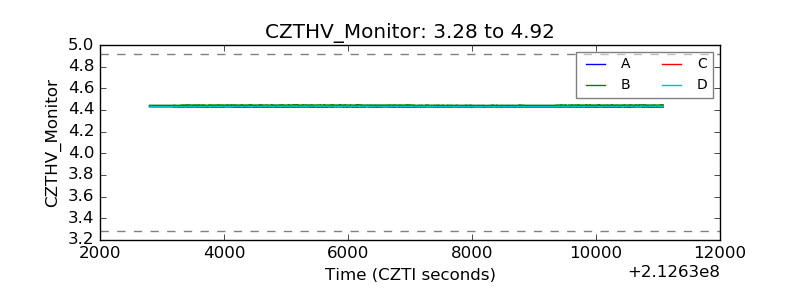 |
| D_VDD | 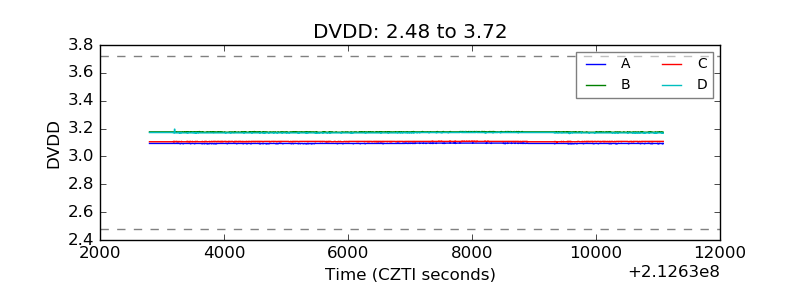 |
| Temperature 1 | 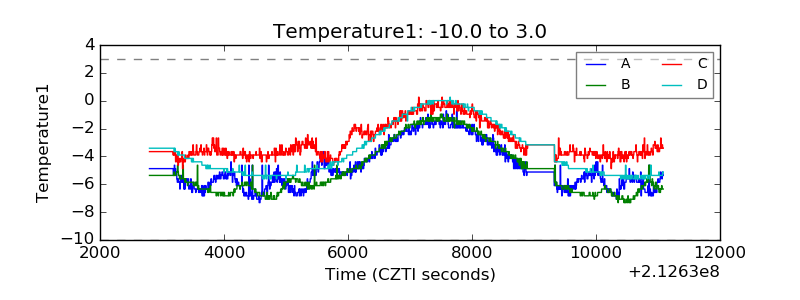 |
| Veto HV Monitor | 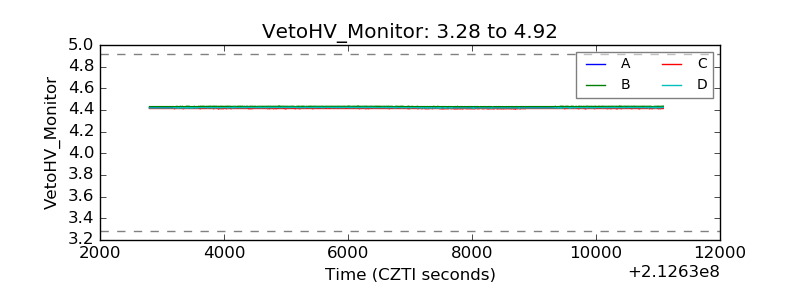 |
| Veto LLD | 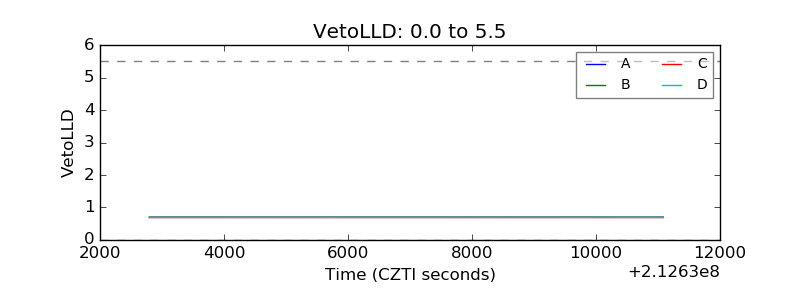 |
| Alpha Counter | 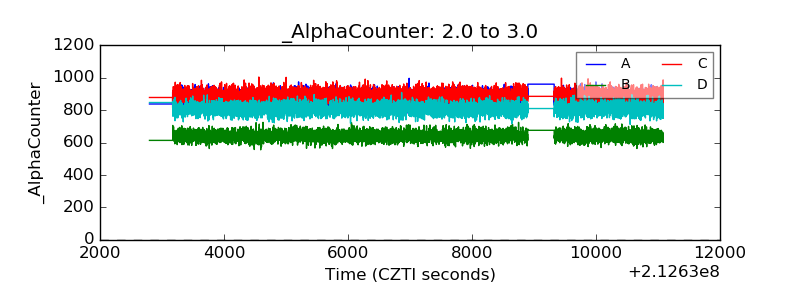 |
| _CPM_Rate | 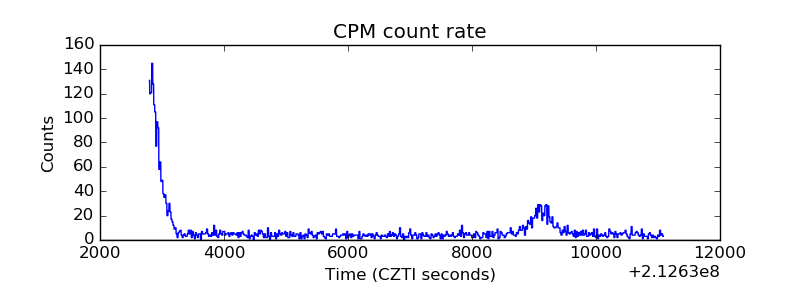 |
| CZT Counter |  |
| +2.5 Volts monitor |  |
| +5 Volts monitor |  |
| _ROLL_ROT | 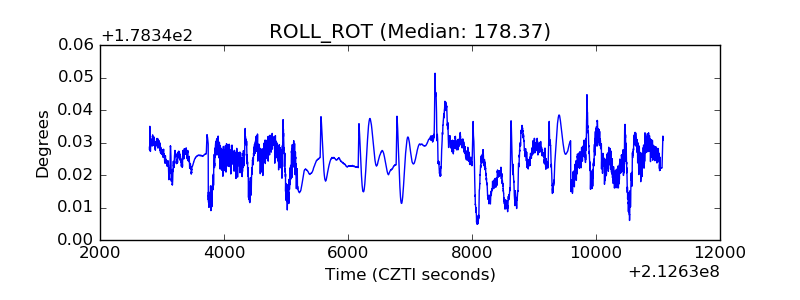 |
| _Roll_DEC | 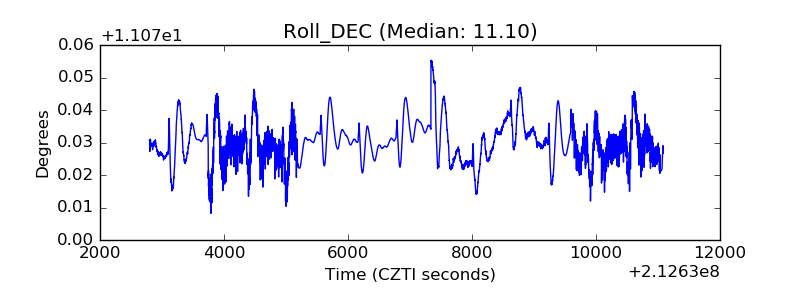 |
| _Roll_RA | 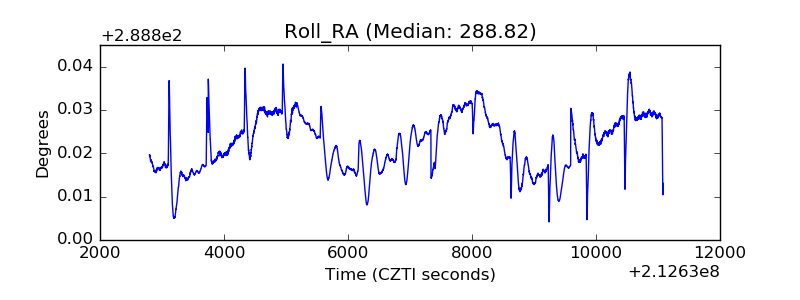 |
| Veto Counter | 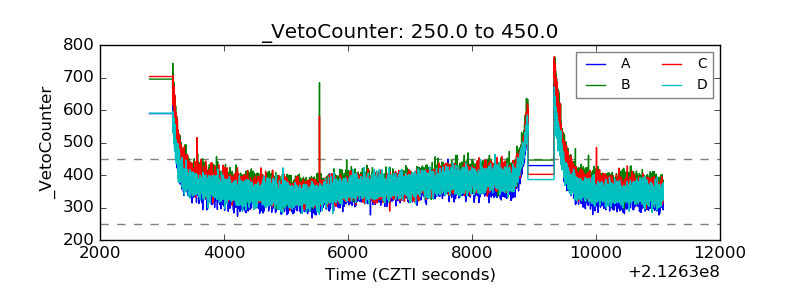 |