| Param | Original file | Final file |
|---|---|---|
| Filename | modeM0/AS1G05_214T01_9000000684_05403cztM0_level2.evt | modeM0/AS1G05_214T01_9000000684_05403cztM0_level2_quad_clean.evt |
| Size (bytes) | 641,289,600 | 71,985,600 |
| Size | 611.6 MB | 68.7 MB |
| Events in quadrant A | 3,695,270 | 424,700 |
| Events in quadrant B | 3,671,292 | 427,738 |
| Events in quadrant C | 3,561,741 | 430,680 |
| Events in quadrant D | 7,997,259 | 386,316 |
| Mode M9 | |||
|---|---|---|---|
| Quadrant | BADHDUFLAG | Total packets | Discarded packets |
| A | 0 | 1 | 0 |
| B | 0 | 1 | 0 |
| C | 0 | 1 | 0 |
| D | 0 | 2 | 0 |
| Mode SS | |||
|---|---|---|---|
| Quadrant | BADHDUFLAG | Total packets | Discarded packets |
| A | 0 | 158 | 10 |
| B | 0 | 158 | 12 |
| C | 0 | 157 | 11 |
| D | 0 | 158 | 10 |
| Mode M0 | |||
|---|---|---|---|
| Quadrant | BADHDUFLAG | Total packets | Discarded packets |
| A | 0 | 17348 | 1264 |
| B | 0 | 16941 | 1210 |
| C | 0 | 16754 | 1255 |
| D | 0 | 30465 | 1581 |
| Quadrant | Total seconds | Saturated seconds | Saturation percentage |
|---|---|---|---|
| A | 7327 | 220 | 3.002593% |
| B | 7331 | 256 | 3.492020% |
| C | 7309 | 86 | 1.176632% |
| D | 7316 | 914 | 12.493166% |
Noise dominated data is calculated using 1-second bins in cleaned event files. If a bin has >2000 counts, and if more than 50% of those come from <1% of pixels, then it is considered to be noise-dominated and hence unusable.
| Quadrant | # 1 sec bins | Bins with >0 counts | Bins with >2000 counts | High rate bins dominated by noise | Noise dominated (total time) | Noise dominated (detector-on time) | Marked lightcurve |
|---|---|---|---|---|---|---|---|
| A | 7813 | 7403 | 15 | 15 | 0.19% | 0.20% | 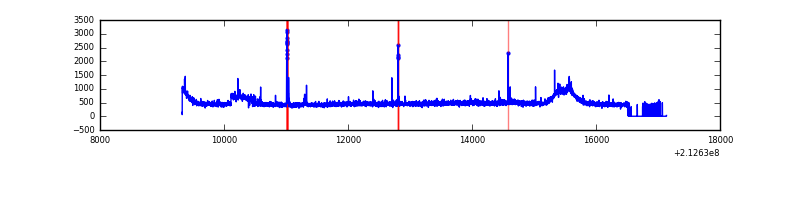 |
| B | 7839 | 7409 | 8 | 8 | 0.10% | 0.11% | 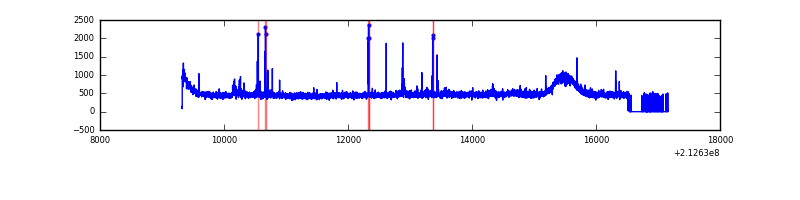 |
| C | 7837 | 7385 | 0 | 0 | 0.00% | 0.00% | 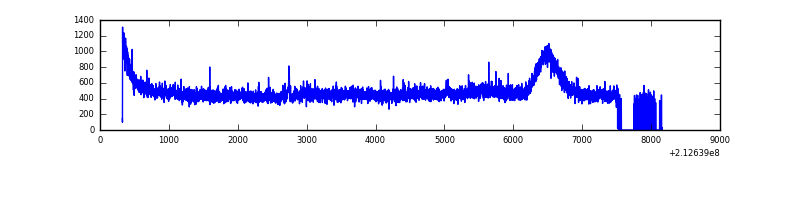 |
| D | 7810 | 7387 | 733 | 733 | 9.39% | 9.92% | 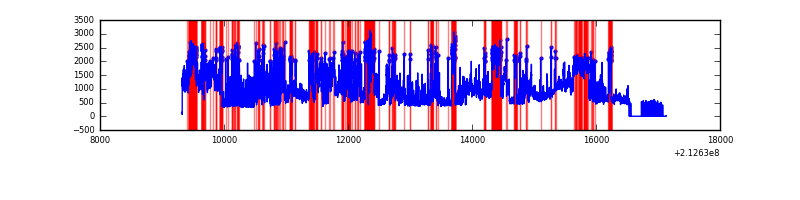 |
Top three noisy pixels from each quadrant. If the there are fewer than three noisy pixels in the level2.evt file, extra rows are filled as -1
| Pixel properties | Quadrant properties | ||||||
|---|---|---|---|---|---|---|---|
| Quadrant | DetID | PixID | Counts | Sigma | Mean | Median | Sigma |
| A | 14 | 111 | 134368 | 724.13 | 892 | 871 | 184.4 |
| A | 0 | 50 | 82214 | 441.23 | 892 | 871 | 184.4 |
| A | 15 | 174 | 18431 | 95.25 | 892 | 871 | 184.4 |
| B | 15 | 204 | 45512 | 248.94 | 907 | 882 | 179.3 |
| B | 0 | 228 | 34634 | 188.27 | 907 | 882 | 179.3 |
| B | 4 | 48 | 25988 | 140.04 | 907 | 882 | 179.3 |
| C | 1 | 16 | 124022 | 597.41 | 870 | 875 | 206.1 |
| C | 14 | 67 | 21992 | 102.44 | 870 | 875 | 206.1 |
| C | 4 | 238 | 9883 | 43.7 | 870 | 875 | 206.1 |
| D | 2 | 63 | 4328506 | 20815.49 | 840 | 815 | 207.9 |
| D | 2 | 152 | 172720 | 826.83 | 840 | 815 | 207.9 |
| D | 2 | 33 | 64321 | 305.45 | 840 | 815 | 207.9 |
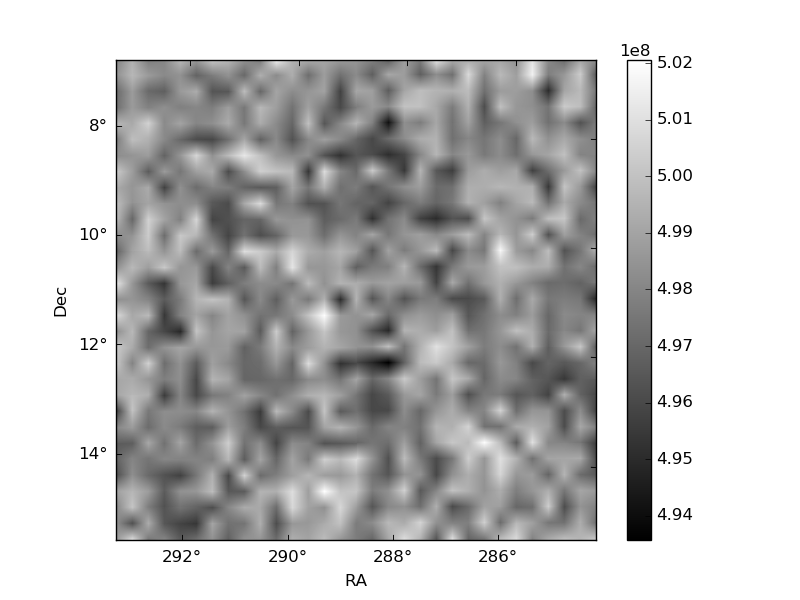
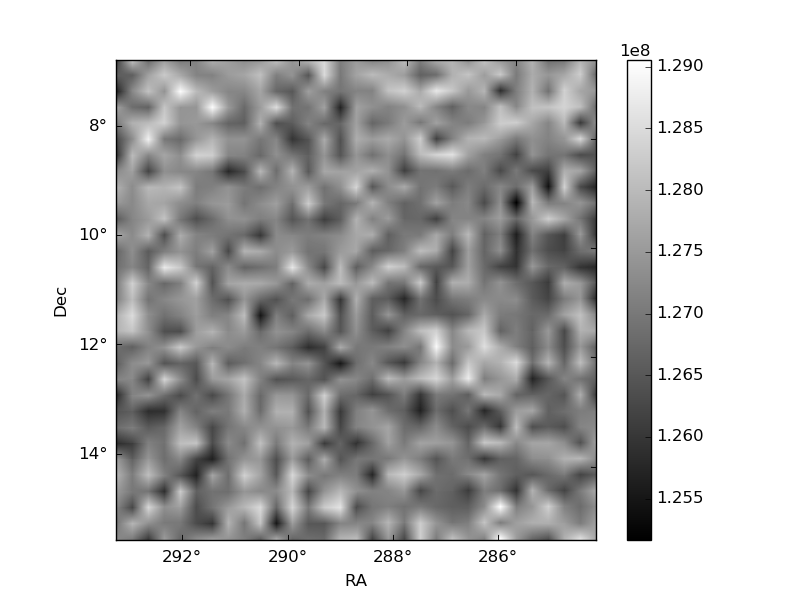
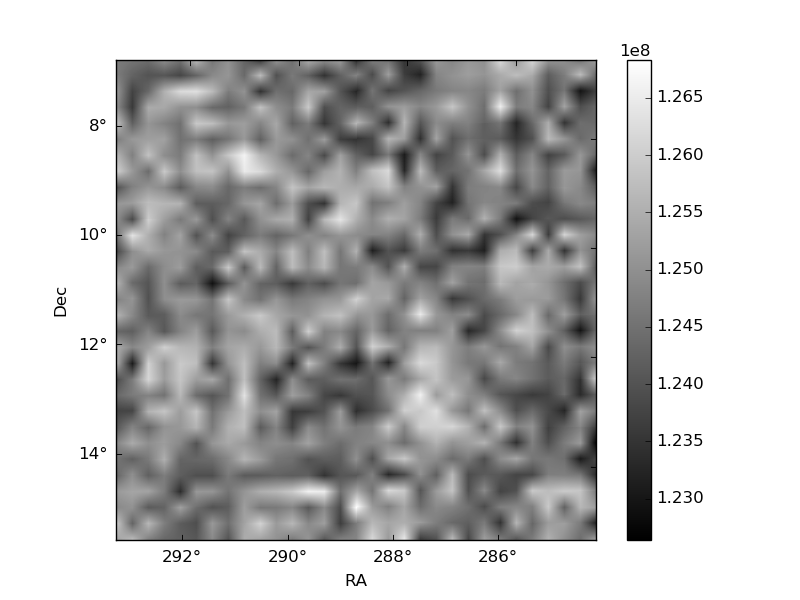
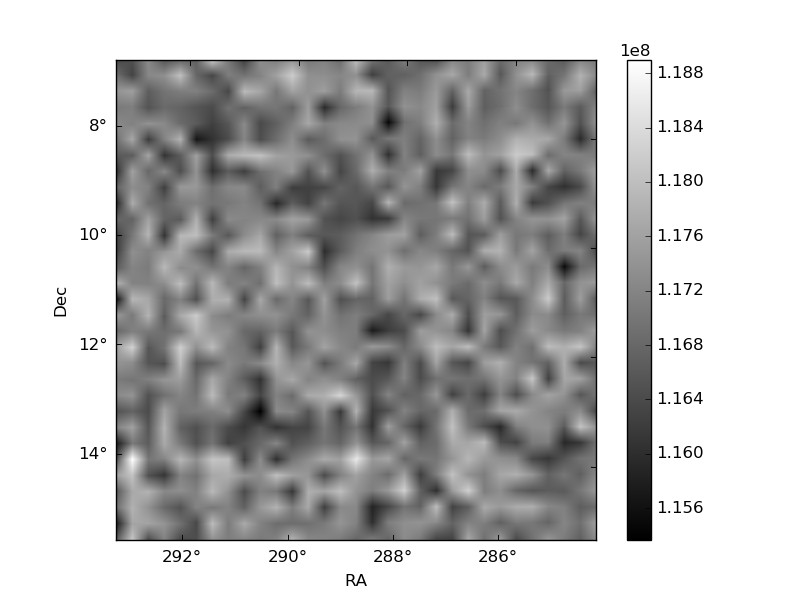
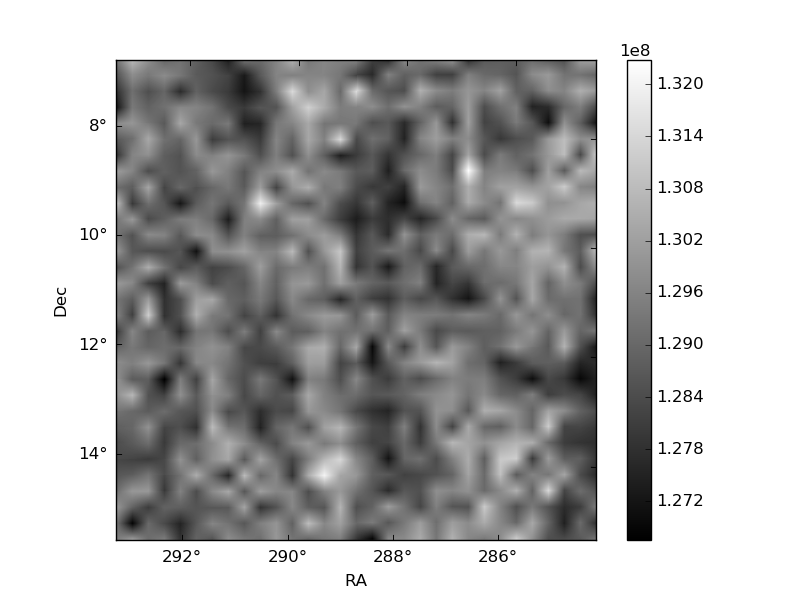
Histogram calculated using DETX and DETY for each event in the final _common_clean file
| Quadrant A | 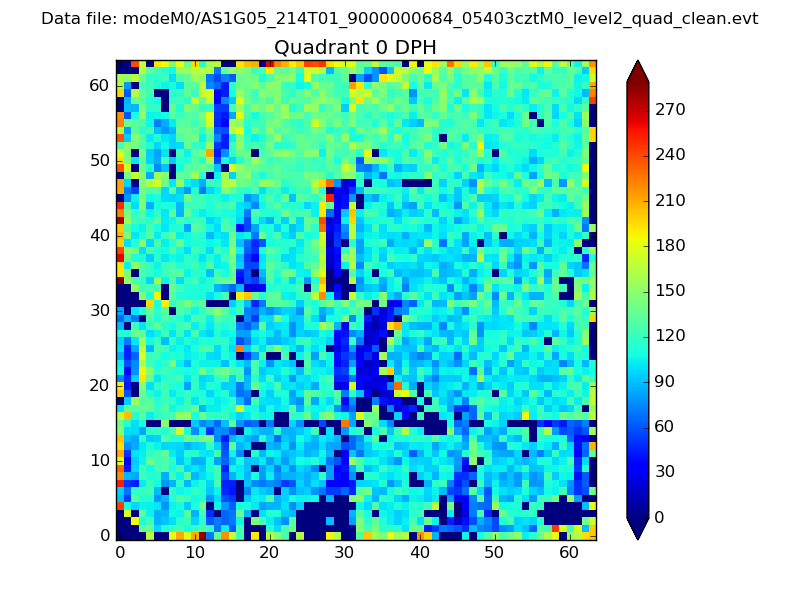 |
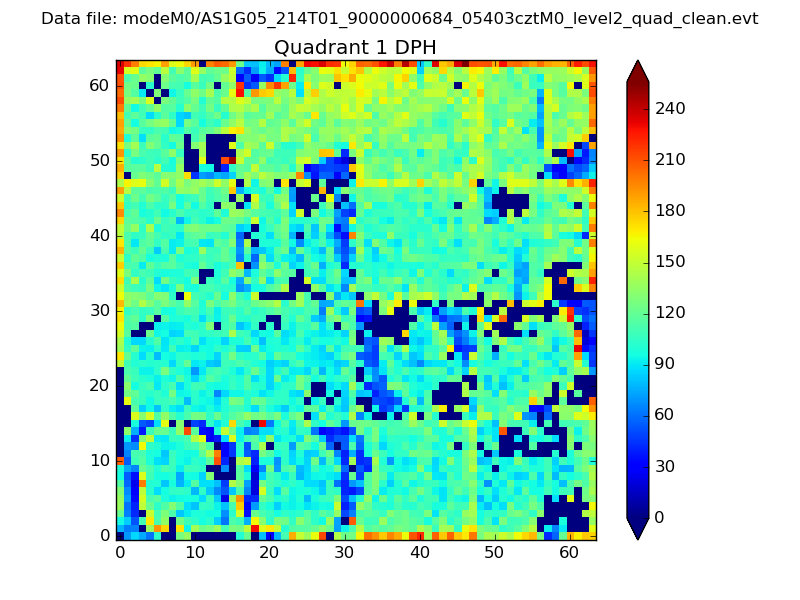 |
Quadrant B |
|---|---|---|---|
| Quadrant D | 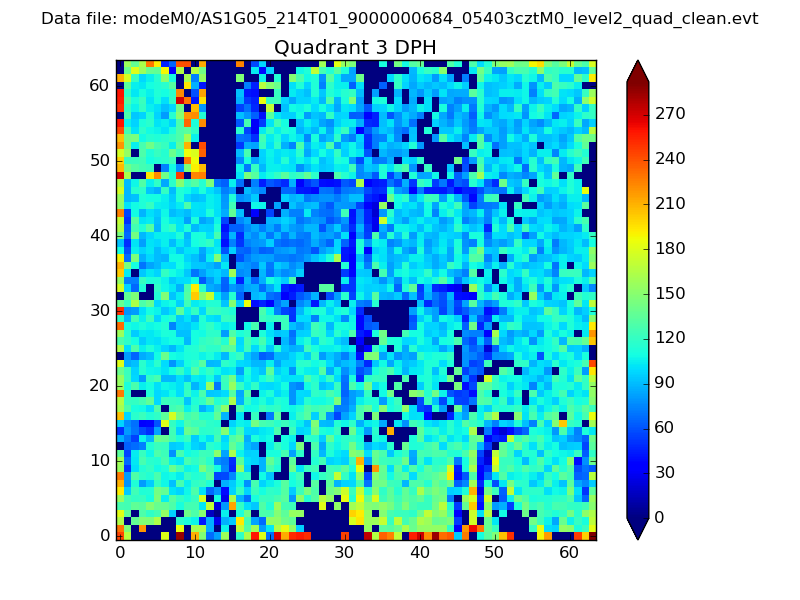 |
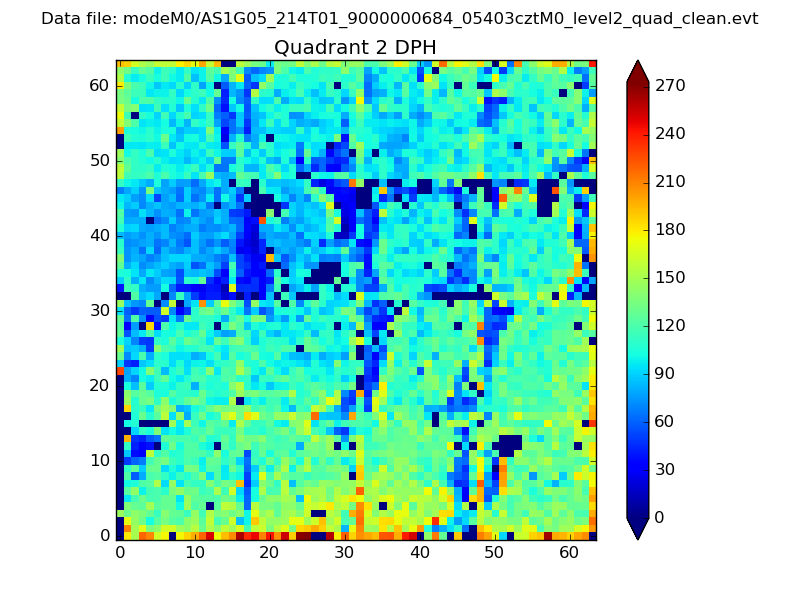 |
Quadrant C |
| Plot type | Count rate plots | Images |
|---|---|---|
| Comparison with Poisson distribution Blue bars denote a histogram of data divided into 1 sec bins. Red curve is a Poisson curve with rate = median count rate of data. |
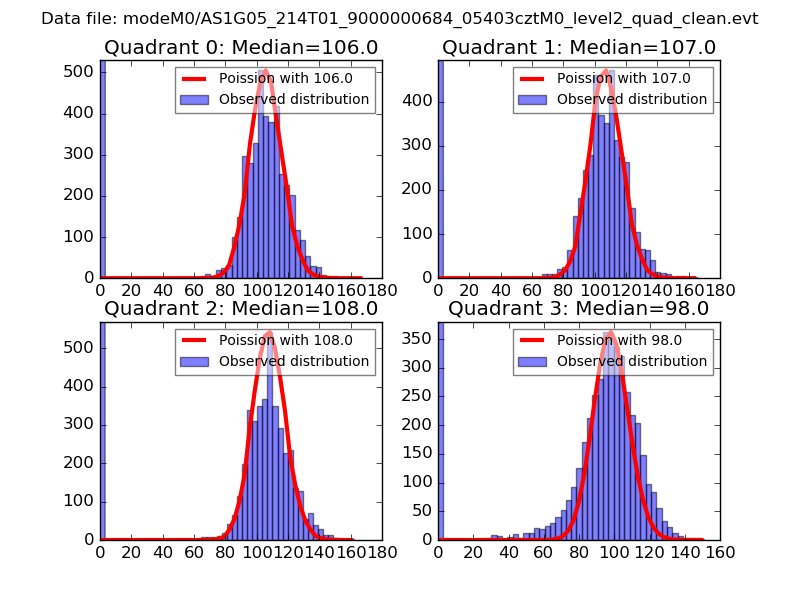 |
 |
| Quadrant-wise count rates Data is divided into 100 sec bins |
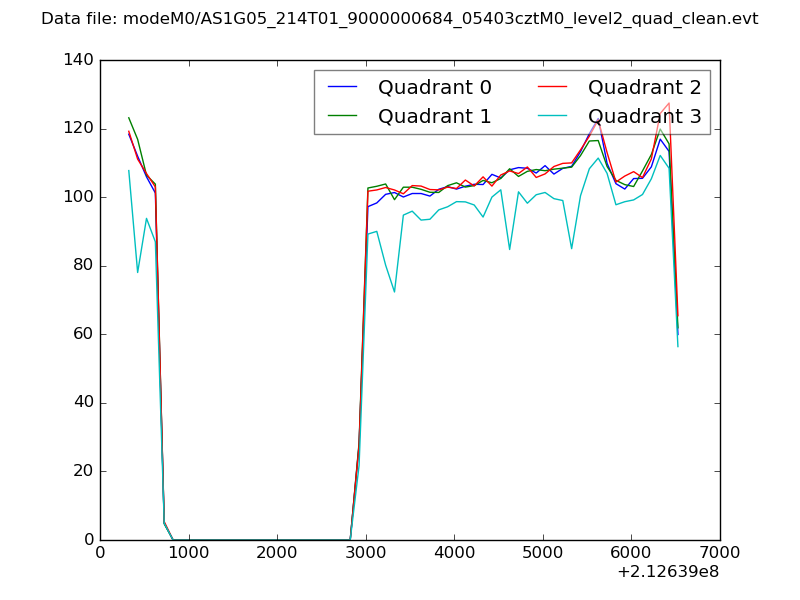 |
|
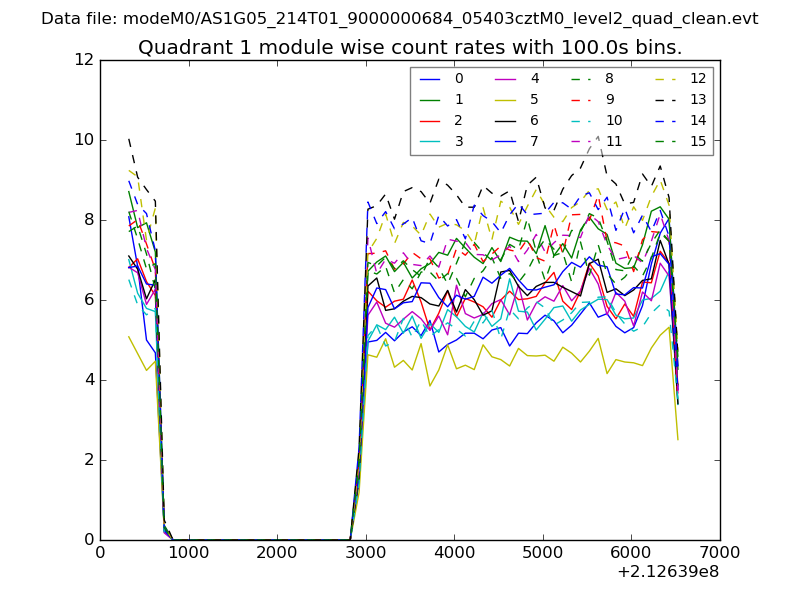
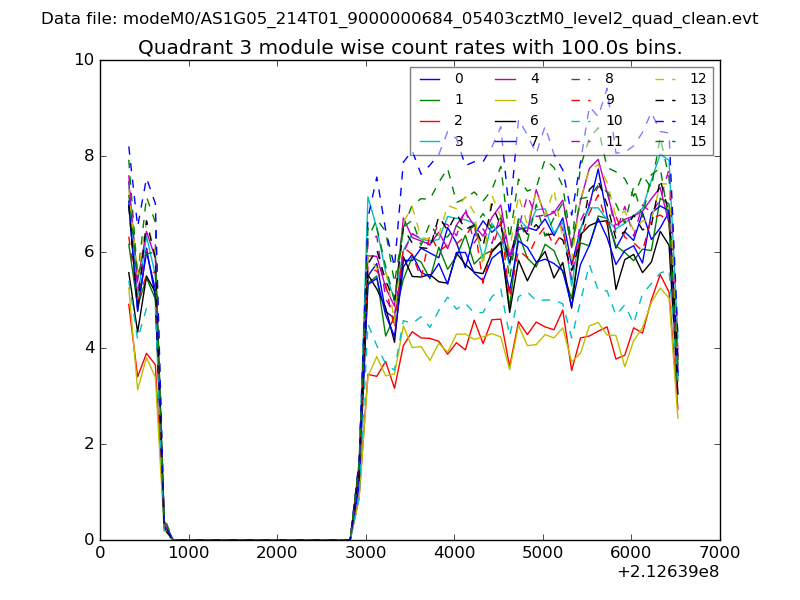
| Module-wise count rates for Quadrant A Data is divided into 100 sec bins |
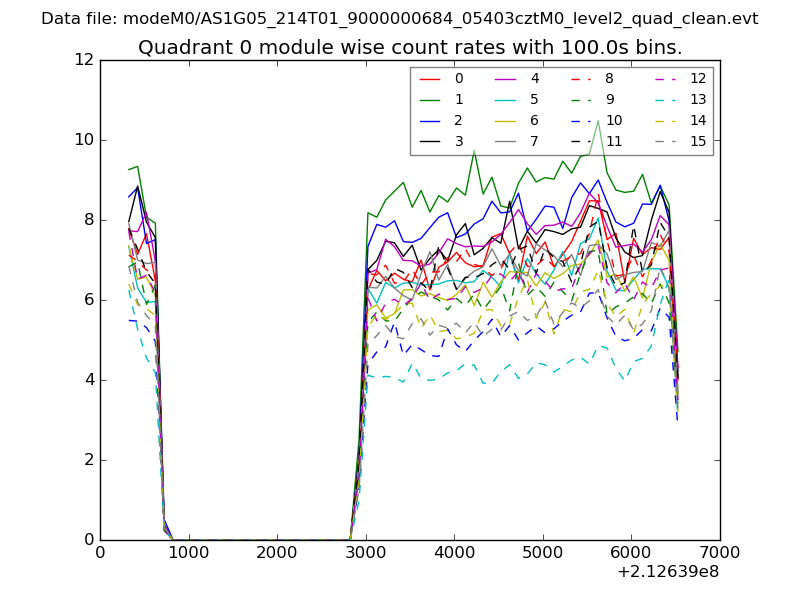 |
 |
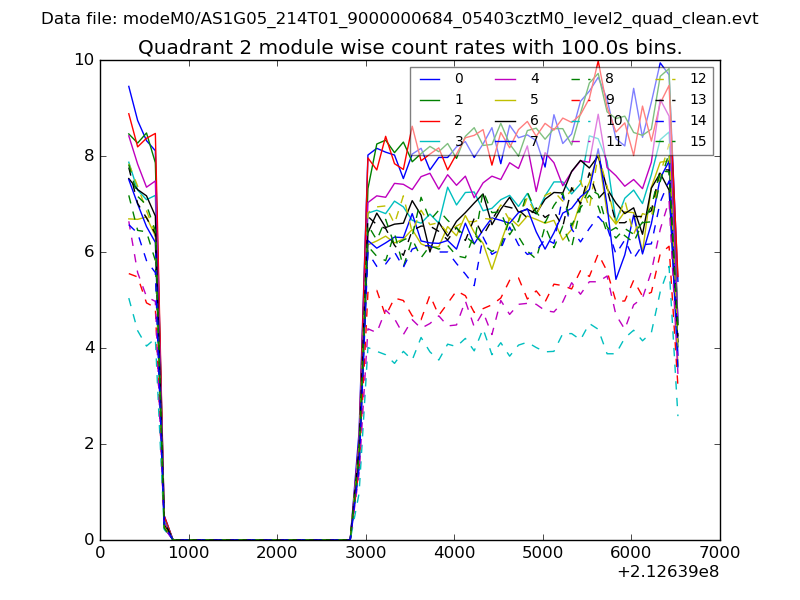
| Module-wise count rates for Quadrant B Data is divided into 100 sec bins |
 |
 |
| Module-wise count rates for Quadrant C Data is divided into 100 sec bins |
 |
 |
| Module-wise count rates for Quadrant D Data is divided into 100 sec bins |
 |
 |
| Parameter | Plot |
|---|---|
| CZT HV Monitor | 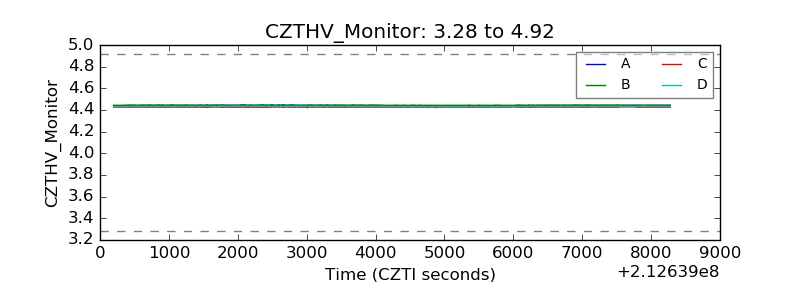 |
| D_VDD | 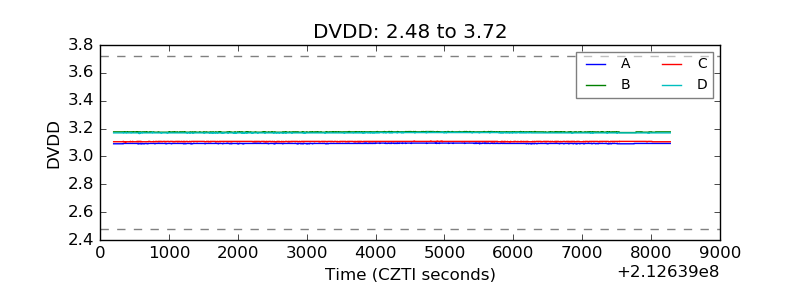 |
| Temperature 1 | 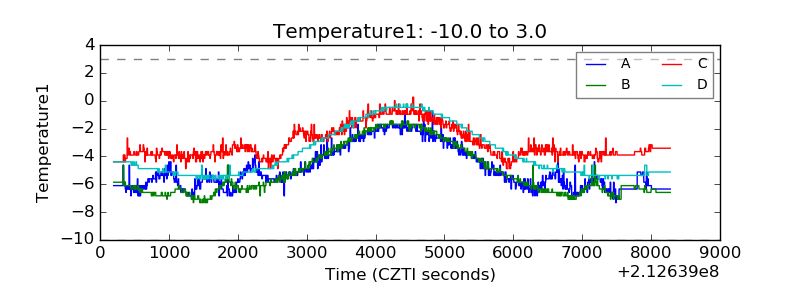 |
| Veto HV Monitor | 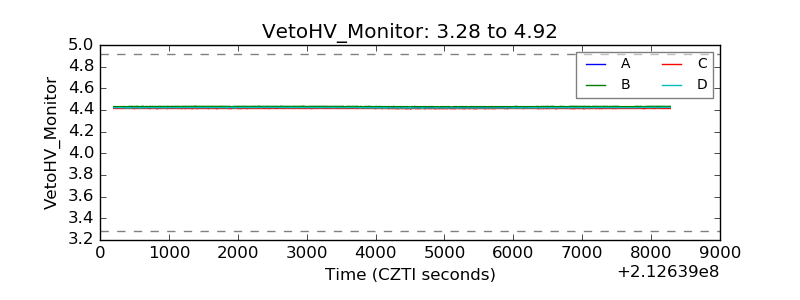 |
| Veto LLD | 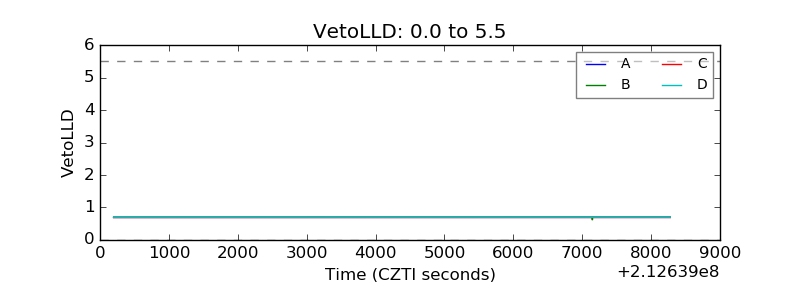 |
| Alpha Counter | 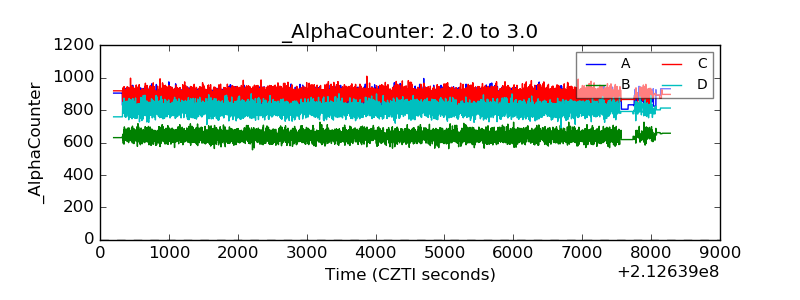 |
| _CPM_Rate | 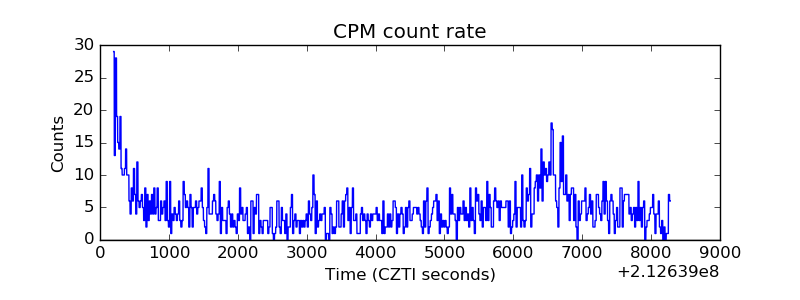 |
| CZT Counter | 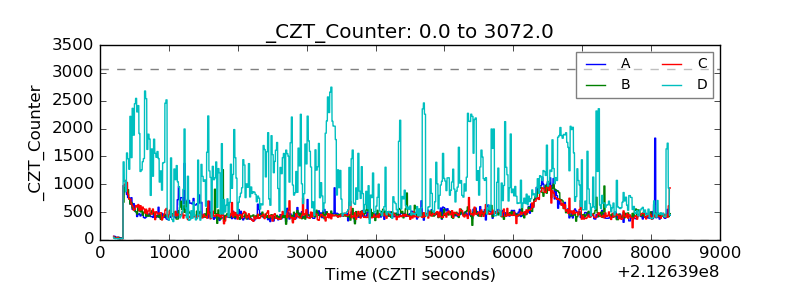 |
| +2.5 Volts monitor | 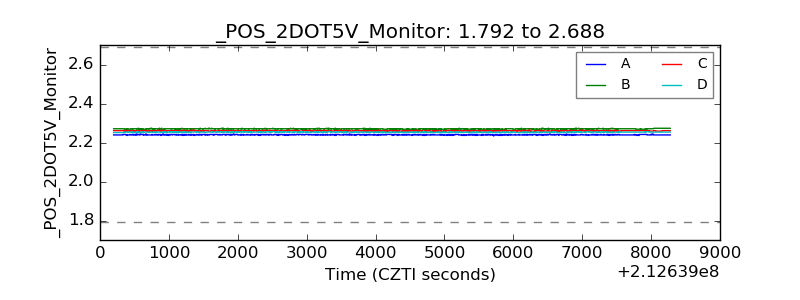 |
| +5 Volts monitor | 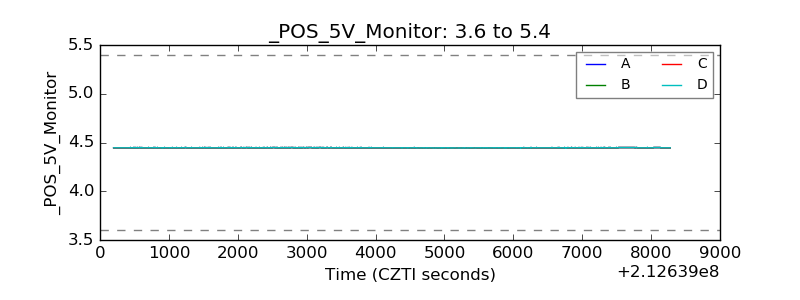 |
| _ROLL_ROT | 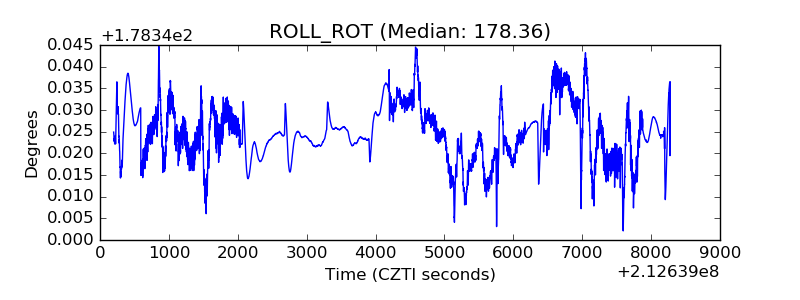 |
| _Roll_DEC | 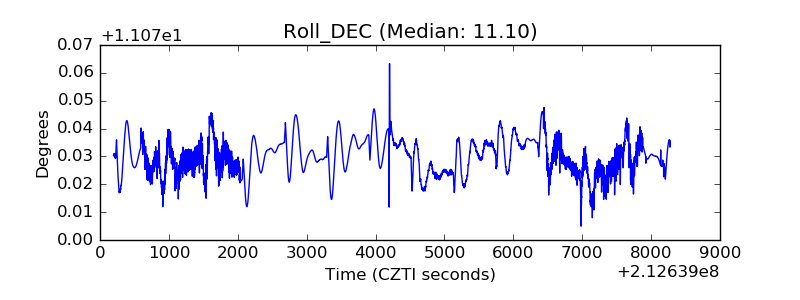 |
| _Roll_RA | 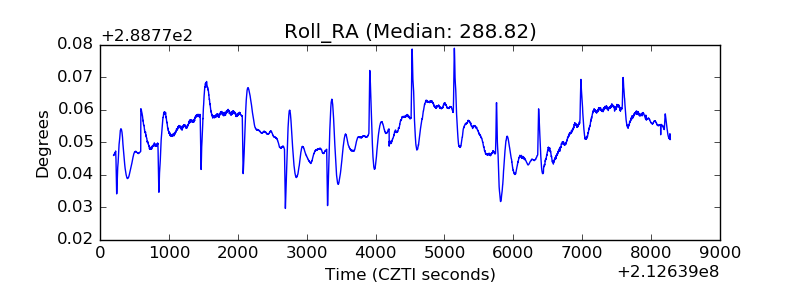 |
| Veto Counter | 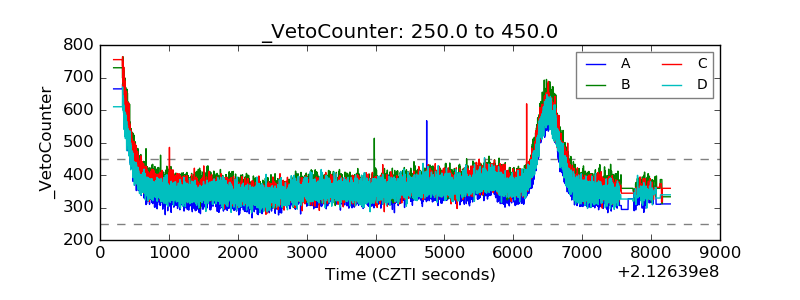 |