| Param | Original file | Final file |
|---|---|---|
| Filename | modeM0/AS1G05_214T01_9000000684_05404cztM0_level2.evt | modeM0/AS1G05_214T01_9000000684_05404cztM0_level2_quad_clean.evt |
| Size (bytes) | 685,183,680 | 79,830,720 |
| Size | 653.4 MB | 76.1 MB |
| Events in quadrant A | 4,241,286 | 458,999 |
| Events in quadrant B | 4,315,329 | 460,553 |
| Events in quadrant C | 4,207,233 | 464,981 |
| Events in quadrant D | 7,397,259 | 428,223 |
| Mode M9 | |||
|---|---|---|---|
| Quadrant | BADHDUFLAG | Total packets | Discarded packets |
| A | 0 | 1 | 0 |
| B | 0 | 1 | 0 |
| C | 0 | 1 | 0 |
| D | 0 | 1 | 0 |
| Mode SS | |||
|---|---|---|---|
| Quadrant | BADHDUFLAG | Total packets | Discarded packets |
| A | 0 | 176 | 0 |
| B | 0 | 176 | 0 |
| C | 0 | 176 | 0 |
| D | 0 | 176 | 0 |
| Mode M0 | |||
|---|---|---|---|
| Quadrant | BADHDUFLAG | Total packets | Discarded packets |
| A | 0 | 18604 | 3 |
| B | 0 | 18585 | 2 |
| C | 0 | 18543 | 2 |
| D | 0 | 27928 | 2 |
| Quadrant | Total seconds | Saturated seconds | Saturation percentage |
|---|---|---|---|
| A | 8701 | 404 | 4.643144% |
| B | 8701 | 446 | 5.125848% |
| C | 8701 | 227 | 2.608896% |
| D | 8701 | 883 | 10.148259% |
Noise dominated data is calculated using 1-second bins in cleaned event files. If a bin has >2000 counts, and if more than 50% of those come from <1% of pixels, then it is considered to be noise-dominated and hence unusable.
| Quadrant | # 1 sec bins | Bins with >0 counts | Bins with >2000 counts | High rate bins dominated by noise | Noise dominated (total time) | Noise dominated (detector-on time) | Marked lightcurve |
|---|---|---|---|---|---|---|---|
| A | 8766 | 8703 | 2 | 2 | 0.02% | 0.02% | 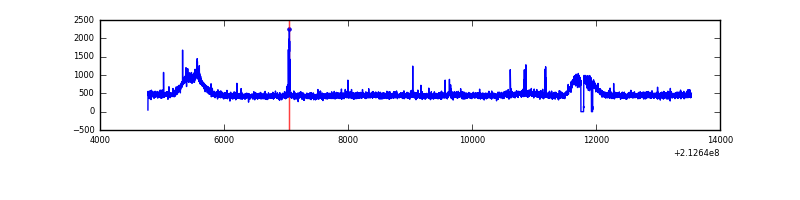 |
| B | 8766 | 8703 | 0 | 0 | 0.00% | 0.00% | 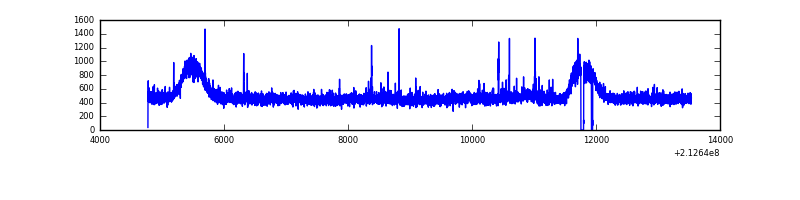 |
| C | 8766 | 8703 | 0 | 0 | 0.00% | 0.00% | 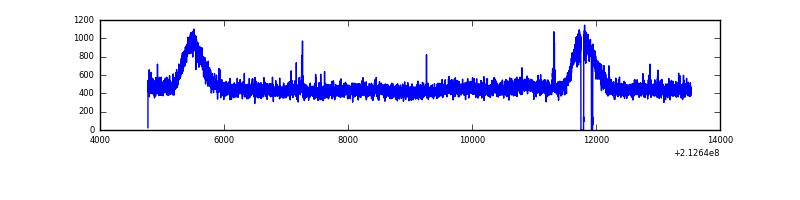 |
| D | 8766 | 8703 | 534 | 534 | 6.09% | 6.14% | 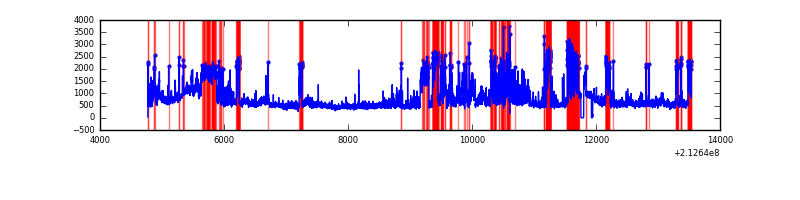 |
Top three noisy pixels from each quadrant. If the there are fewer than three noisy pixels in the level2.evt file, extra rows are filled as -1
| Pixel properties | Quadrant properties | ||||||
|---|---|---|---|---|---|---|---|
| Quadrant | DetID | PixID | Counts | Sigma | Mean | Median | Sigma |
| A | 0 | 50 | 39314 | 171.14 | 1073 | 1046 | 223.6 |
| A | 0 | 247 | 23335 | 99.68 | 1073 | 1046 | 223.6 |
| A | 15 | 174 | 17160 | 72.06 | 1073 | 1046 | 223.6 |
| B | 15 | 204 | 32126 | 143.68 | 1089 | 1062 | 216.2 |
| B | 0 | 219 | 21487 | 94.47 | 1089 | 1062 | 216.2 |
| B | 12 | 111 | 20507 | 89.94 | 1089 | 1062 | 216.2 |
| C | 1 | 16 | 64821 | 254.99 | 1053 | 1057 | 250.1 |
| C | 9 | 247 | 18361 | 69.2 | 1053 | 1057 | 250.1 |
| C | 14 | 67 | 17609 | 66.19 | 1053 | 1057 | 250.1 |
| D | 2 | 63 | 2623630 | 10445.18 | 1007 | 973 | 251.1 |
| D | 2 | 152 | 369757 | 1468.75 | 1007 | 973 | 251.1 |
| D | 2 | 136 | 274825 | 1090.66 | 1007 | 973 | 251.1 |
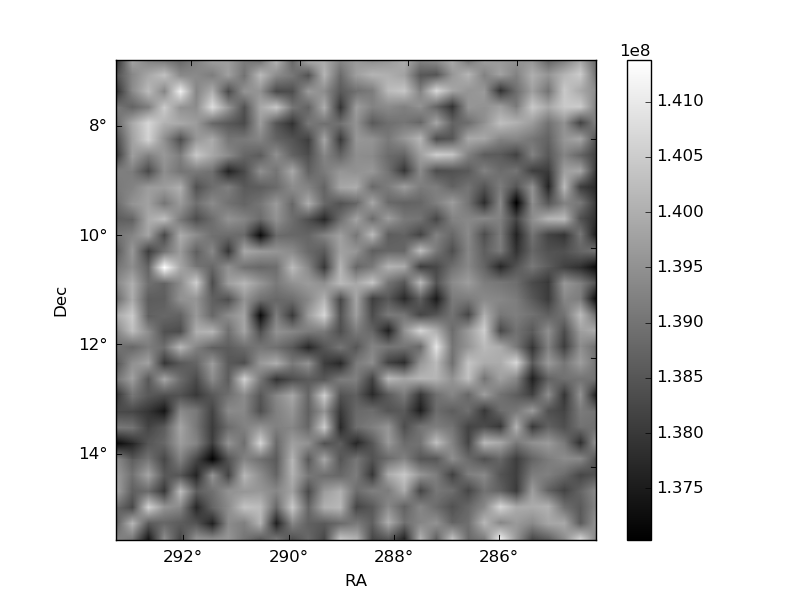
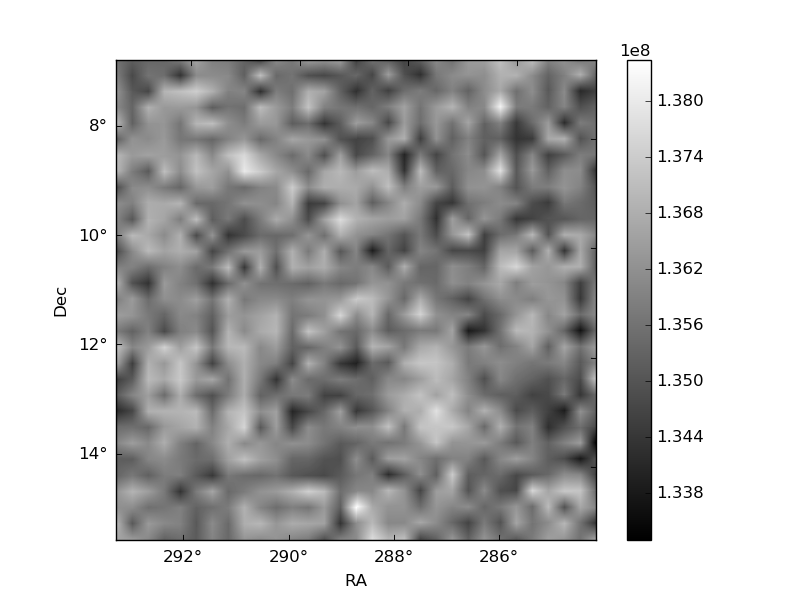
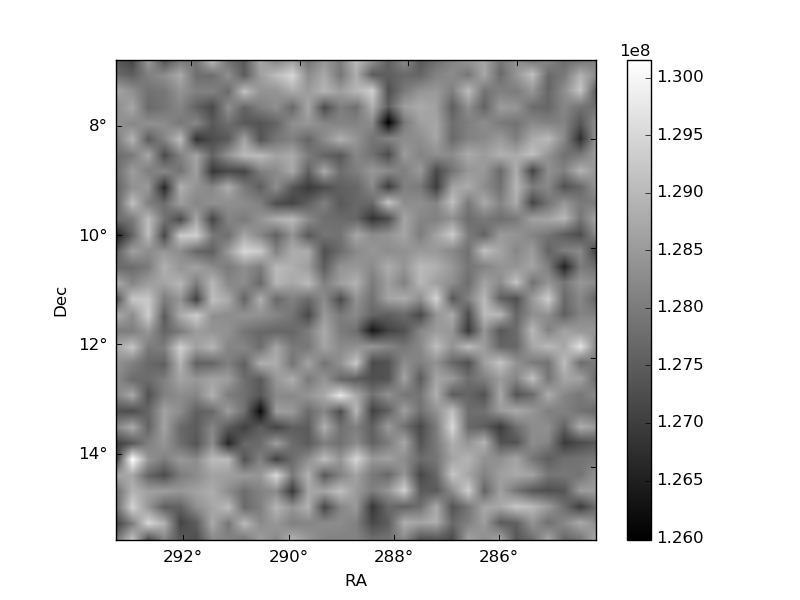
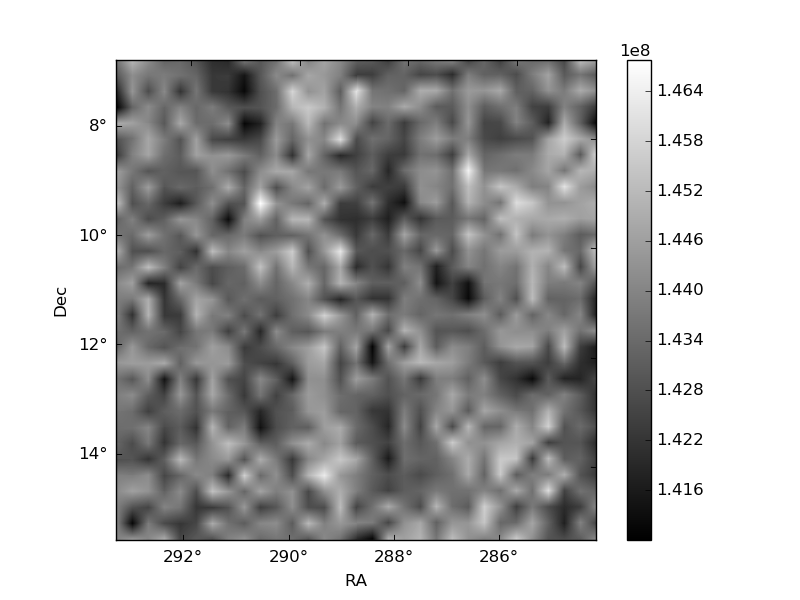
Histogram calculated using DETX and DETY for each event in the final _common_clean file
| Quadrant A | 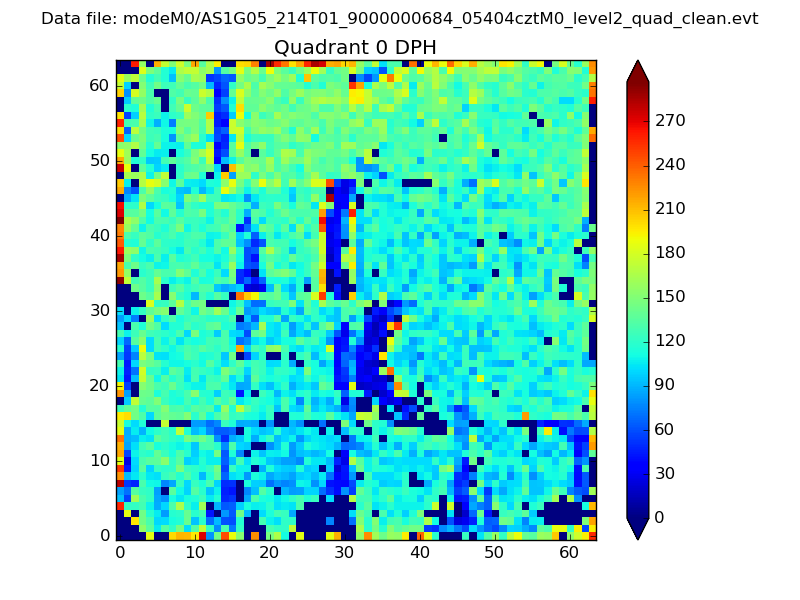 |
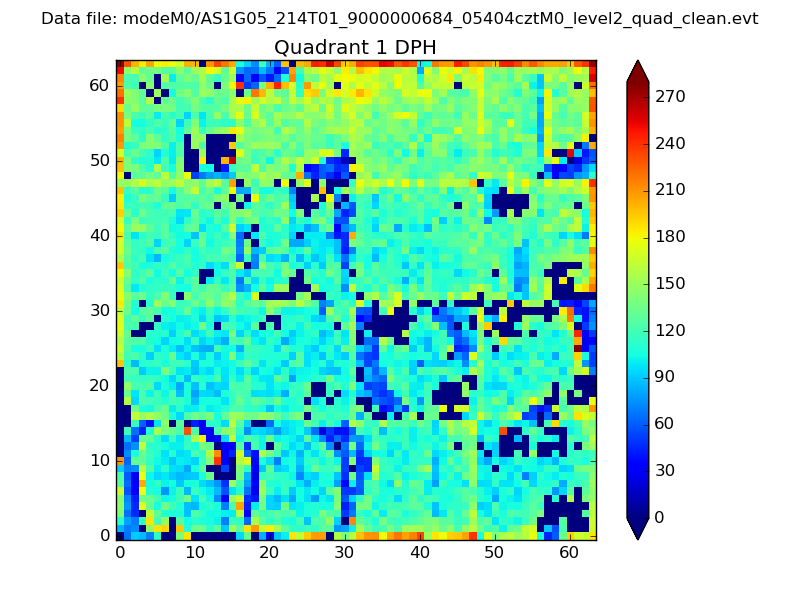 |
Quadrant B |
|---|---|---|---|
| Quadrant D | 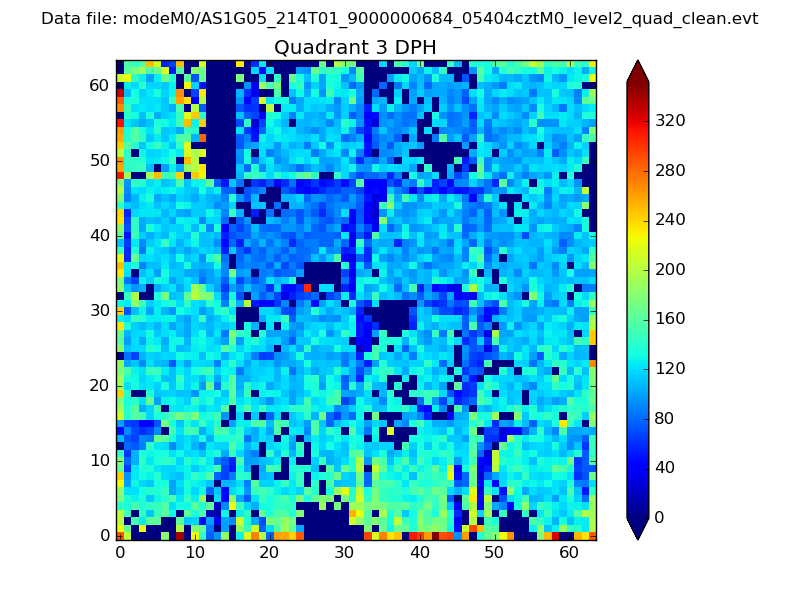 |
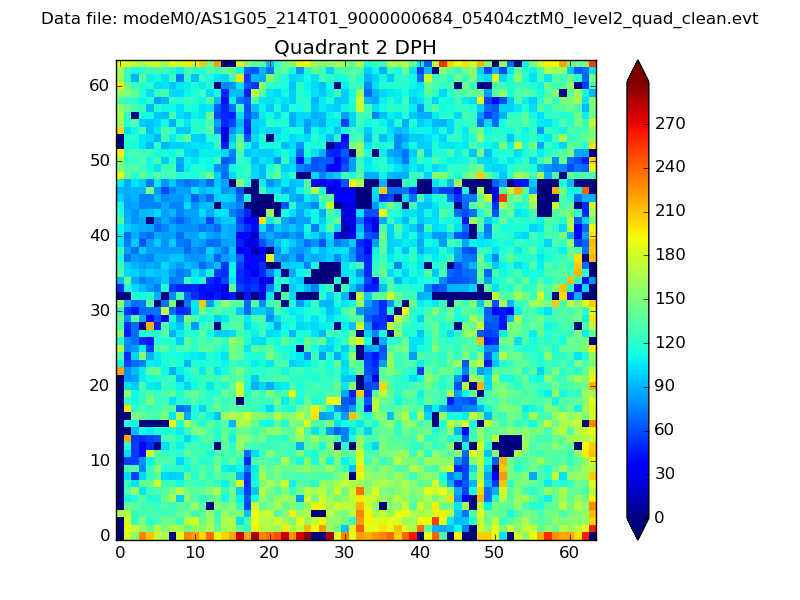 |
Quadrant C |
| Plot type | Count rate plots | Images |
|---|---|---|
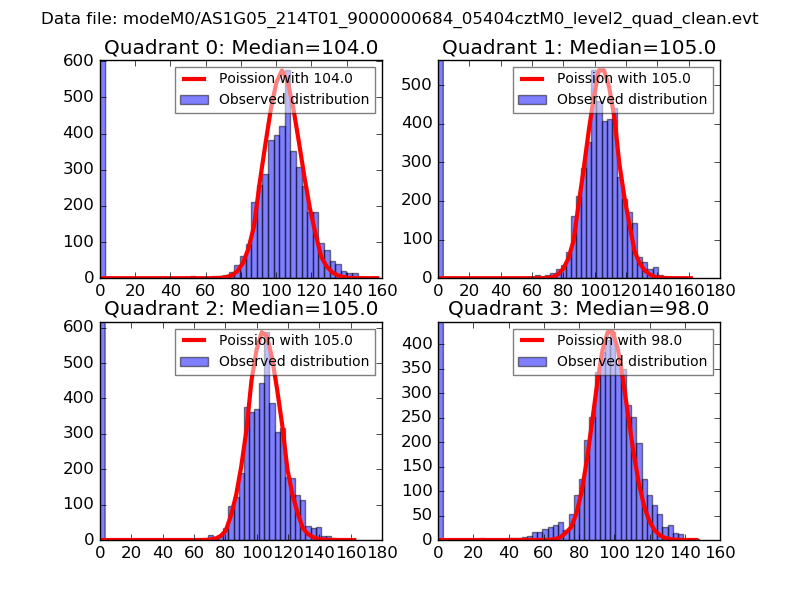
| Comparison with Poisson distribution Blue bars denote a histogram of data divided into 1 sec bins. Red curve is a Poisson curve with rate = median count rate of data. |
 |
 |
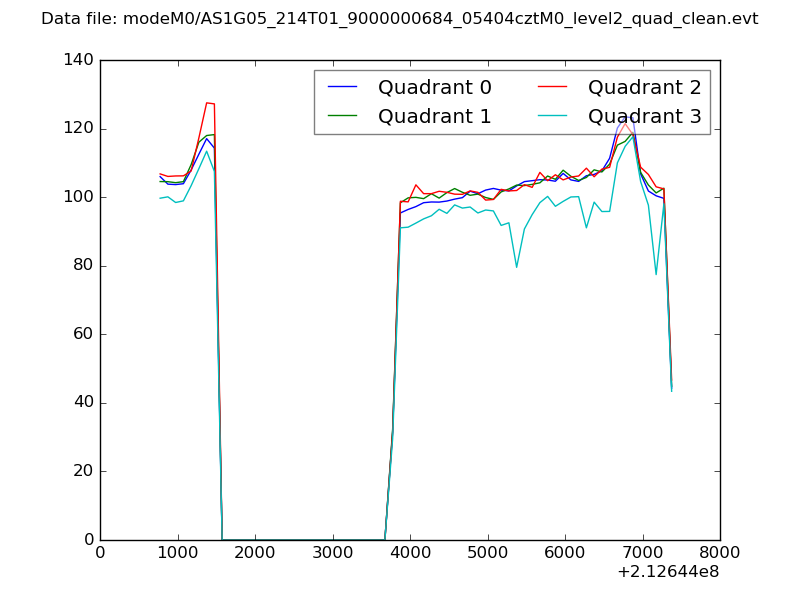
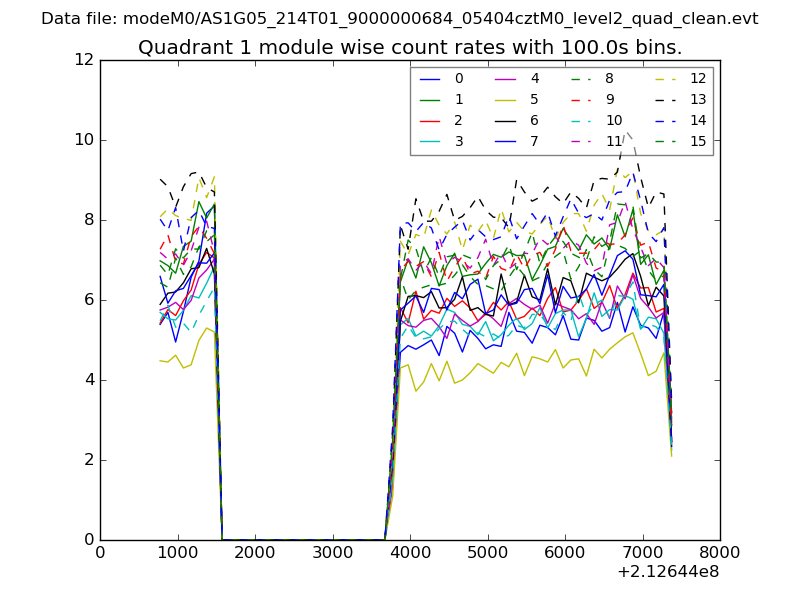
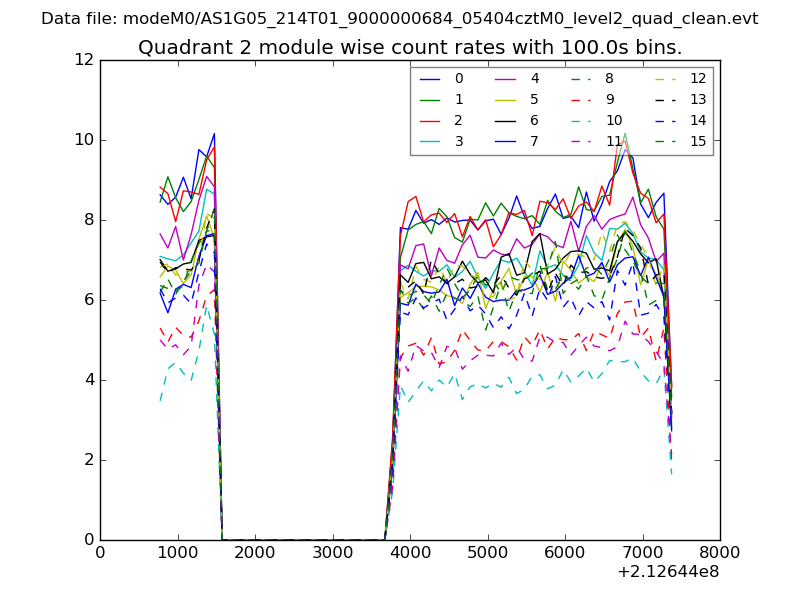
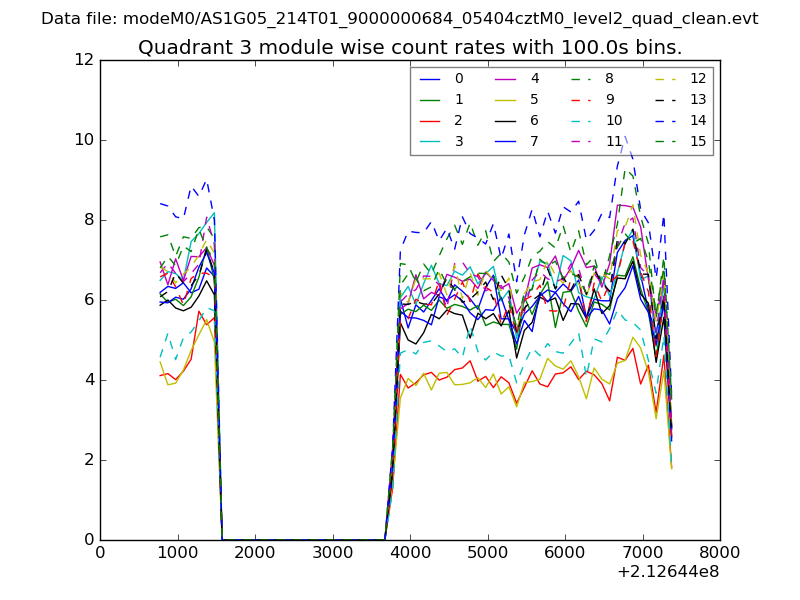
| Quadrant-wise count rates Data is divided into 100 sec bins |
 |
|
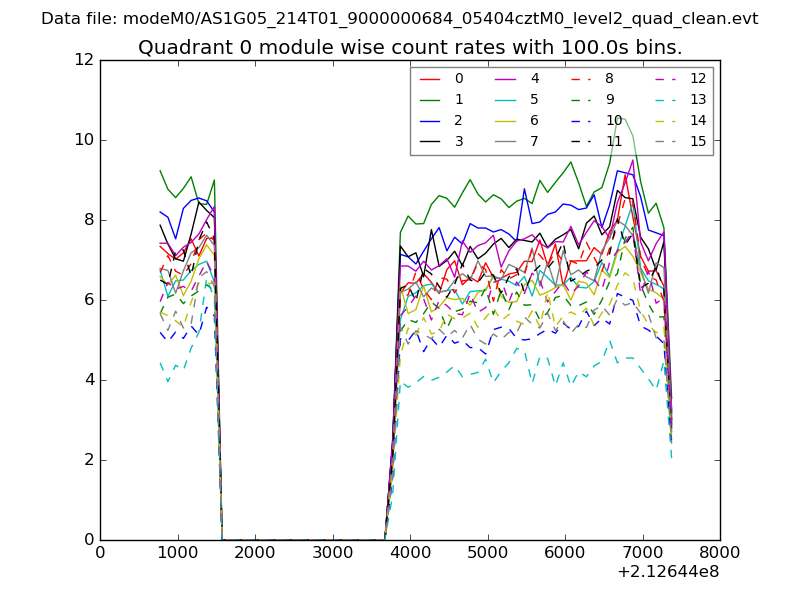
| Module-wise count rates for Quadrant A Data is divided into 100 sec bins |
 |
 |
| Module-wise count rates for Quadrant B Data is divided into 100 sec bins |
 |
 |
| Module-wise count rates for Quadrant C Data is divided into 100 sec bins |
 |
 |
| Module-wise count rates for Quadrant D Data is divided into 100 sec bins |
 |
 |
| Parameter | Plot |
|---|---|
| CZT HV Monitor |  |
| D_VDD | 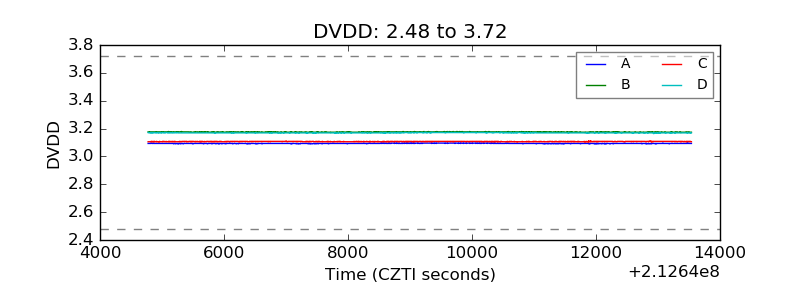 |
| Temperature 1 | 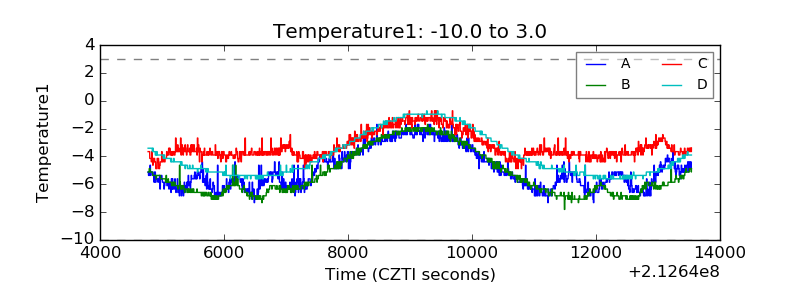 |
| Veto HV Monitor | 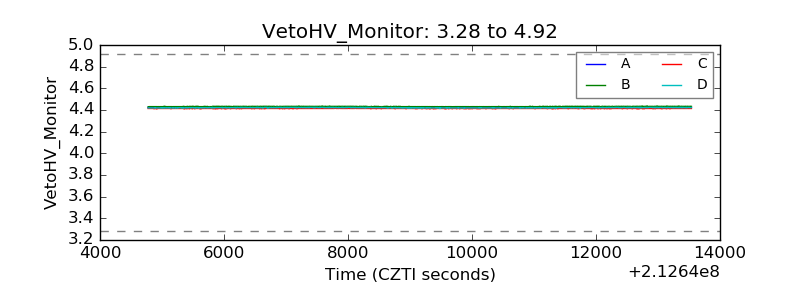 |
| Veto LLD | 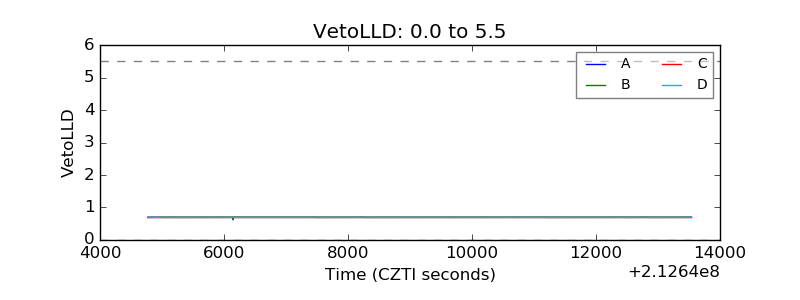 |
| Alpha Counter | 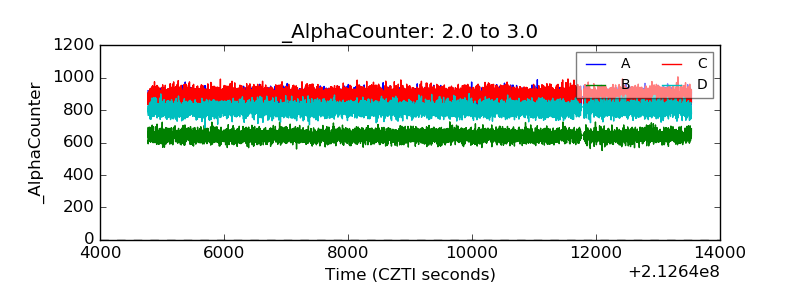 |
| _CPM_Rate | 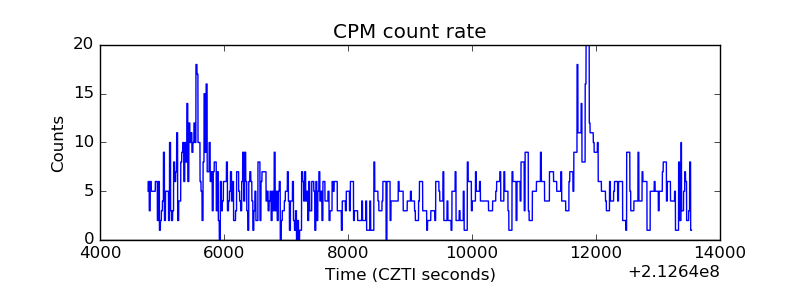 |
| CZT Counter | 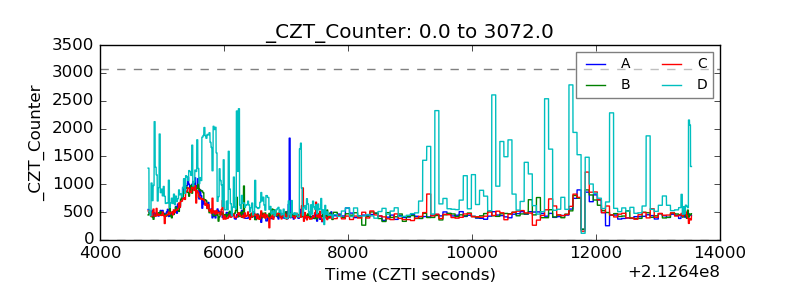 |
| +2.5 Volts monitor |  |
| +5 Volts monitor |  |
| _ROLL_ROT | 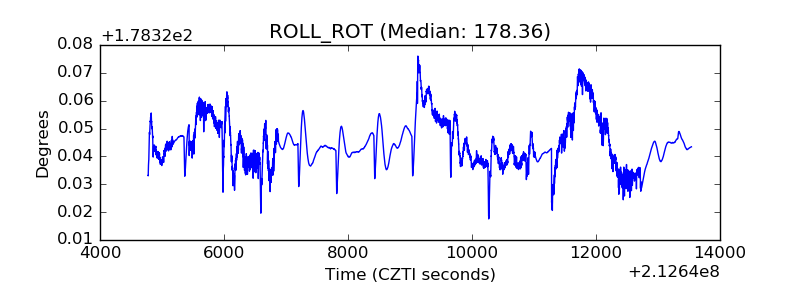 |
| _Roll_DEC | 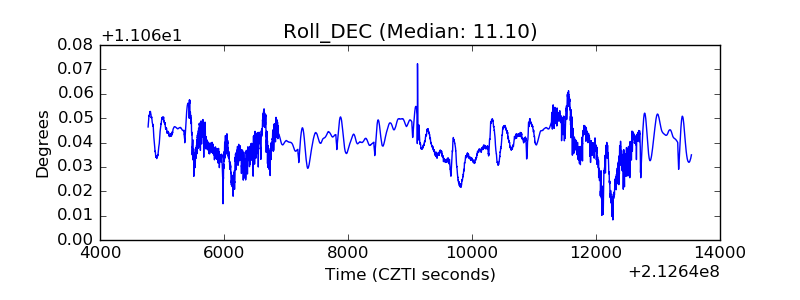 |
| _Roll_RA | 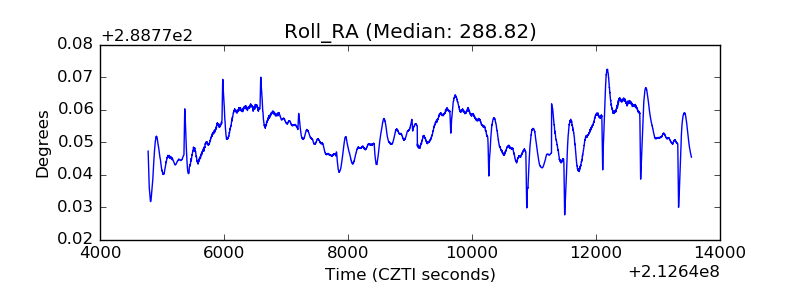 |
| Veto Counter | 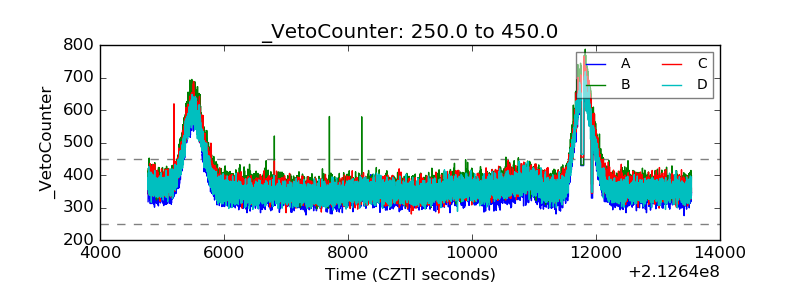 |