| Param | Original file | Final file |
|---|---|---|
| Filename | modeM0/AS1G05_214T01_9000000684_05407cztM0_level2.evt | modeM0/AS1G05_214T01_9000000684_05407cztM0_level2_quad_clean.evt |
| Size (bytes) | 1,464,292,800 | 200,998,080 |
| Size | 1.4 GB | 191.7 MB |
| Events in quadrant A | 8,941,981 | 1,211,004 |
| Events in quadrant B | 9,043,327 | 1,209,639 |
| Events in quadrant C | 8,841,460 | 1,226,775 |
| Events in quadrant D | 16,232,648 | 1,127,183 |
| Mode M9 | |||
|---|---|---|---|
| Quadrant | BADHDUFLAG | Total packets | Discarded packets |
| A | 0 | 16 | 0 |
| B | 0 | 16 | 0 |
| C | 0 | 16 | 0 |
| D | 0 | 16 | 0 |
| Mode SS | |||
|---|---|---|---|
| Quadrant | BADHDUFLAG | Total packets | Discarded packets |
| A | 0 | 388 | 0 |
| B | 0 | 388 | 0 |
| C | 0 | 388 | 0 |
| D | 0 | 388 | 0 |
| Mode M0 | |||
|---|---|---|---|
| Quadrant | BADHDUFLAG | Total packets | Discarded packets |
| A | 0 | 39523 | 6 |
| B | 0 | 39505 | 5 |
| C | 0 | 39550 | 5 |
| D | 0 | 61122 | 5 |
| Quadrant | Total seconds | Saturated seconds | Saturation percentage |
|---|---|---|---|
| A | 19053 | 514 | 2.697738% |
| B | 19053 | 533 | 2.797460% |
| C | 19053 | 433 | 2.272608% |
| D | 19053 | 1683 | 8.833255% |
Noise dominated data is calculated using 1-second bins in cleaned event files. If a bin has >2000 counts, and if more than 50% of those come from <1% of pixels, then it is considered to be noise-dominated and hence unusable.
| Quadrant | # 1 sec bins | Bins with >0 counts | Bins with >2000 counts | High rate bins dominated by noise | Noise dominated (total time) | Noise dominated (detector-on time) | Marked lightcurve |
|---|---|---|---|---|---|---|---|
| A | 20693 | 19058 | 10 | 10 | 0.05% | 0.05% | 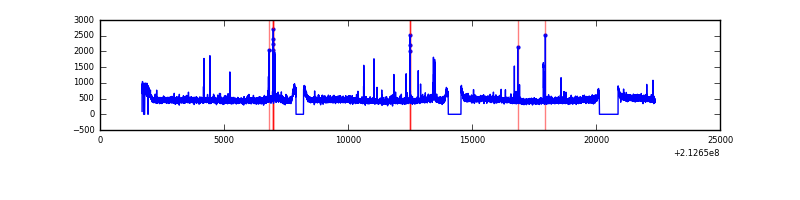 |
| B | 20693 | 19058 | 12 | 12 | 0.06% | 0.06% | 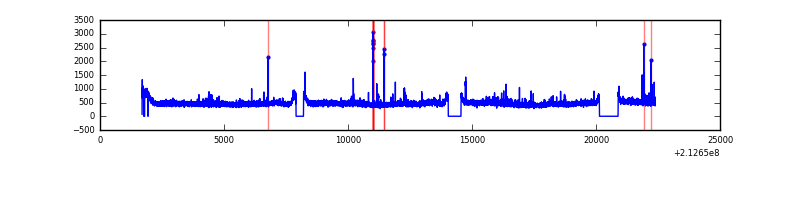 |
| C | 20693 | 19058 | 1 | 1 | 0.00% | 0.01% | 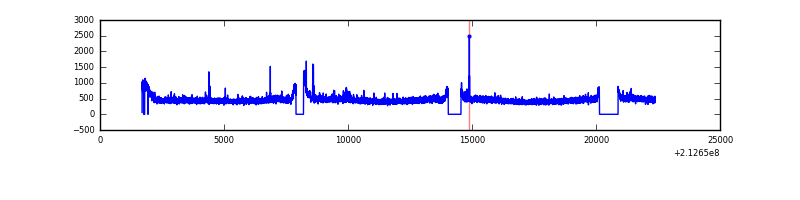 |
| D | 20693 | 19058 | 1327 | 1327 | 6.41% | 6.96% | 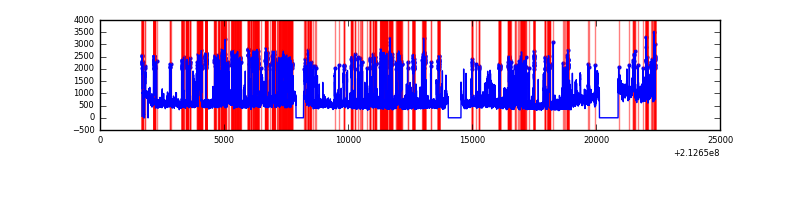 |
Top three noisy pixels from each quadrant. If the there are fewer than three noisy pixels in the level2.evt file, extra rows are filled as -1
| Pixel properties | Quadrant properties | ||||||
|---|---|---|---|---|---|---|---|
| Quadrant | DetID | PixID | Counts | Sigma | Mean | Median | Sigma |
| A | 0 | 50 | 155565 | 333.27 | 2248 | 2194 | 460.2 |
| A | 0 | 247 | 67776 | 142.51 | 2248 | 2194 | 460.2 |
| A | 13 | 6 | 51110 | 106.29 | 2248 | 2194 | 460.2 |
| B | 15 | 204 | 62250 | 136.99 | 2270 | 2211 | 438.3 |
| B | 15 | 54 | 49938 | 108.9 | 2270 | 2211 | 438.3 |
| B | 12 | 111 | 40542 | 87.46 | 2270 | 2211 | 438.3 |
| C | 1 | 16 | 199082 | 383.86 | 2201 | 2210 | 512.9 |
| C | 9 | 247 | 31222 | 56.57 | 2201 | 2210 | 512.9 |
| C | 13 | 61 | 17684 | 30.17 | 2201 | 2210 | 512.9 |
| D | 2 | 63 | 6548492 | 12270.48 | 2150 | 2078 | 533.5 |
| D | 2 | 152 | 438673 | 818.35 | 2150 | 2078 | 533.5 |
| D | 2 | 136 | 204075 | 378.62 | 2150 | 2078 | 533.5 |
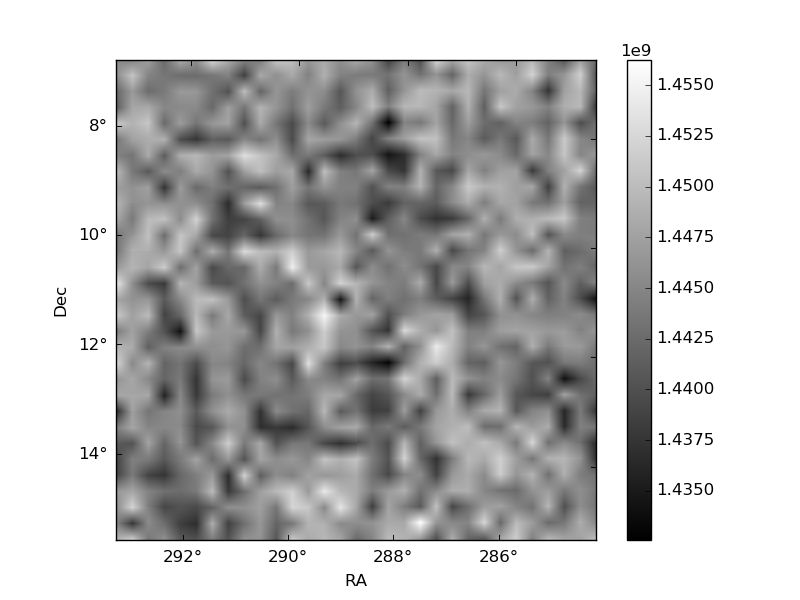
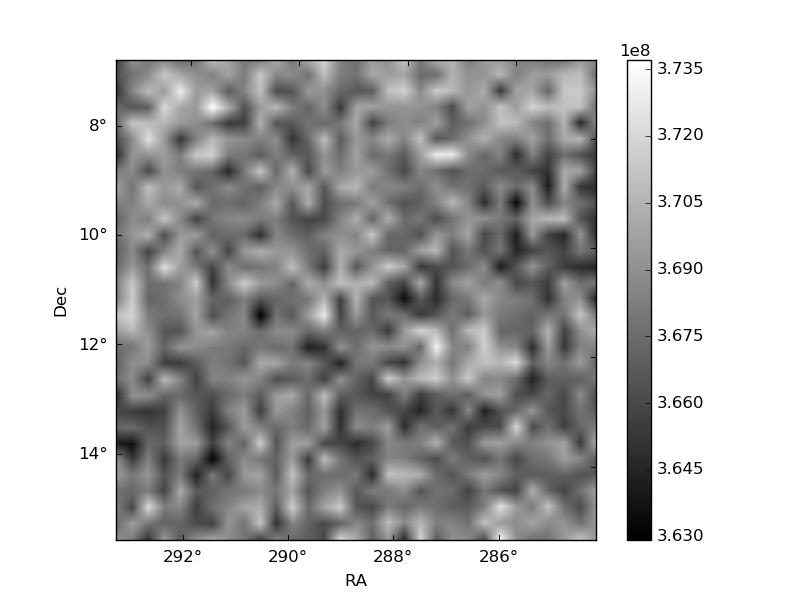
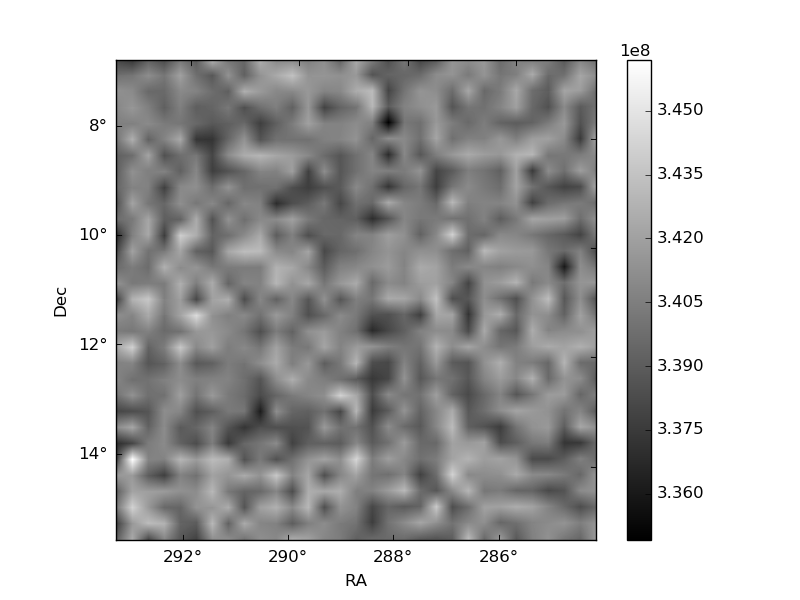
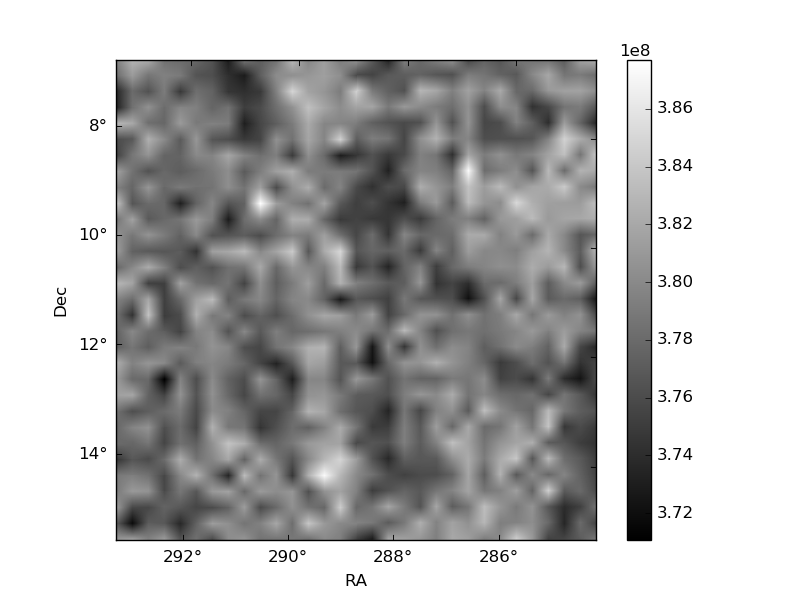
Histogram calculated using DETX and DETY for each event in the final _common_clean file
| Quadrant A | 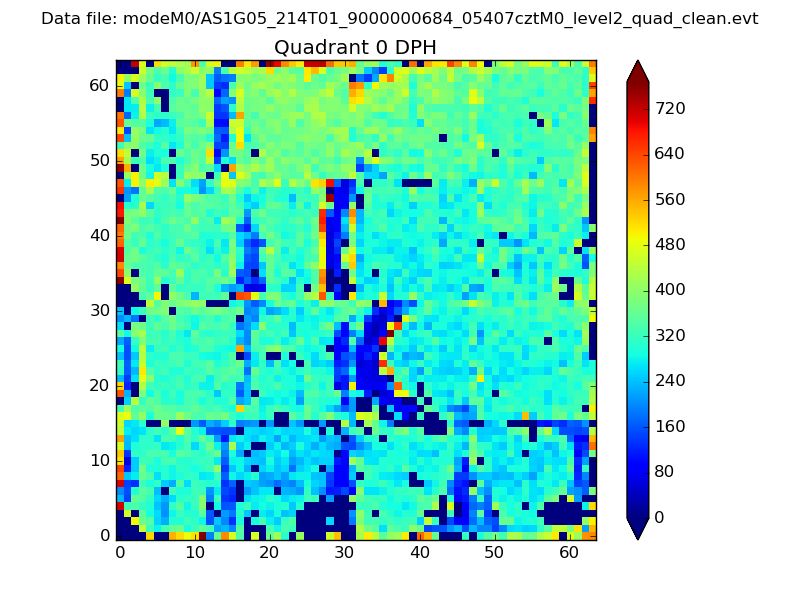 |
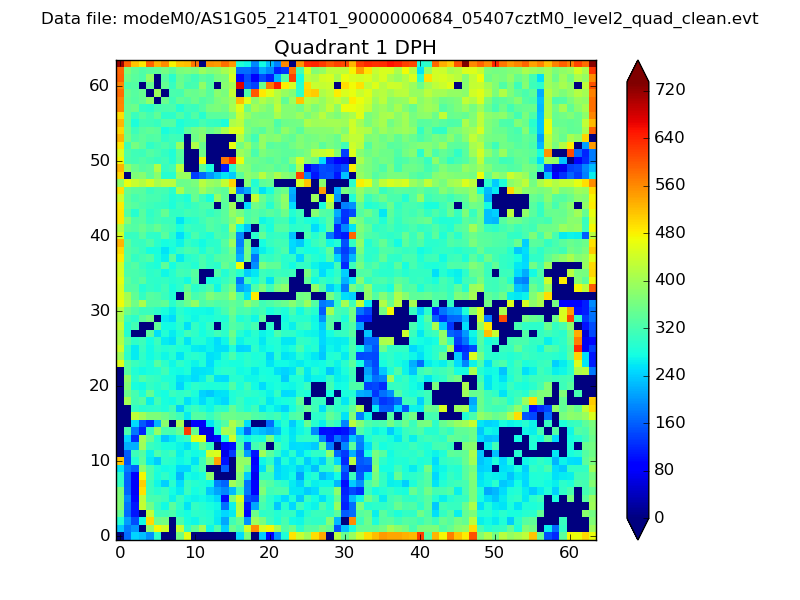 |
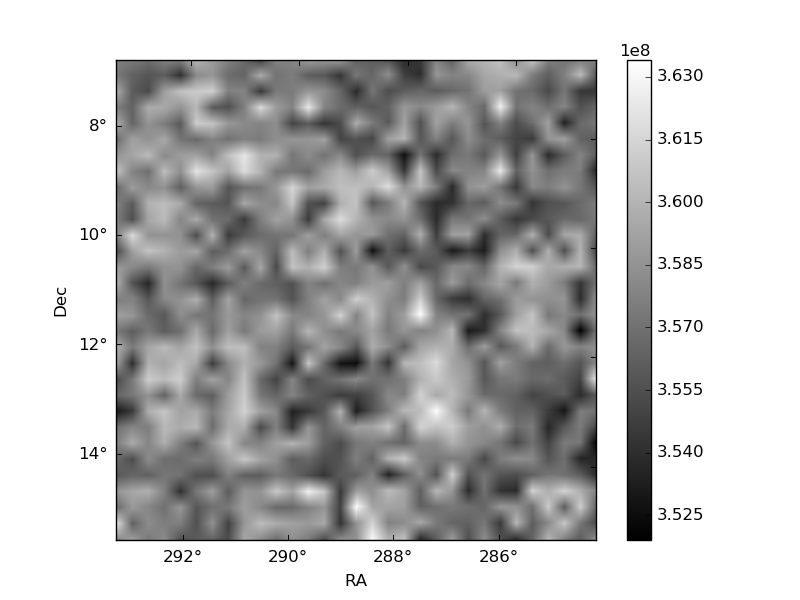
Quadrant B |
|---|---|---|---|
| Quadrant D | 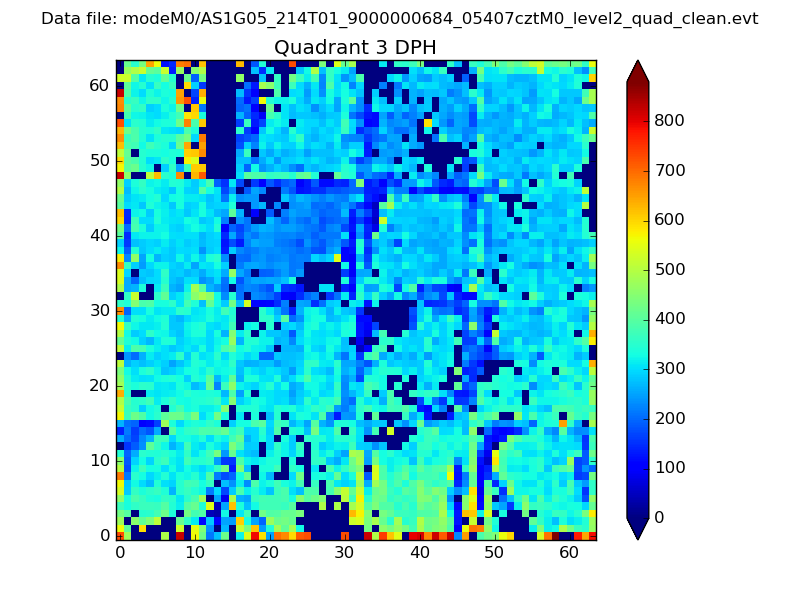 |
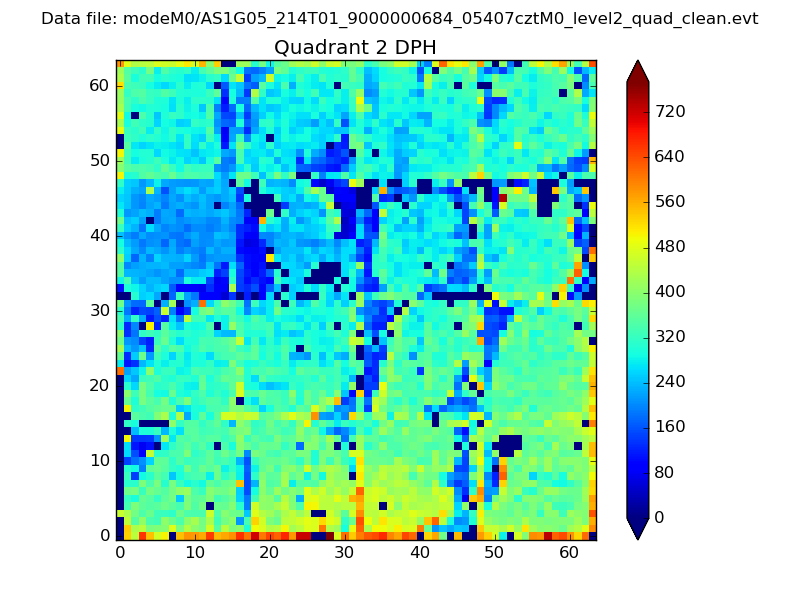 |
Quadrant C |
| Plot type | Count rate plots | Images |
|---|---|---|
| Comparison with Poisson distribution Blue bars denote a histogram of data divided into 1 sec bins. Red curve is a Poisson curve with rate = median count rate of data. |
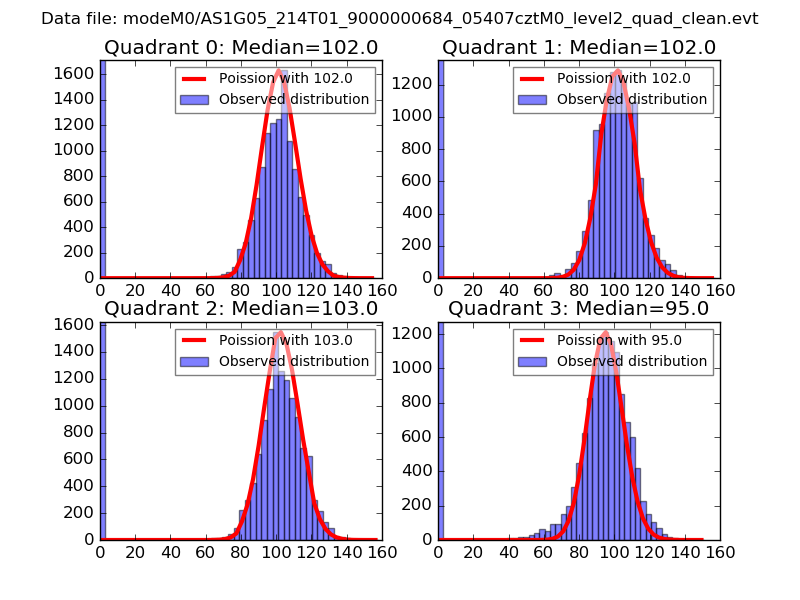 |
 |
| Quadrant-wise count rates Data is divided into 100 sec bins |
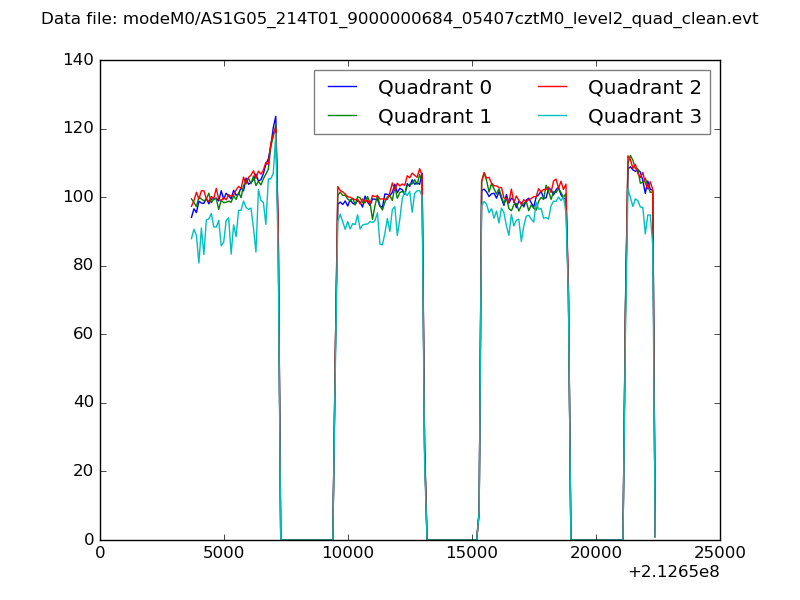 |
|
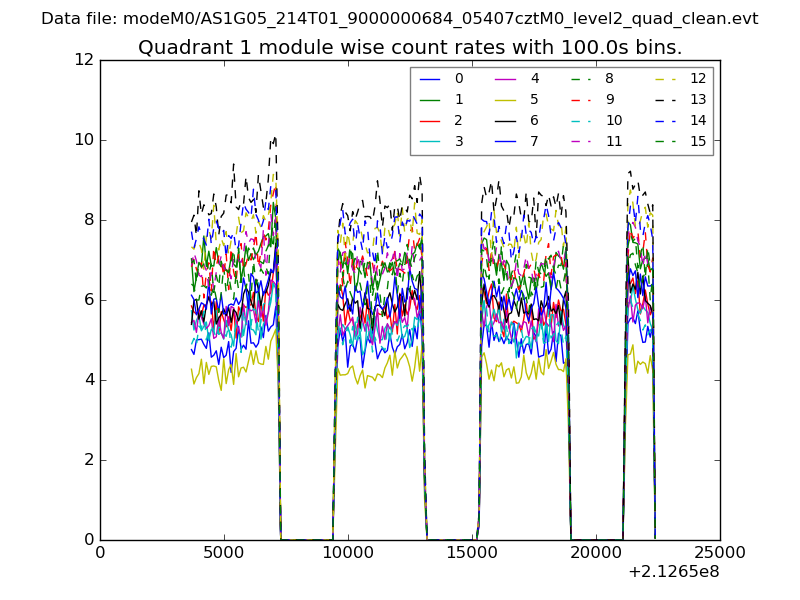
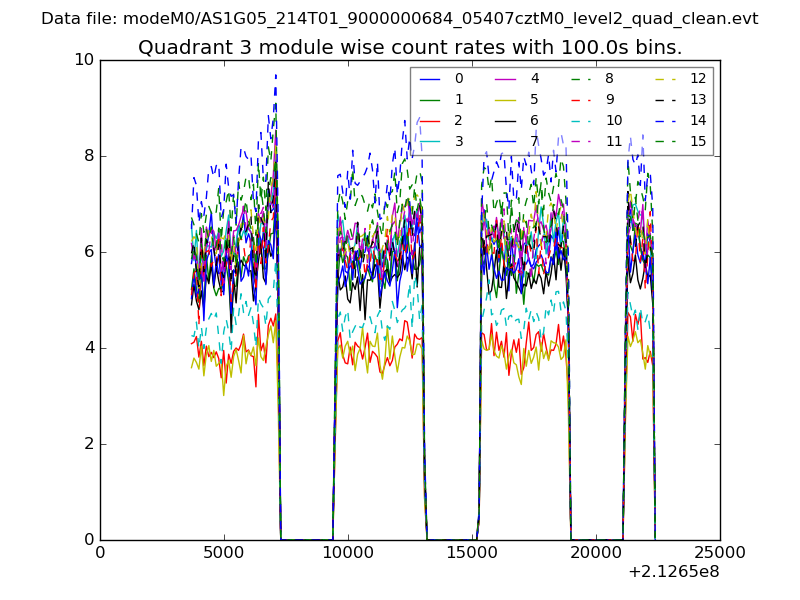
| Module-wise count rates for Quadrant A Data is divided into 100 sec bins |
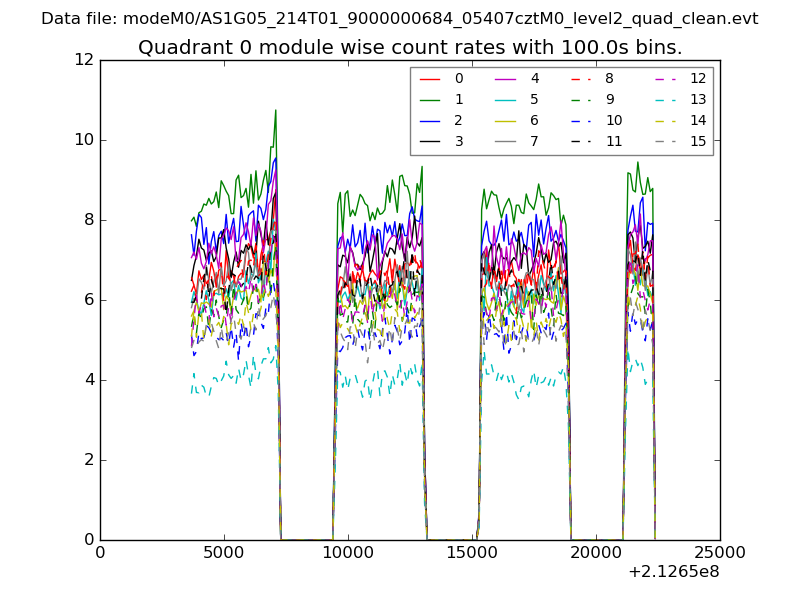 |
 |
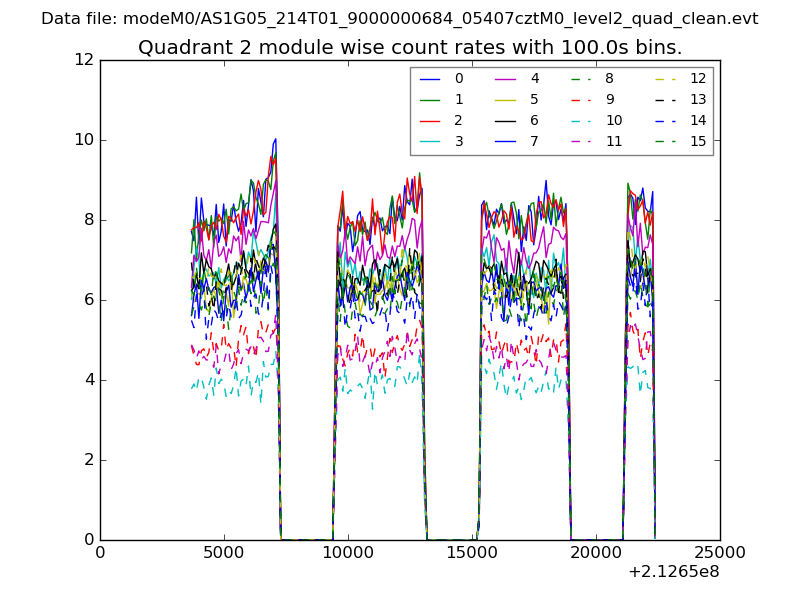
| Module-wise count rates for Quadrant B Data is divided into 100 sec bins |
 |
 |
| Module-wise count rates for Quadrant C Data is divided into 100 sec bins |
 |
 |
| Module-wise count rates for Quadrant D Data is divided into 100 sec bins |
 |
 |
| Parameter | Plot |
|---|---|
| CZT HV Monitor | 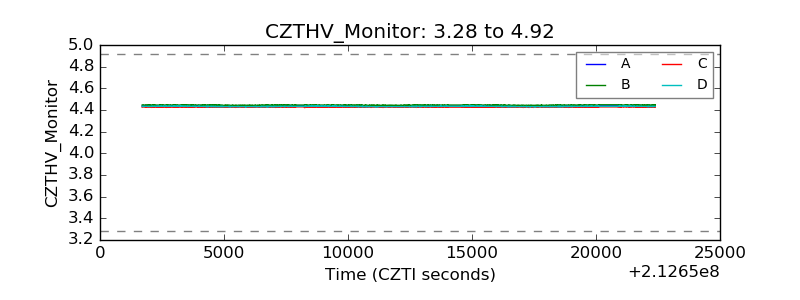 |
| D_VDD | 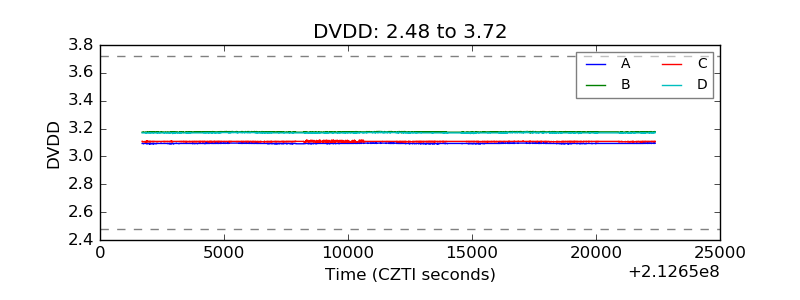 |
| Temperature 1 | 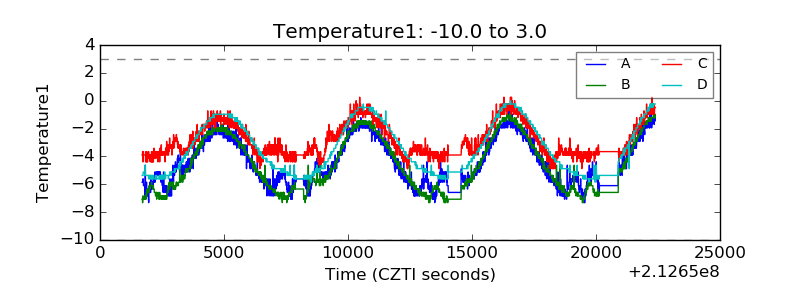 |
| Veto HV Monitor | 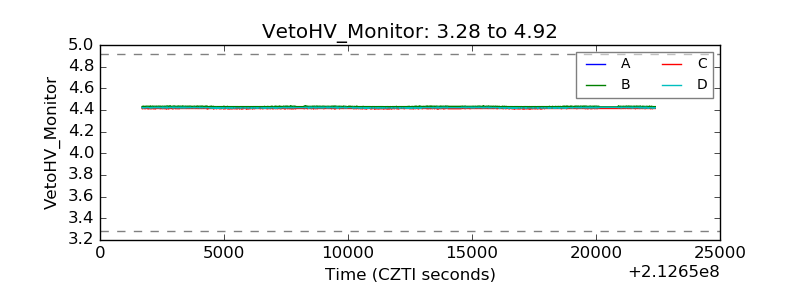 |
| Veto LLD | 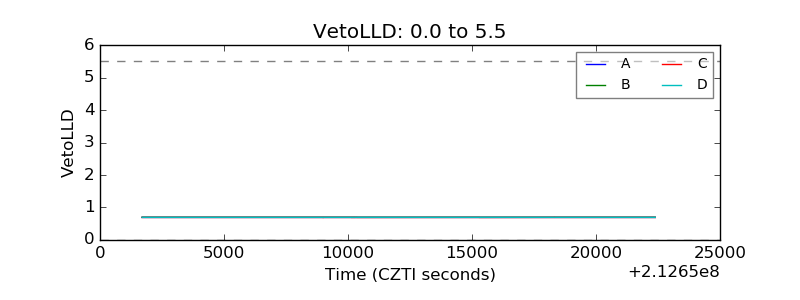 |
| Alpha Counter | 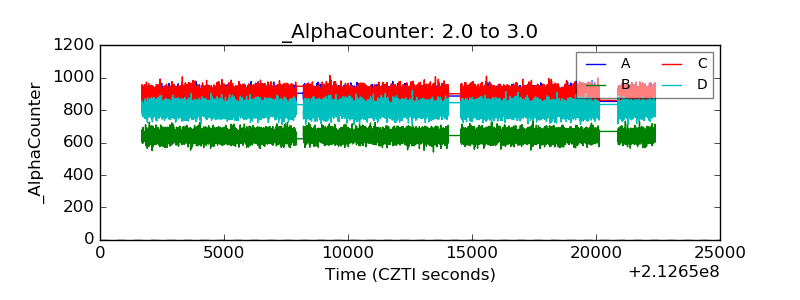 |
| _CPM_Rate | 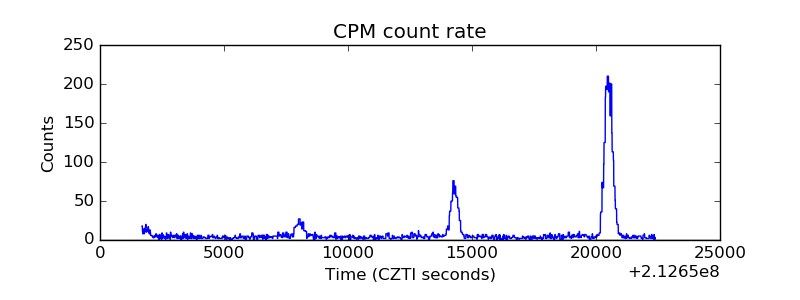 |
| CZT Counter | 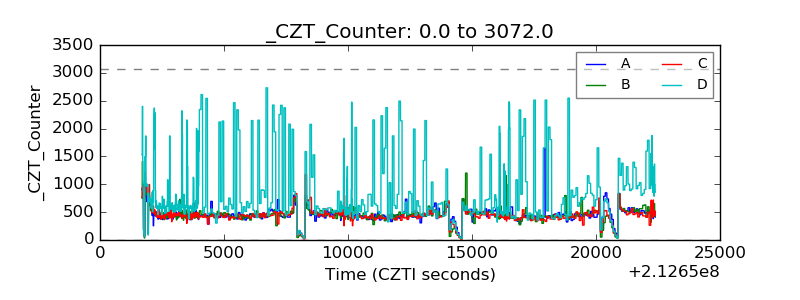 |
| +2.5 Volts monitor |  |
| +5 Volts monitor |  |
| _ROLL_ROT | 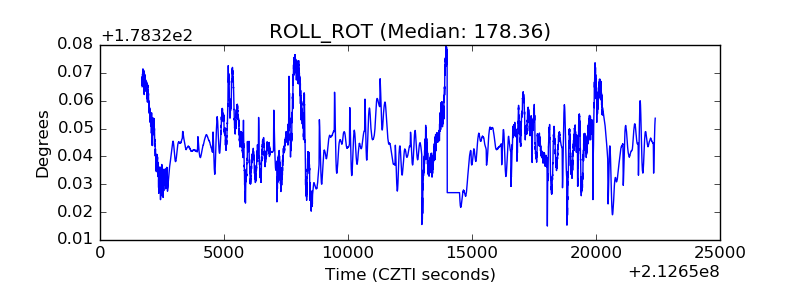 |
| _Roll_DEC | 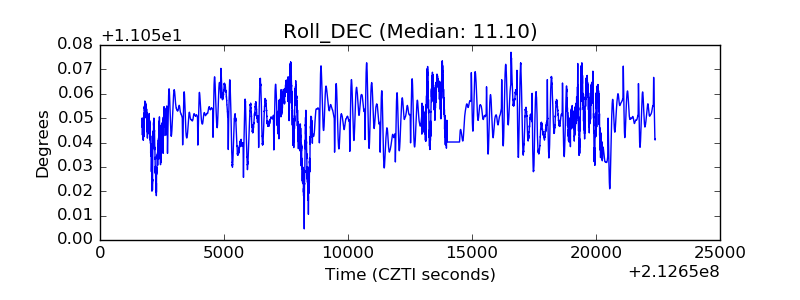 |
| _Roll_RA | 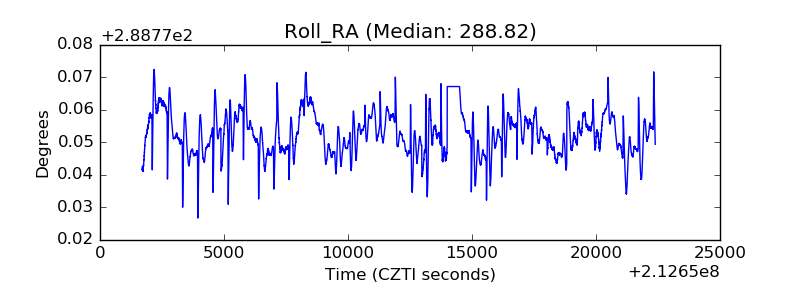 |
| Veto Counter |  |