| Param | Original file | Final file |
|---|---|---|
| Filename | modeM0/AS1G05_214T01_9000000684_05411cztM0_level2.evt | modeM0/AS1G05_214T01_9000000684_05411cztM0_level2_quad_clean.evt |
| Size (bytes) | 540,636,480 | 76,515,840 |
| Size | 515.6 MB | 73.0 MB |
| Events in quadrant A | 3,063,001 | 488,810 |
| Events in quadrant B | 3,450,727 | 485,570 |
| Events in quadrant C | 3,085,720 | 482,843 |
| Events in quadrant D | 6,347,381 | 420,405 |
| Mode M9 | |||
|---|---|---|---|
| Quadrant | BADHDUFLAG | Total packets | Discarded packets |
| A | 0 | 12 | 0 |
| B | 0 | 12 | 0 |
| C | 0 | 12 | 0 |
| D | 0 | 12 | 0 |
| Mode SS | |||
|---|---|---|---|
| Quadrant | BADHDUFLAG | Total packets | Discarded packets |
| A | 0 | 128 | 0 |
| B | 0 | 128 | 0 |
| C | 0 | 128 | 0 |
| D | 0 | 128 | 0 |
| Mode M0 | |||
|---|---|---|---|
| Quadrant | BADHDUFLAG | Total packets | Discarded packets |
| A | 0 | 13341 | 2 |
| B | 0 | 14408 | 1 |
| C | 0 | 13398 | 1 |
| D | 0 | 23234 | 1 |
| Quadrant | Total seconds | Saturated seconds | Saturation percentage |
|---|---|---|---|
| A | 6290 | 52 | 0.826709% |
| B | 6290 | 100 | 1.589825% |
| C | 6290 | 36 | 0.572337% |
| D | 6290 | 709 | 11.271860% |
Noise dominated data is calculated using 1-second bins in cleaned event files. If a bin has >2000 counts, and if more than 50% of those come from <1% of pixels, then it is considered to be noise-dominated and hence unusable.
| Quadrant | # 1 sec bins | Bins with >0 counts | Bins with >2000 counts | High rate bins dominated by noise | Noise dominated (total time) | Noise dominated (detector-on time) | Marked lightcurve |
|---|---|---|---|---|---|---|---|
| A | 7491 | 6291 | 7 | 7 | 0.09% | 0.11% | 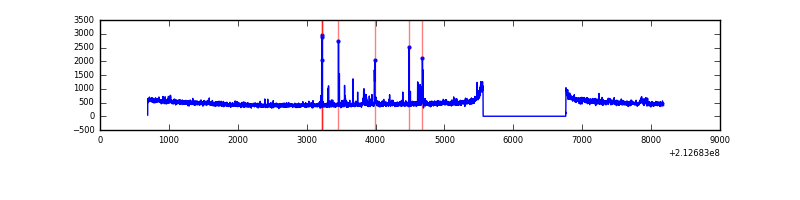 |
| B | 7491 | 6291 | 50 | 50 | 0.67% | 0.79% | 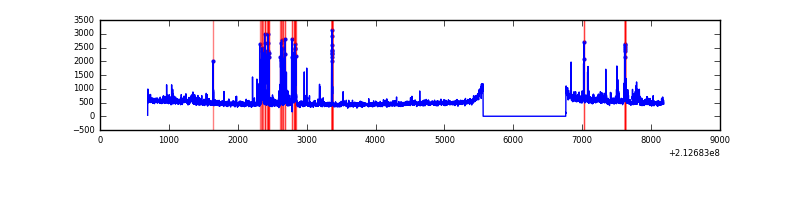 |
| C | 7491 | 6291 | 8 | 8 | 0.11% | 0.13% |  |
| D | 7491 | 6291 | 589 | 589 | 7.86% | 9.36% | 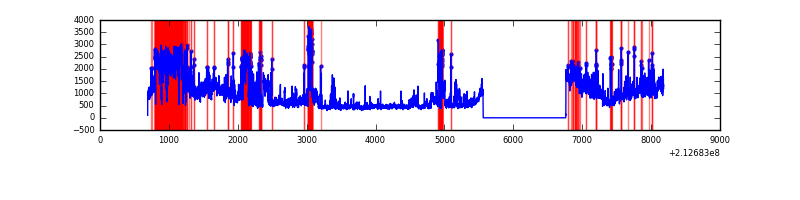 |
Top three noisy pixels from each quadrant. If the there are fewer than three noisy pixels in the level2.evt file, extra rows are filled as -1
| Pixel properties | Quadrant properties | ||||||
|---|---|---|---|---|---|---|---|
| Quadrant | DetID | PixID | Counts | Sigma | Mean | Median | Sigma |
| A | 0 | 50 | 61565 | 394.94 | 759 | 745 | 154.0 |
| A | 15 | 174 | 40193 | 256.16 | 759 | 745 | 154.0 |
| A | 13 | 6 | 27816 | 175.79 | 759 | 745 | 154.0 |
| B | 10 | 16 | 218832 | 1514.6 | 760 | 743 | 144.0 |
| B | 15 | 204 | 124105 | 856.73 | 760 | 743 | 144.0 |
| B | 4 | 48 | 57709 | 395.62 | 760 | 743 | 144.0 |
| C | 9 | 247 | 112818 | 659.19 | 734 | 740 | 170.0 |
| C | 1 | 16 | 88579 | 516.63 | 734 | 740 | 170.0 |
| C | 14 | 67 | 16033 | 89.95 | 734 | 740 | 170.0 |
| D | 2 | 63 | 3270084 | 19002.4 | 704 | 683 | 172.1 |
| D | 2 | 33 | 164591 | 952.66 | 704 | 683 | 172.1 |
| D | 2 | 152 | 79710 | 459.32 | 704 | 683 | 172.1 |
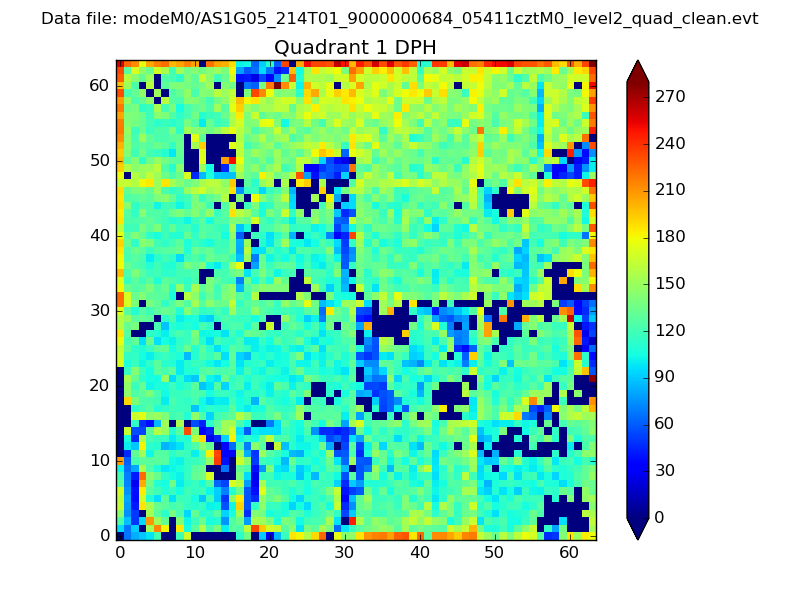
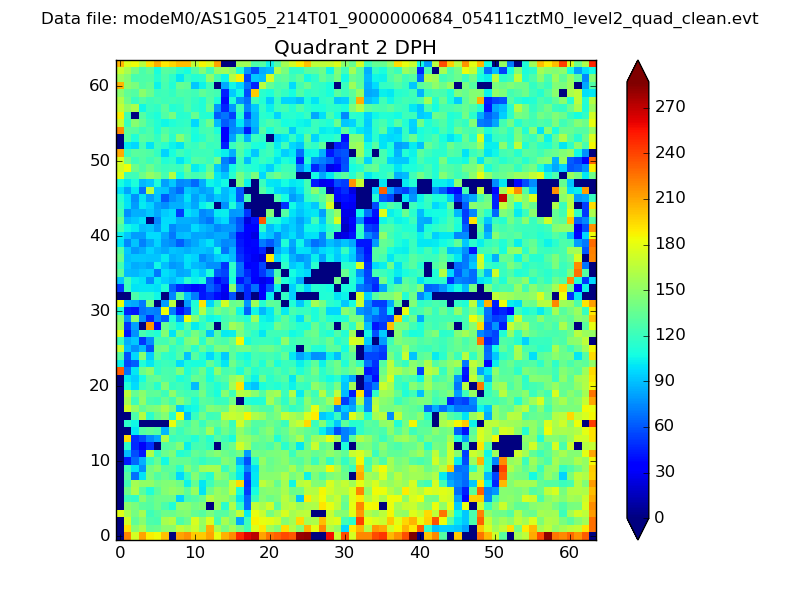
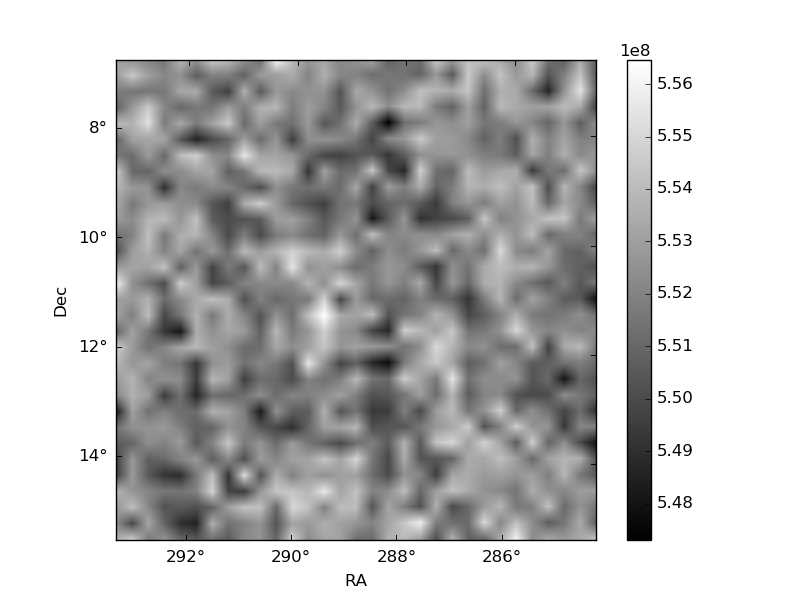
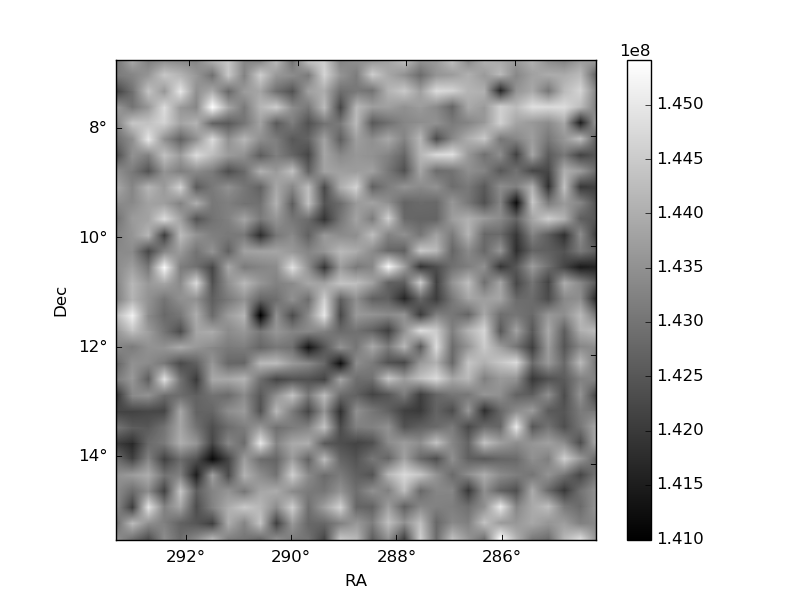
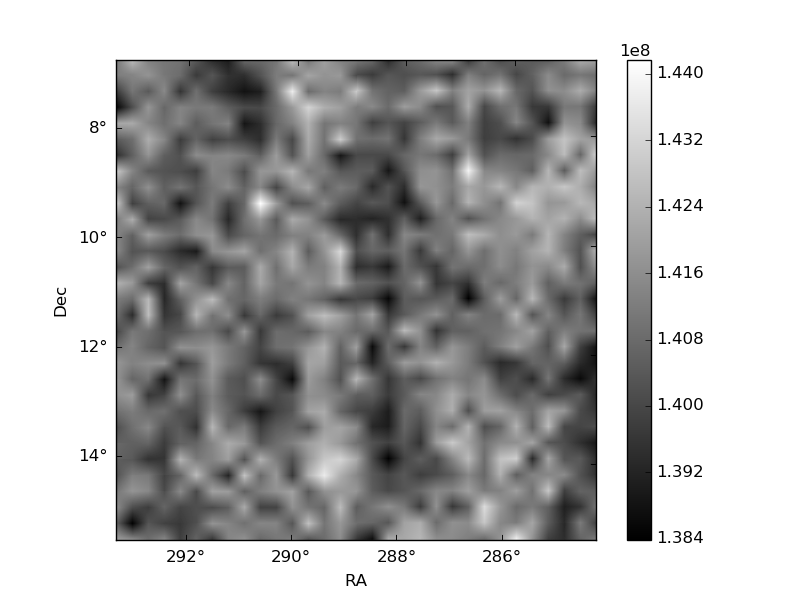
Histogram calculated using DETX and DETY for each event in the final _common_clean file
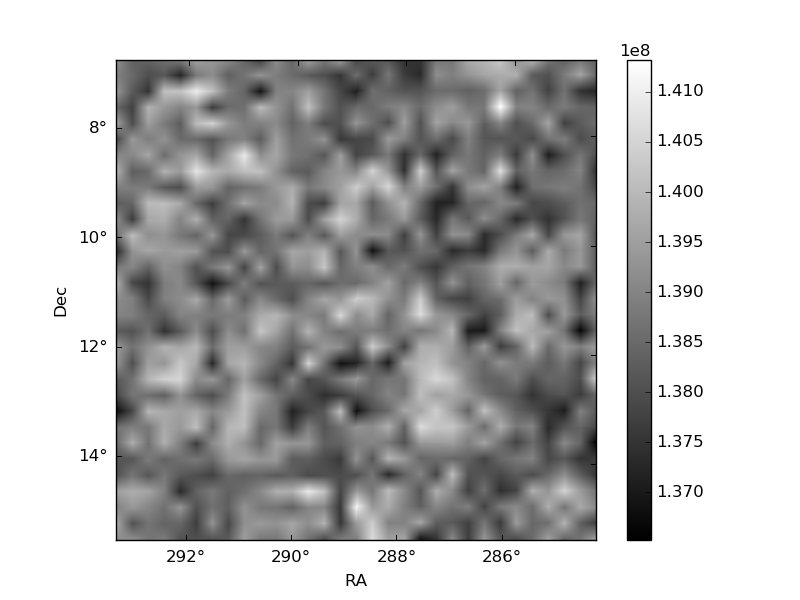
| Quadrant A | 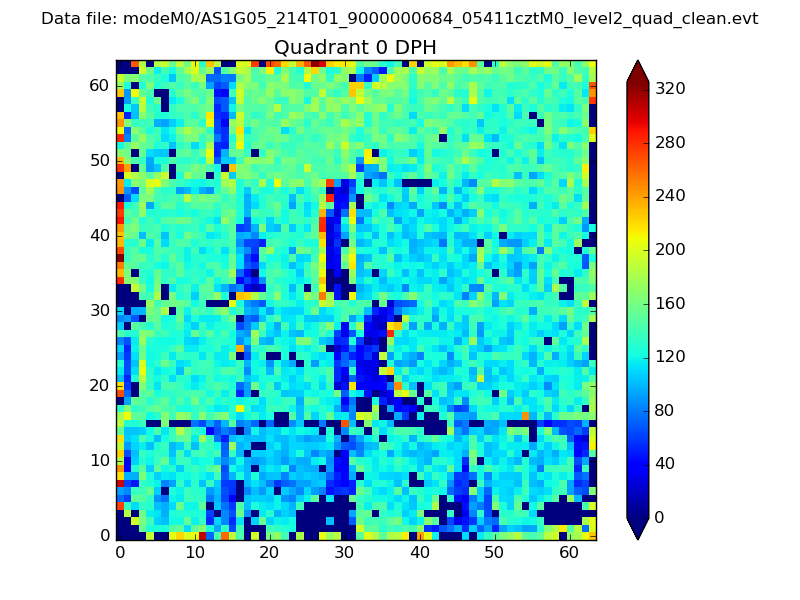 |
 |
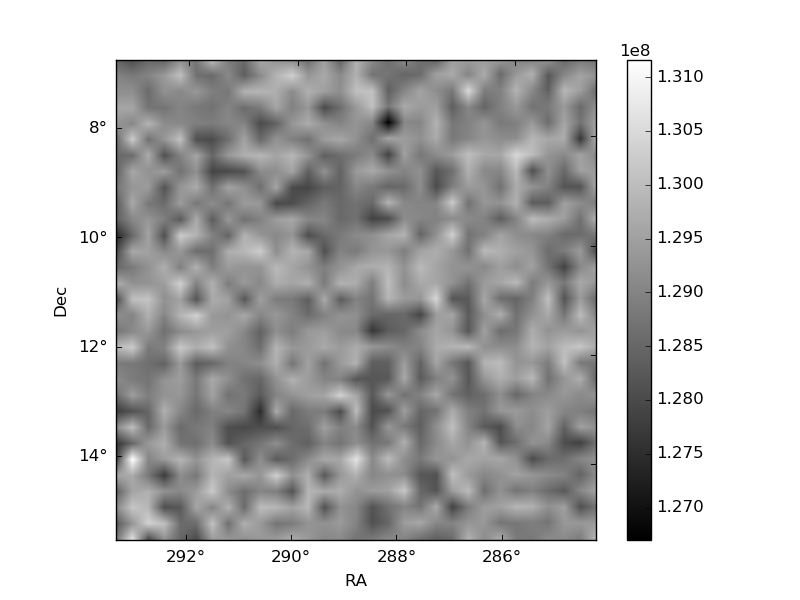
Quadrant B |
|---|---|---|---|
| Quadrant D | 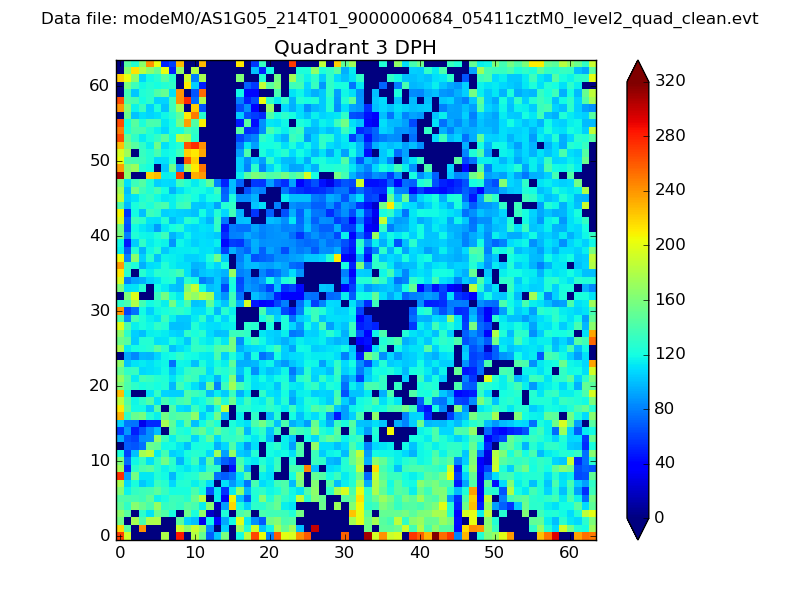 |
 |
Quadrant C |
| Plot type | Count rate plots | Images |
|---|---|---|
| Comparison with Poisson distribution Blue bars denote a histogram of data divided into 1 sec bins. Red curve is a Poisson curve with rate = median count rate of data. |
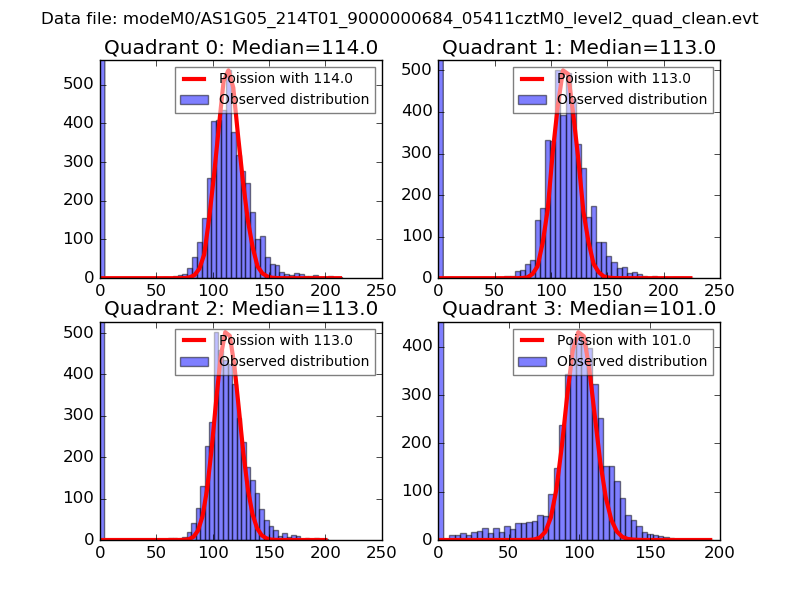 |
 |
| Quadrant-wise count rates Data is divided into 100 sec bins |
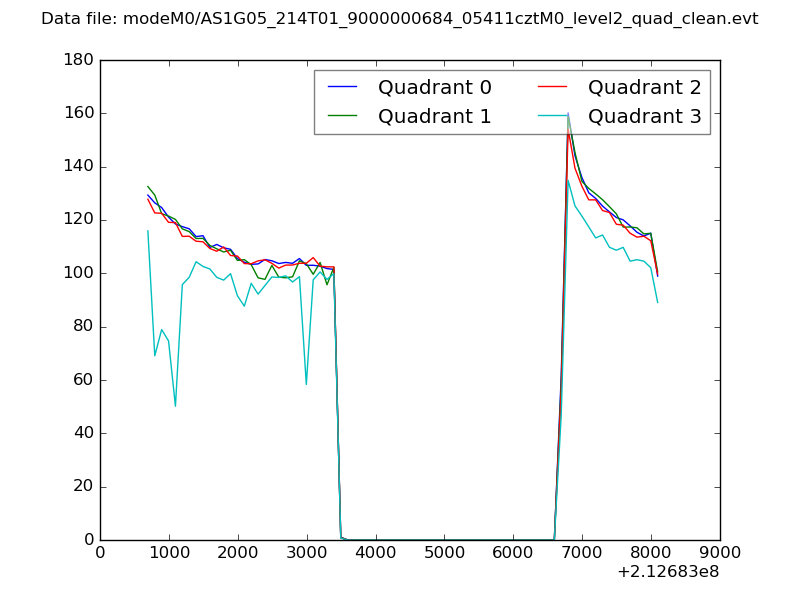 |
|
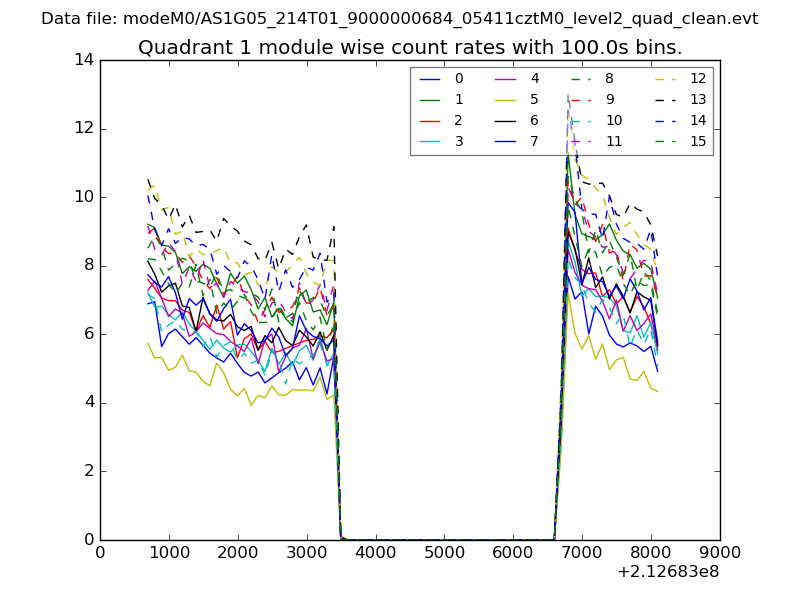
| Module-wise count rates for Quadrant A Data is divided into 100 sec bins |
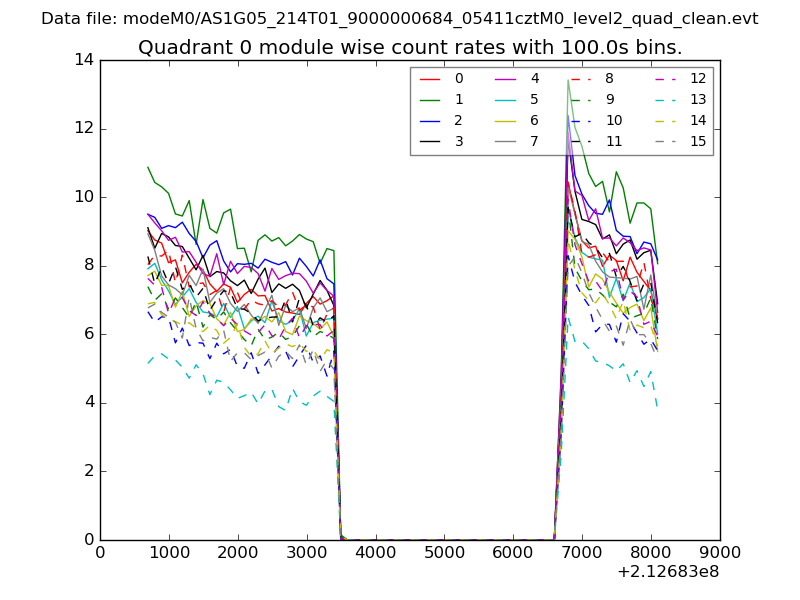 |
 |
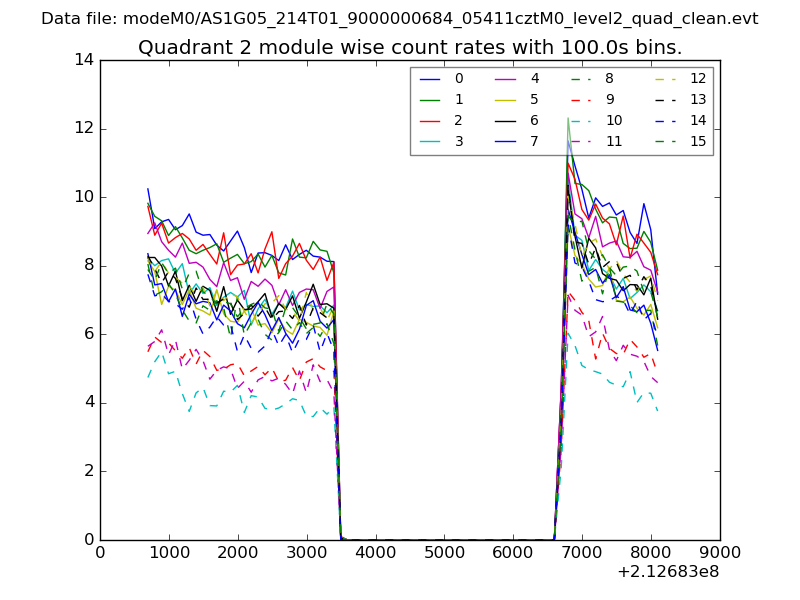
| Module-wise count rates for Quadrant B Data is divided into 100 sec bins |
 |
 |
| Module-wise count rates for Quadrant C Data is divided into 100 sec bins |
 |
 |
| Module-wise count rates for Quadrant D Data is divided into 100 sec bins |
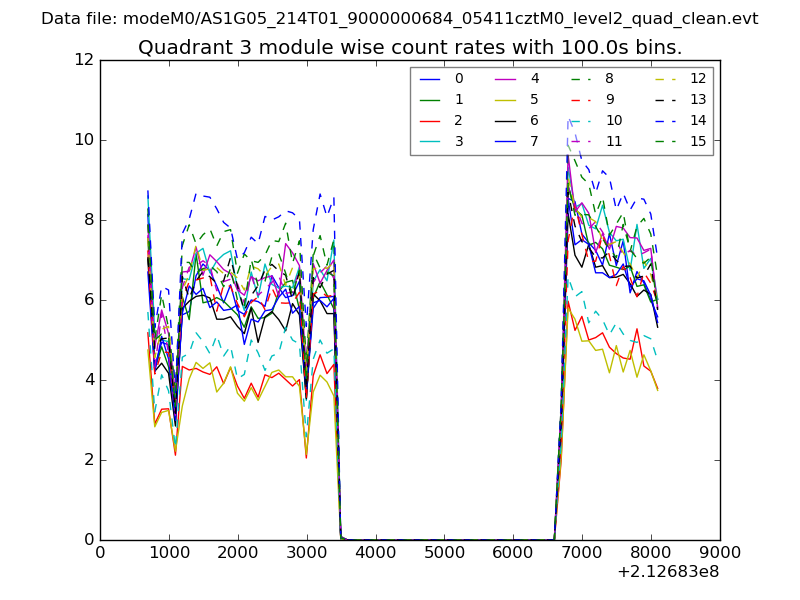 |
 |
| Parameter | Plot |
|---|---|
| CZT HV Monitor | 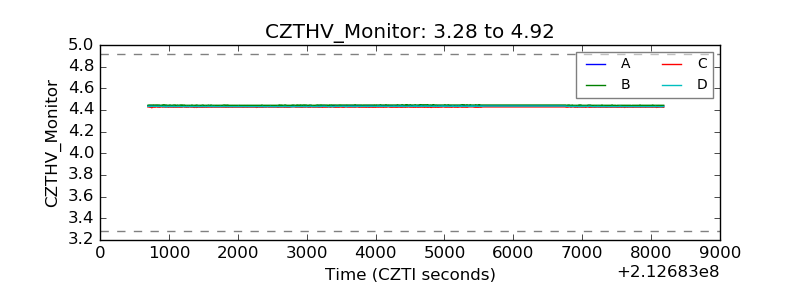 |
| D_VDD | 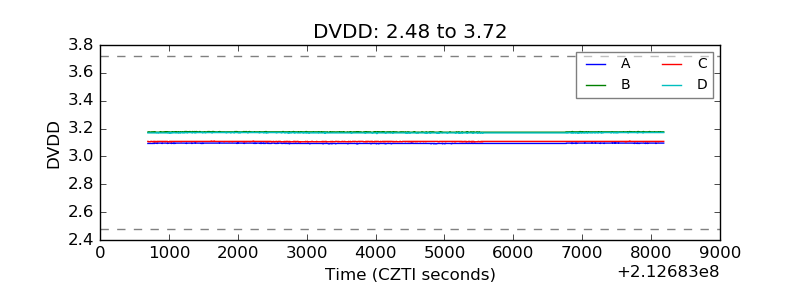 |
| Temperature 1 | 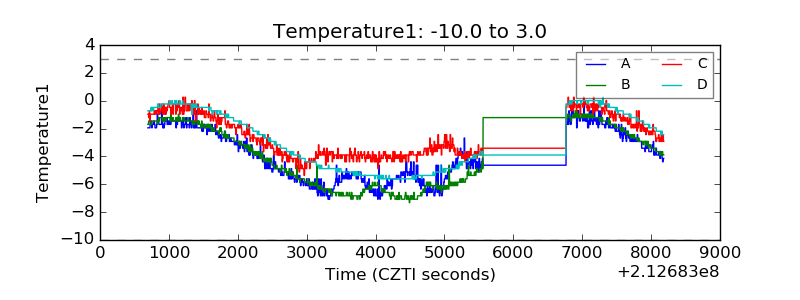 |
| Veto HV Monitor | 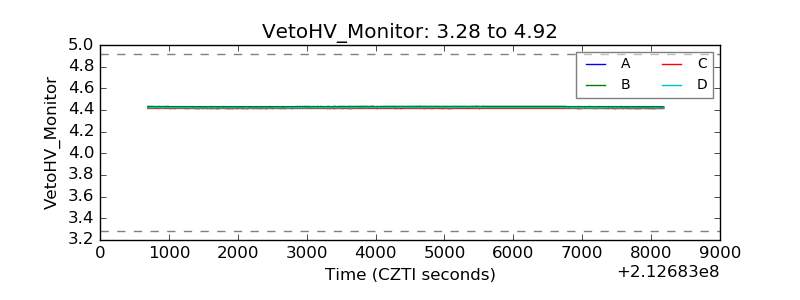 |
| Veto LLD | 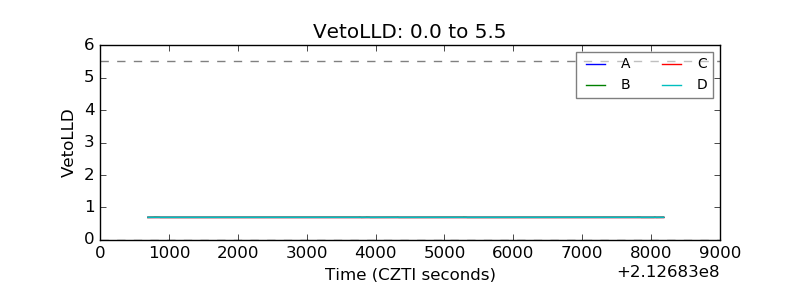 |
| Alpha Counter | 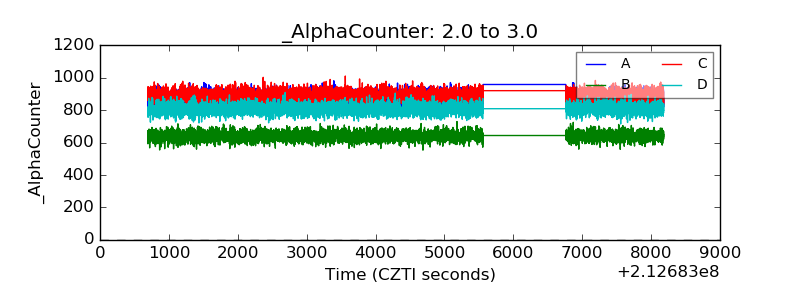 |
| _CPM_Rate | 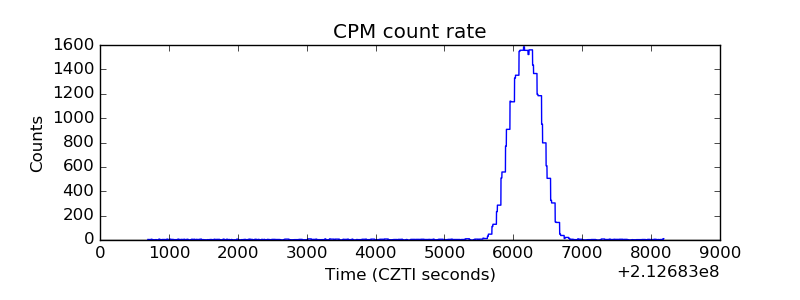 |
| CZT Counter | 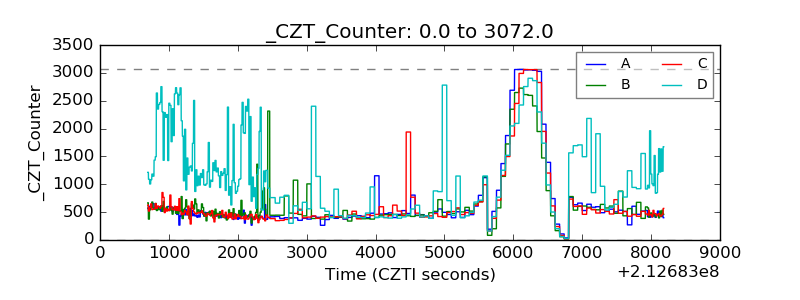 |
| +2.5 Volts monitor | 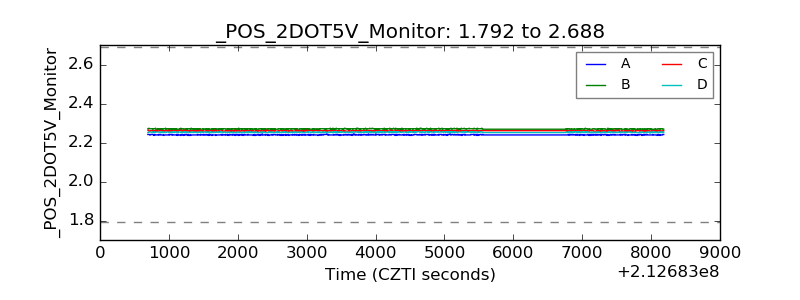 |
| +5 Volts monitor |  |
| _ROLL_ROT | 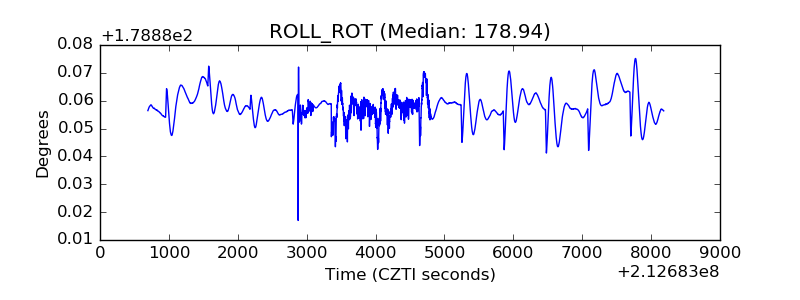 |
| _Roll_DEC | 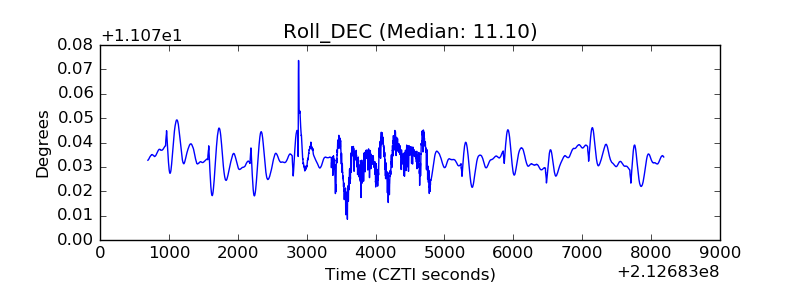 |
| _Roll_RA | 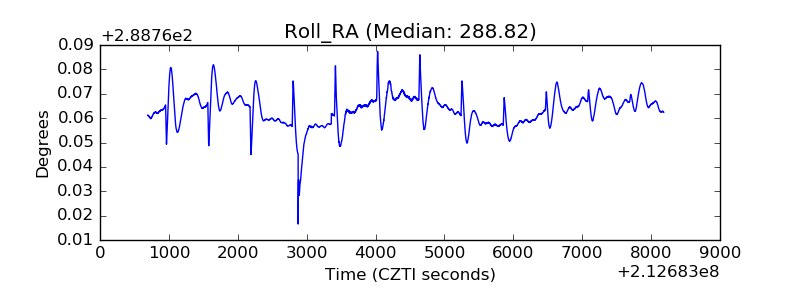 |
| Veto Counter | 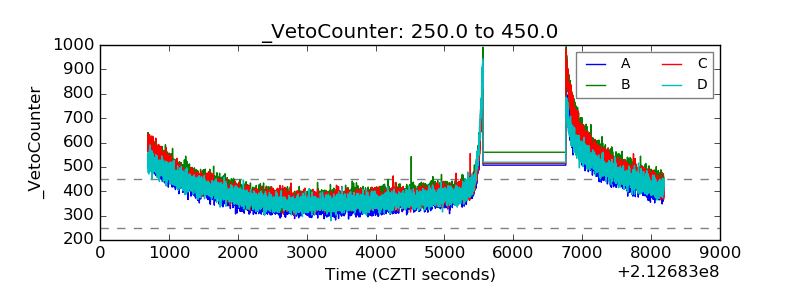 |