| Param | Original file | Final file |
|---|---|---|
| Filename | modeM0/AS1G05_214T01_9000000684_05412cztM0_level2.evt | modeM0/AS1G05_214T01_9000000684_05412cztM0_level2_quad_clean.evt |
| Size (bytes) | 523,604,160 | 68,958,720 |
| Size | 499.3 MB | 65.8 MB |
| Events in quadrant A | 2,934,583 | 431,552 |
| Events in quadrant B | 3,326,502 | 433,733 |
| Events in quadrant C | 2,862,970 | 426,069 |
| Events in quadrant D | 6,335,423 | 385,835 |
| Mode M9 | |||
|---|---|---|---|
| Quadrant | BADHDUFLAG | Total packets | Discarded packets |
| A | 0 | 13 | 0 |
| B | 0 | 13 | 0 |
| C | 0 | 13 | 0 |
| D | 0 | 13 | 0 |
| Mode SS | |||
|---|---|---|---|
| Quadrant | BADHDUFLAG | Total packets | Discarded packets |
| A | 0 | 118 | 0 |
| B | 0 | 118 | 0 |
| C | 0 | 118 | 0 |
| D | 0 | 118 | 0 |
| Mode M0 | |||
|---|---|---|---|
| Quadrant | BADHDUFLAG | Total packets | Discarded packets |
| A | 0 | 12589 | 2 |
| B | 0 | 13773 | 1 |
| C | 0 | 12381 | 1 |
| D | 0 | 22909 | 1 |
| Quadrant | Total seconds | Saturated seconds | Saturation percentage |
|---|---|---|---|
| A | 5882 | 77 | 1.309079% |
| B | 5882 | 91 | 1.547093% |
| C | 5882 | 49 | 0.833050% |
| D | 5882 | 371 | 6.307378% |
Noise dominated data is calculated using 1-second bins in cleaned event files. If a bin has >2000 counts, and if more than 50% of those come from <1% of pixels, then it is considered to be noise-dominated and hence unusable.
| Quadrant | # 1 sec bins | Bins with >0 counts | Bins with >2000 counts | High rate bins dominated by noise | Noise dominated (total time) | Noise dominated (detector-on time) | Marked lightcurve |
|---|---|---|---|---|---|---|---|
| A | 7177 | 5883 | 28 | 28 | 0.39% | 0.48% | 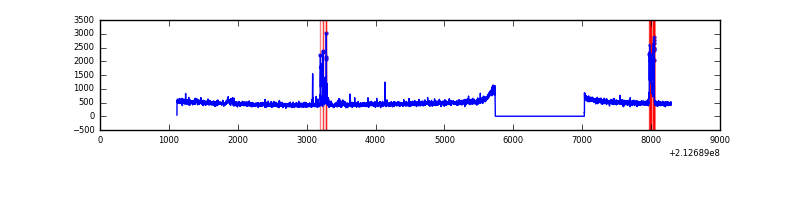 |
| B | 7177 | 5883 | 31 | 31 | 0.43% | 0.53% | 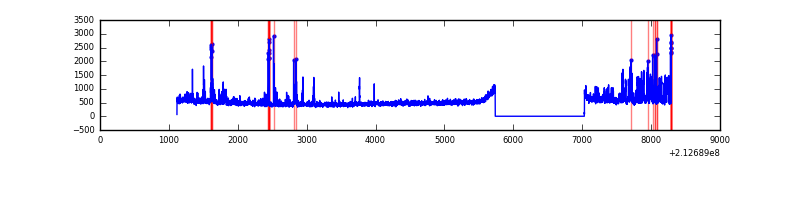 |
| C | 7177 | 5883 | 5 | 5 | 0.07% | 0.08% | 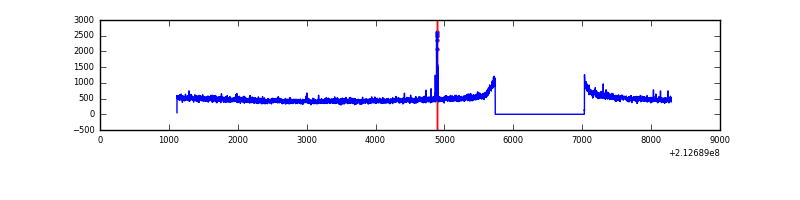 |
| D | 7177 | 5883 | 250 | 250 | 3.48% | 4.25% | 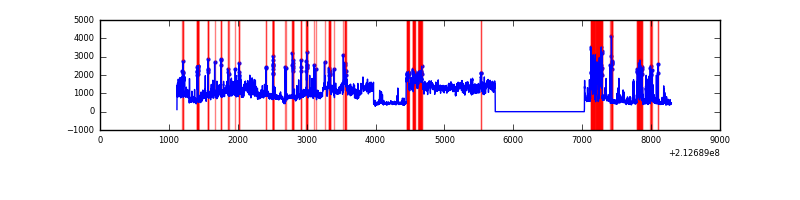 |
Top three noisy pixels from each quadrant. If the there are fewer than three noisy pixels in the level2.evt file, extra rows are filled as -1
| Pixel properties | Quadrant properties | ||||||
|---|---|---|---|---|---|---|---|
| Quadrant | DetID | PixID | Counts | Sigma | Mean | Median | Sigma |
| A | 0 | 50 | 124196 | 851.27 | 713 | 700 | 145.1 |
| A | 15 | 174 | 31920 | 215.2 | 713 | 700 | 145.1 |
| A | 13 | 6 | 27722 | 186.26 | 713 | 700 | 145.1 |
| B | 15 | 204 | 328169 | 2402.11 | 720 | 704 | 136.3 |
| B | 10 | 16 | 100409 | 731.38 | 720 | 704 | 136.3 |
| B | 15 | 54 | 23499 | 167.21 | 720 | 704 | 136.3 |
| C | 1 | 16 | 123827 | 766.6 | 690 | 695 | 160.6 |
| C | 9 | 247 | 28752 | 174.68 | 690 | 695 | 160.6 |
| C | 14 | 67 | 15076 | 89.53 | 690 | 695 | 160.6 |
| D | 2 | 63 | 3475800 | 20780.18 | 673 | 651 | 167.2 |
| D | 2 | 33 | 136738 | 813.75 | 673 | 651 | 167.2 |
| D | 4 | 95 | 64257 | 380.34 | 673 | 651 | 167.2 |
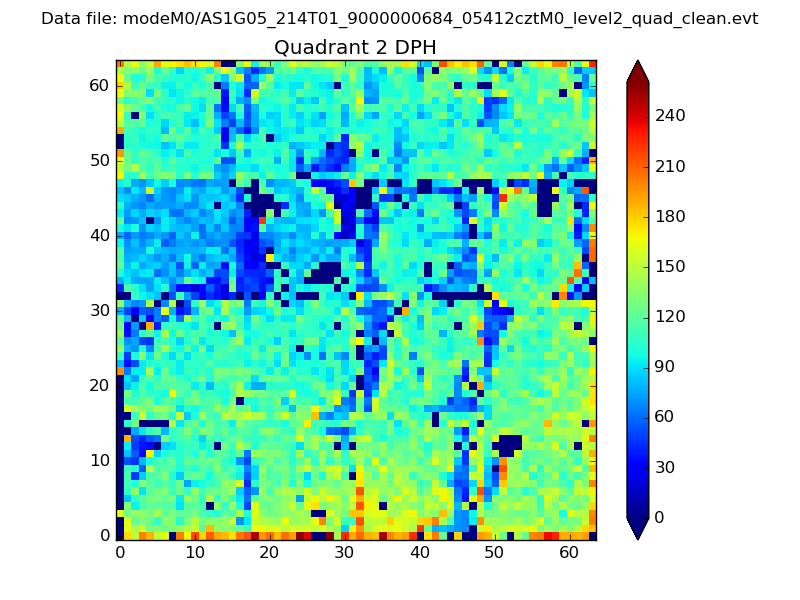
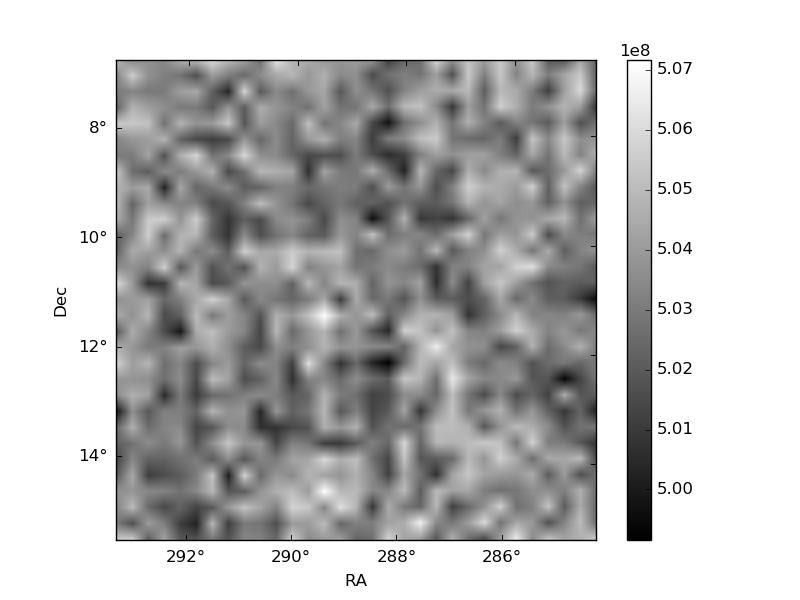
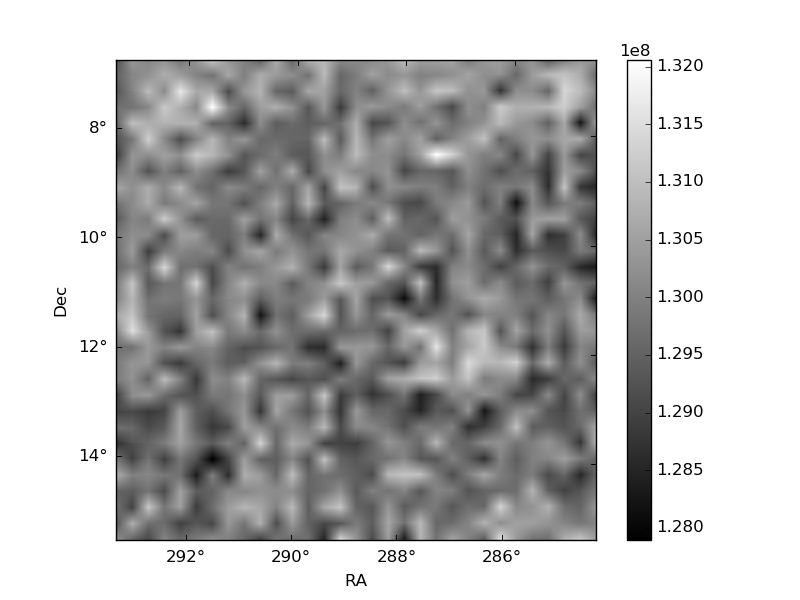
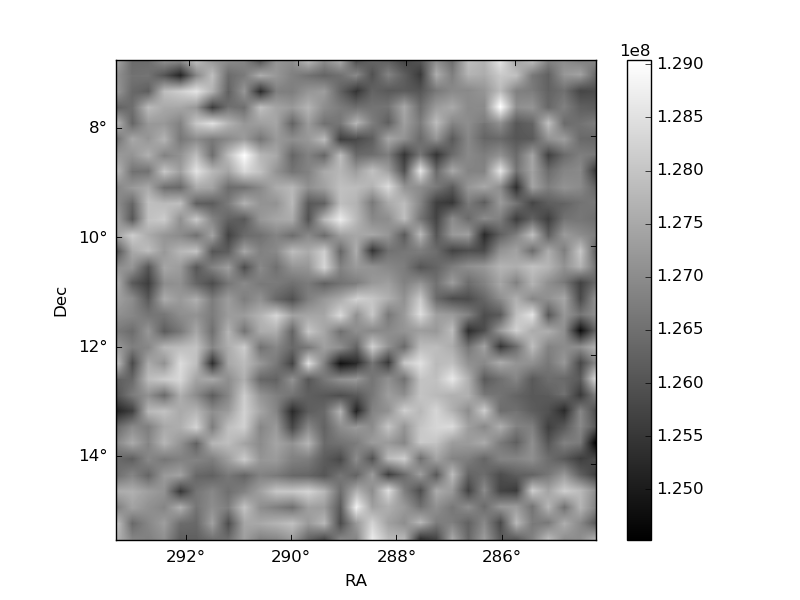
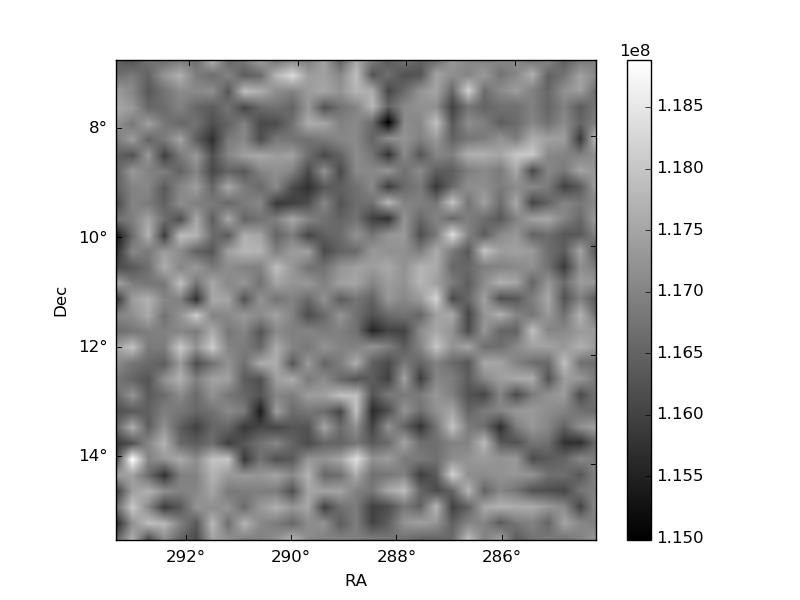
Histogram calculated using DETX and DETY for each event in the final _common_clean file
| Quadrant A | 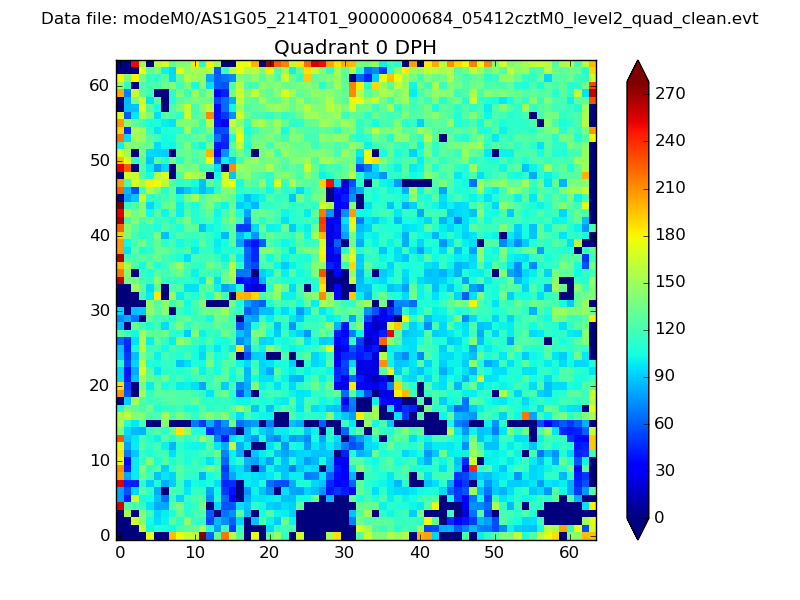 |
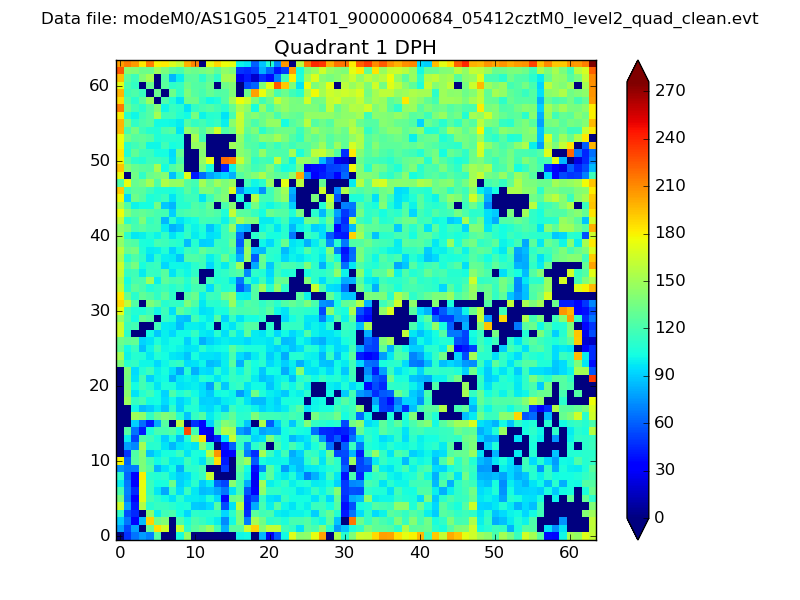 |
Quadrant B |
|---|---|---|---|
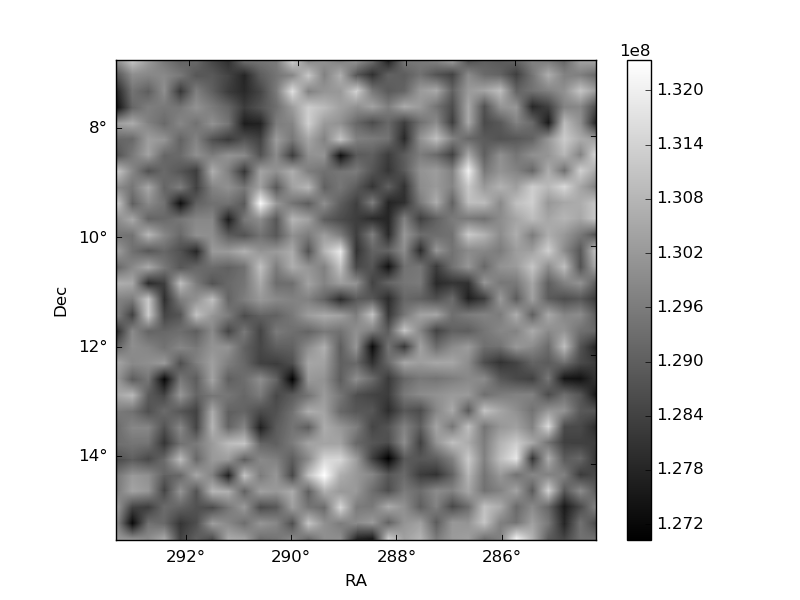
| Quadrant D | 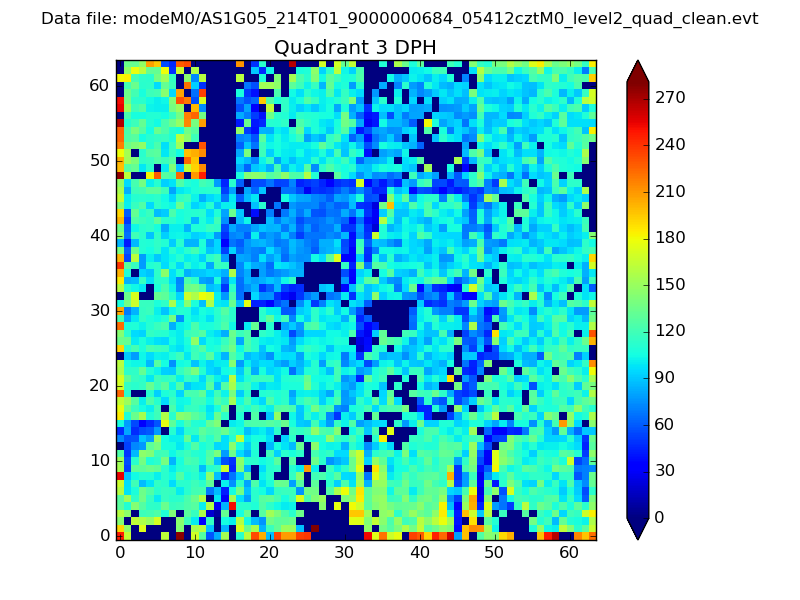 |
 |
Quadrant C |
| Plot type | Count rate plots | Images |
|---|---|---|
| Comparison with Poisson distribution Blue bars denote a histogram of data divided into 1 sec bins. Red curve is a Poisson curve with rate = median count rate of data. |
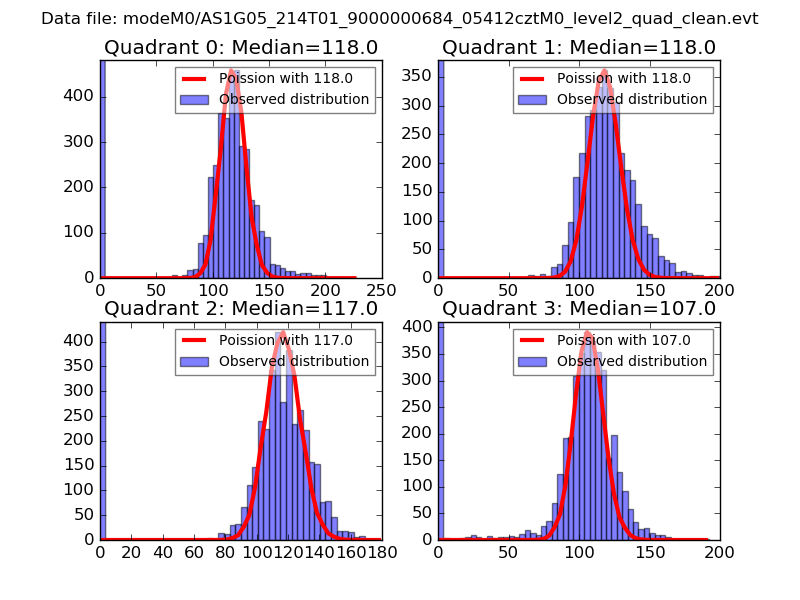 |
 |
| Quadrant-wise count rates Data is divided into 100 sec bins |
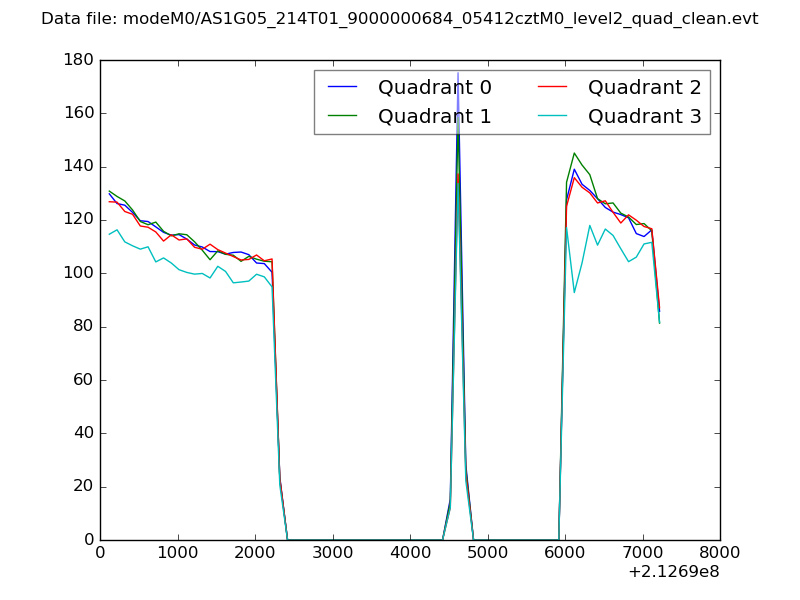 |
|
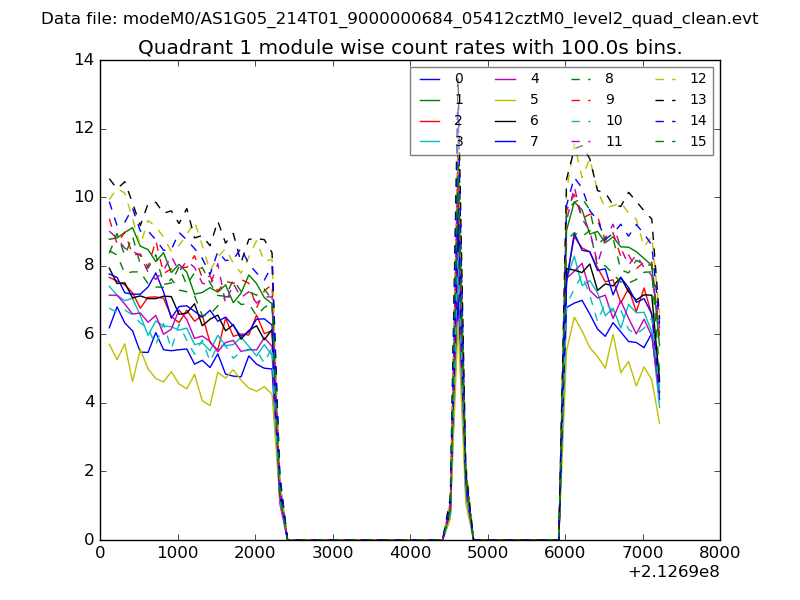
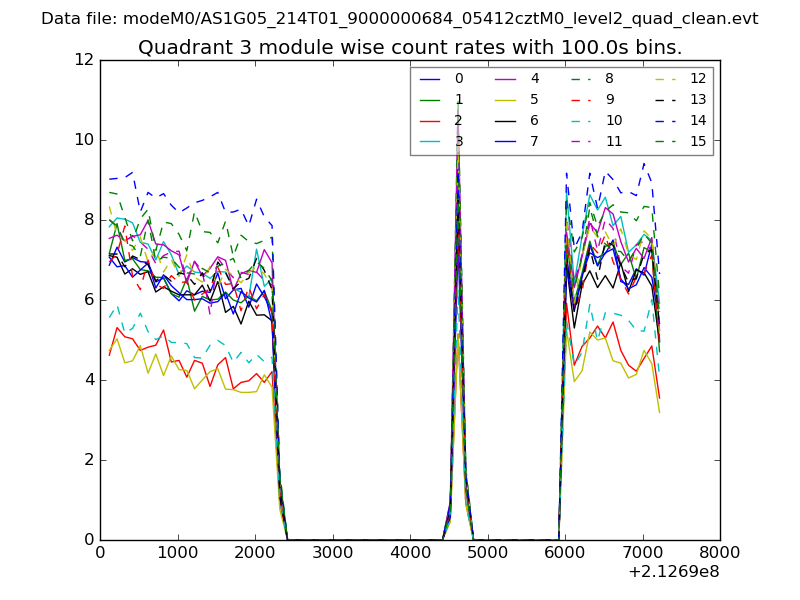
| Module-wise count rates for Quadrant A Data is divided into 100 sec bins |
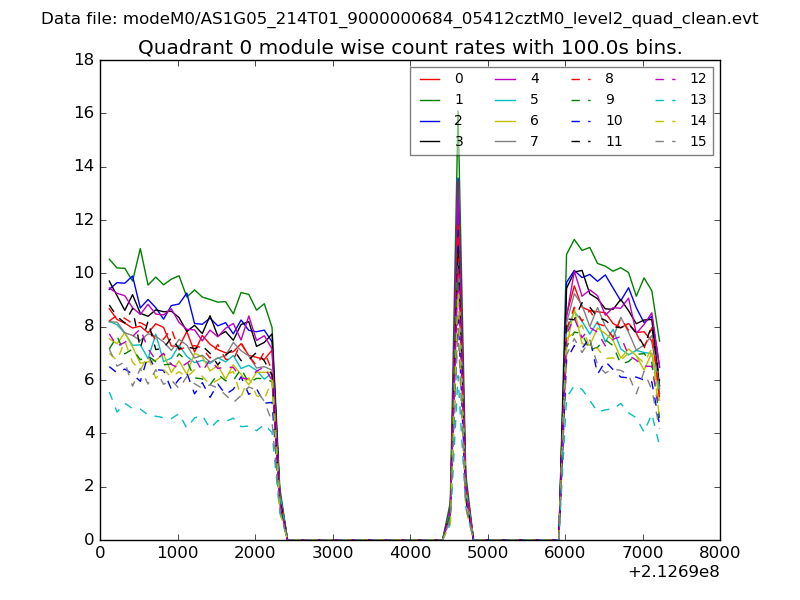 |
 |
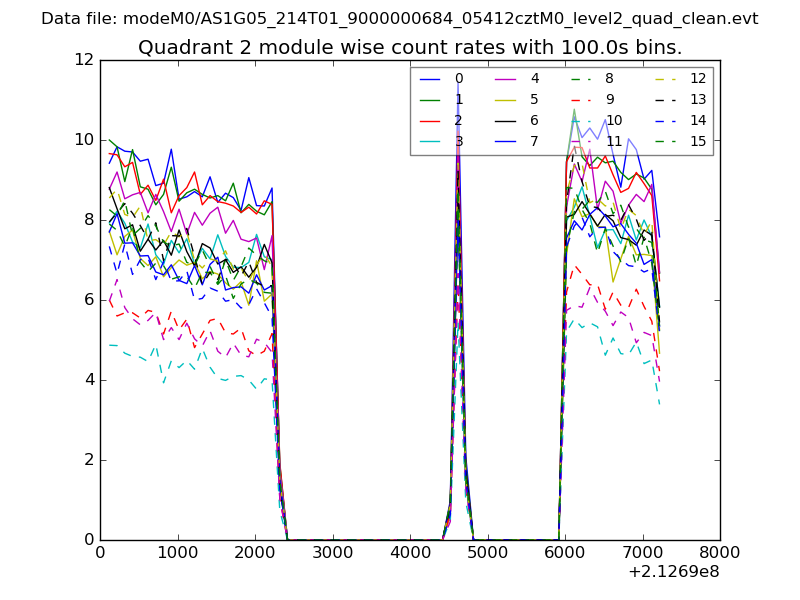
| Module-wise count rates for Quadrant B Data is divided into 100 sec bins |
 |
 |
| Module-wise count rates for Quadrant C Data is divided into 100 sec bins |
 |
 |
| Module-wise count rates for Quadrant D Data is divided into 100 sec bins |
 |
 |
| Parameter | Plot |
|---|---|
| CZT HV Monitor | 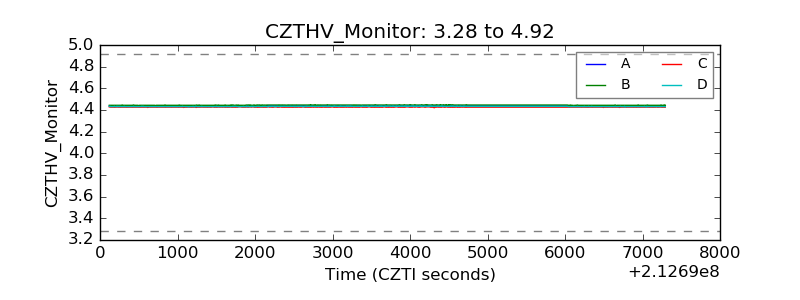 |
| D_VDD | 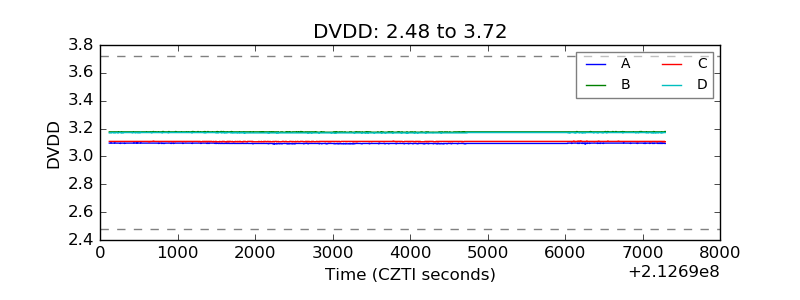 |
| Temperature 1 | 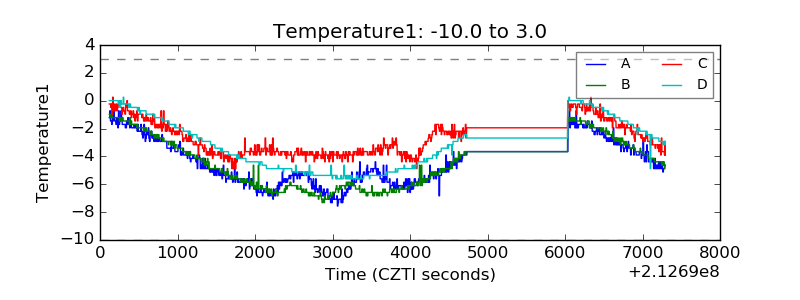 |
| Veto HV Monitor | 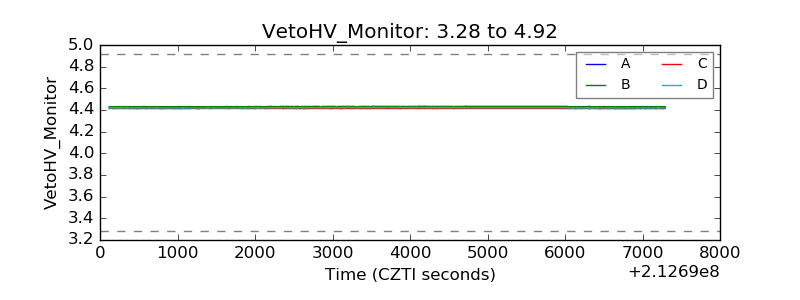 |
| Veto LLD | 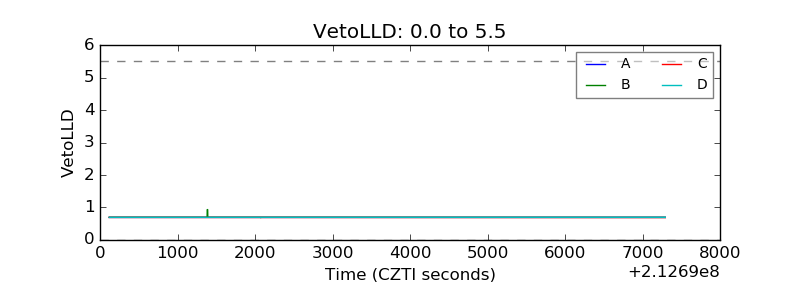 |
| Alpha Counter | 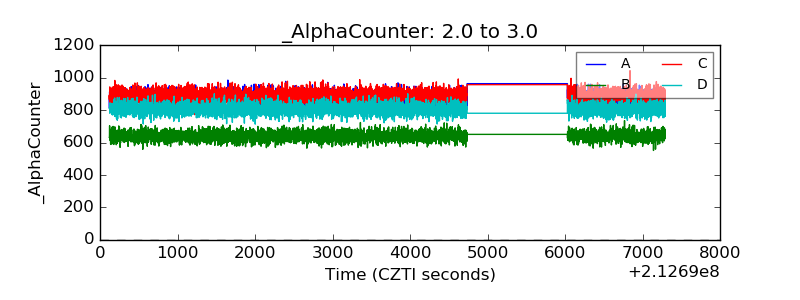 |
| _CPM_Rate | 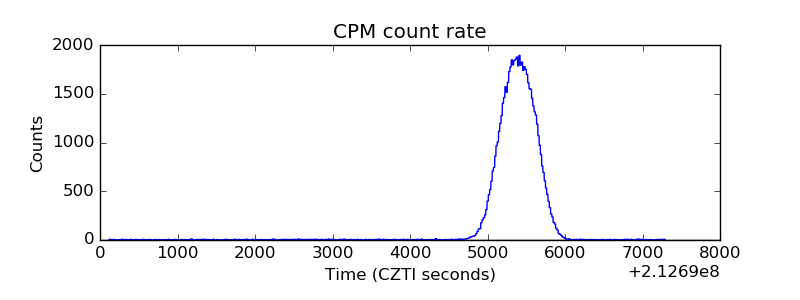 |
| CZT Counter | 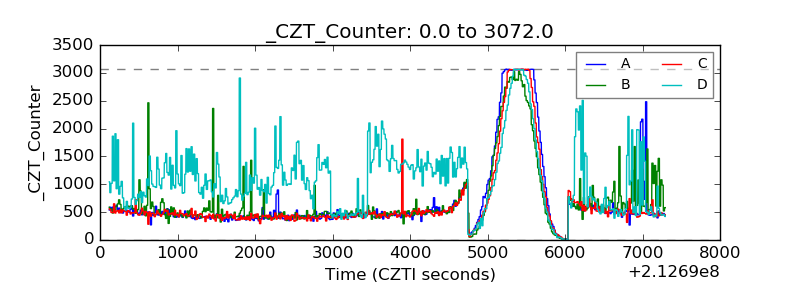 |
| +2.5 Volts monitor | 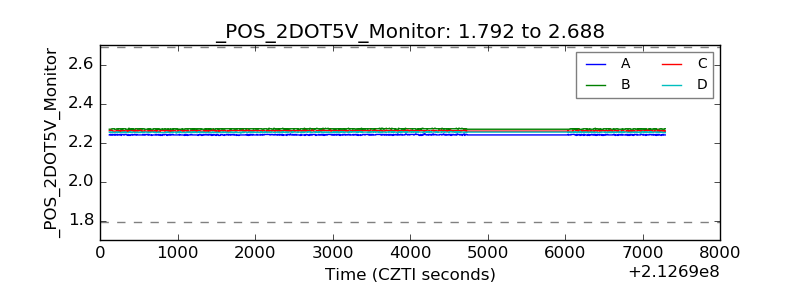 |
| +5 Volts monitor |  |
| _ROLL_ROT | 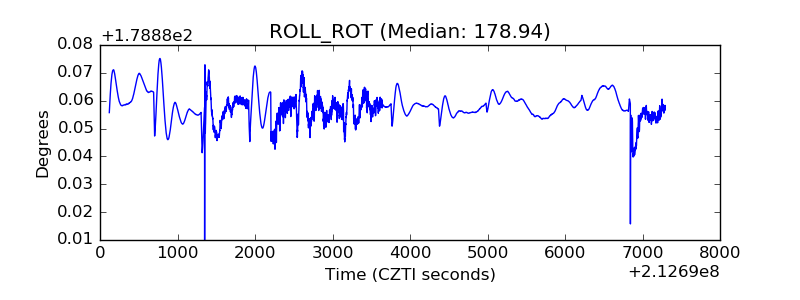 |
| _Roll_DEC | 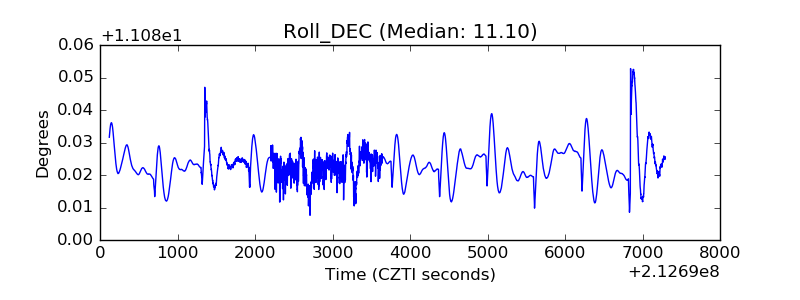 |
| _Roll_RA | 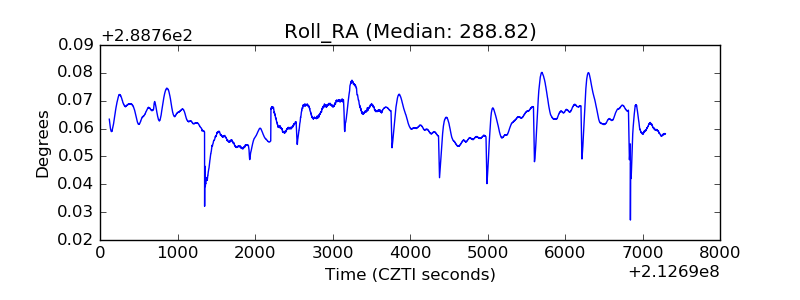 |
| Veto Counter | 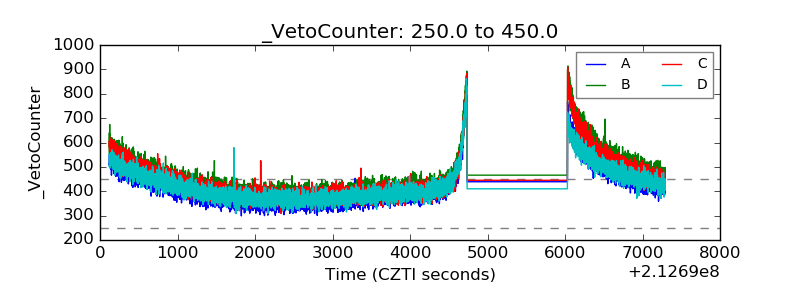 |