| Param | Original file | Final file |
|---|---|---|
| Filename | modeM0/AS1G05_214T01_9000000684_05413cztM0_level2.evt | modeM0/AS1G05_214T01_9000000684_05413cztM0_level2_quad_clean.evt |
| Size (bytes) | 462,585,600 | 76,711,680 |
| Size | 441.2 MB | 73.2 MB |
| Events in quadrant A | 3,115,378 | 478,525 |
| Events in quadrant B | 3,703,636 | 485,006 |
| Events in quadrant C | 3,073,951 | 480,187 |
| Events in quadrant D | 3,690,478 | 441,300 |
| Mode M9 | |||
|---|---|---|---|
| Quadrant | BADHDUFLAG | Total packets | Discarded packets |
| A | 0 | 15 | 0 |
| B | 0 | 15 | 0 |
| C | 0 | 15 | 0 |
| D | 0 | 16 | 0 |
| Mode SS | |||
|---|---|---|---|
| Quadrant | BADHDUFLAG | Total packets | Discarded packets |
| A | 0 | 128 | 0 |
| B | 0 | 128 | 0 |
| C | 0 | 128 | 0 |
| D | 0 | 128 | 0 |
| Mode M0 | |||
|---|---|---|---|
| Quadrant | BADHDUFLAG | Total packets | Discarded packets |
| A | 0 | 13387 | 3 |
| B | 0 | 15109 | 2 |
| C | 0 | 13288 | 2 |
| D | 0 | 15265 | 2 |
| Quadrant | Total seconds | Saturated seconds | Saturation percentage |
|---|---|---|---|
| A | 6269 | 81 | 1.292072% |
| B | 6269 | 109 | 1.738714% |
| C | 6269 | 41 | 0.654012% |
| D | 6269 | 207 | 3.301962% |
Noise dominated data is calculated using 1-second bins in cleaned event files. If a bin has >2000 counts, and if more than 50% of those come from <1% of pixels, then it is considered to be noise-dominated and hence unusable.
| Quadrant | # 1 sec bins | Bins with >0 counts | Bins with >2000 counts | High rate bins dominated by noise | Noise dominated (total time) | Noise dominated (detector-on time) | Marked lightcurve |
|---|---|---|---|---|---|---|---|
| A | 7584 | 6270 | 25 | 25 | 0.33% | 0.40% | 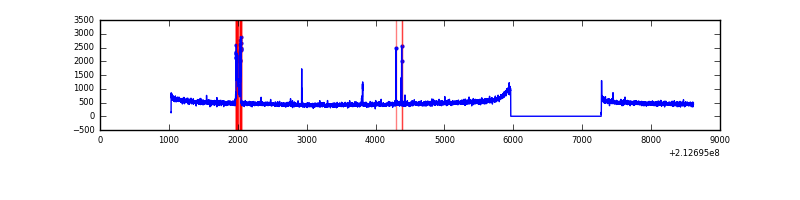 |
| B | 7584 | 6270 | 44 | 44 | 0.58% | 0.70% |  |
| C | 7584 | 6270 | 0 | 0 | 0.00% | 0.00% | 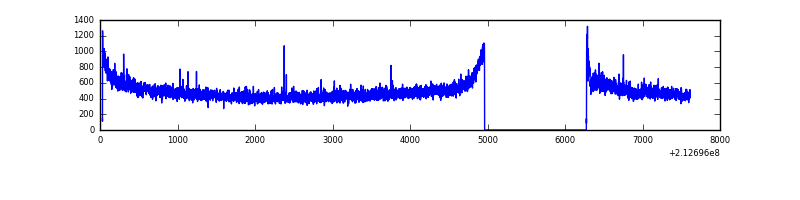 |
| D | 7584 | 6270 | 134 | 134 | 1.77% | 2.14% | 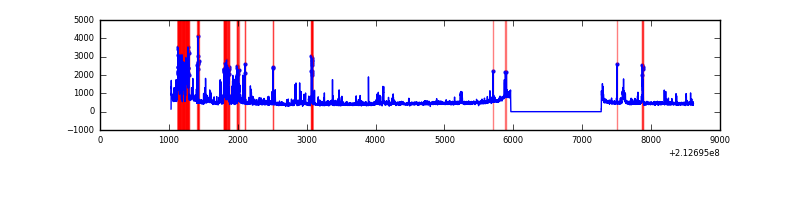 |
Top three noisy pixels from each quadrant. If the there are fewer than three noisy pixels in the level2.evt file, extra rows are filled as -1
| Pixel properties | Quadrant properties | ||||||
|---|---|---|---|---|---|---|---|
| Quadrant | DetID | PixID | Counts | Sigma | Mean | Median | Sigma |
| A | 0 | 50 | 123277 | 783.01 | 767 | 751 | 156.5 |
| A | 13 | 6 | 23860 | 147.68 | 767 | 751 | 156.5 |
| A | 0 | 247 | 9538 | 56.15 | 767 | 751 | 156.5 |
| B | 15 | 204 | 423896 | 2865.03 | 779 | 764 | 147.7 |
| B | 10 | 16 | 162257 | 1093.47 | 779 | 764 | 147.7 |
| B | 0 | 219 | 24944 | 163.72 | 779 | 764 | 147.7 |
| C | 1 | 16 | 144416 | 825.75 | 748 | 753 | 174.0 |
| C | 13 | 61 | 6052 | 30.46 | 748 | 753 | 174.0 |
| C | 14 | 67 | 5439 | 26.93 | 748 | 753 | 174.0 |
| D | 2 | 63 | 474726 | 2596.53 | 732 | 710 | 182.6 |
| D | 2 | 33 | 149255 | 813.69 | 732 | 710 | 182.6 |
| D | 4 | 95 | 115821 | 630.55 | 732 | 710 | 182.6 |
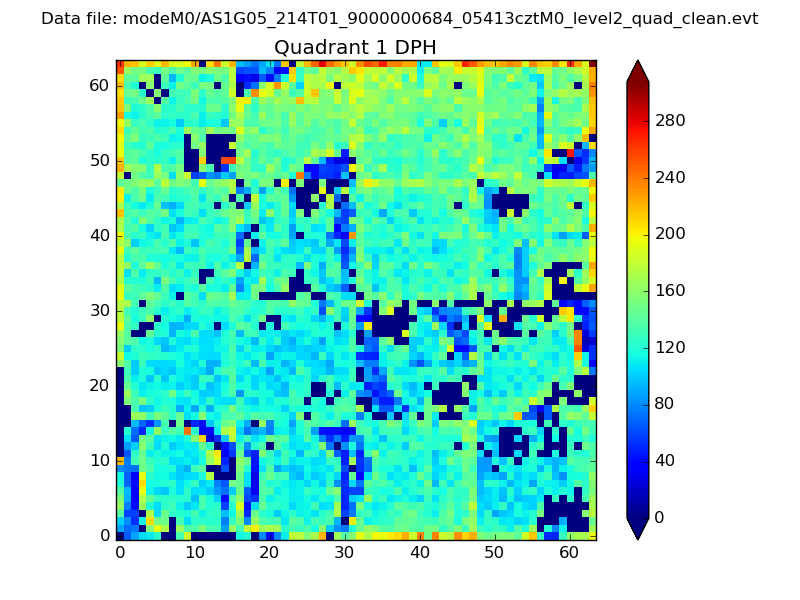
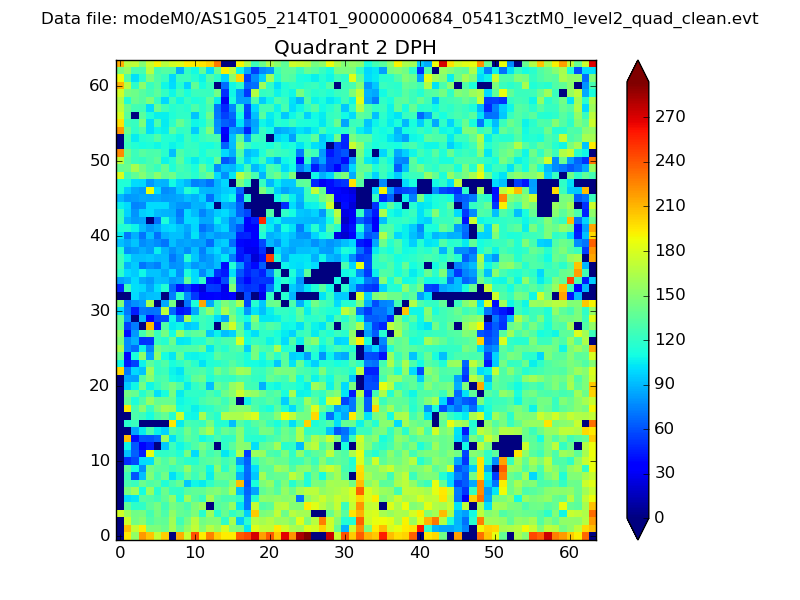
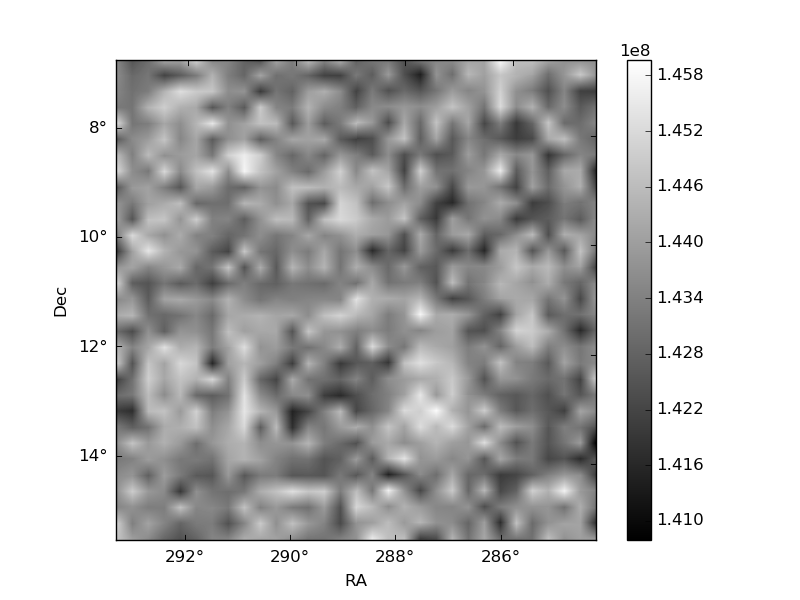
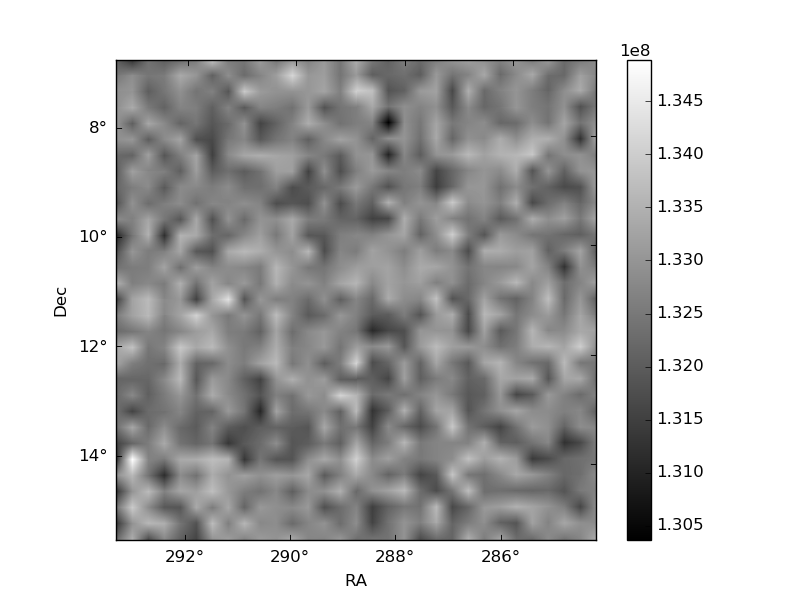
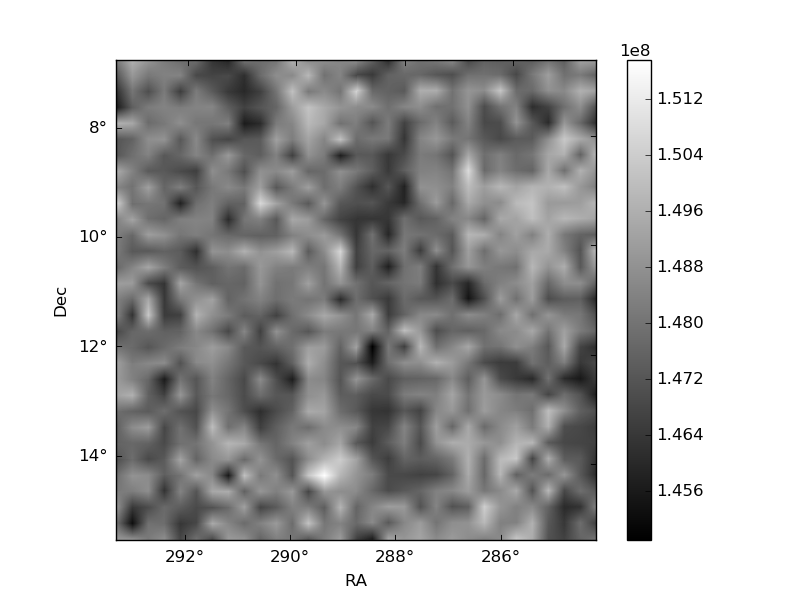
Histogram calculated using DETX and DETY for each event in the final _common_clean file
| Quadrant A | 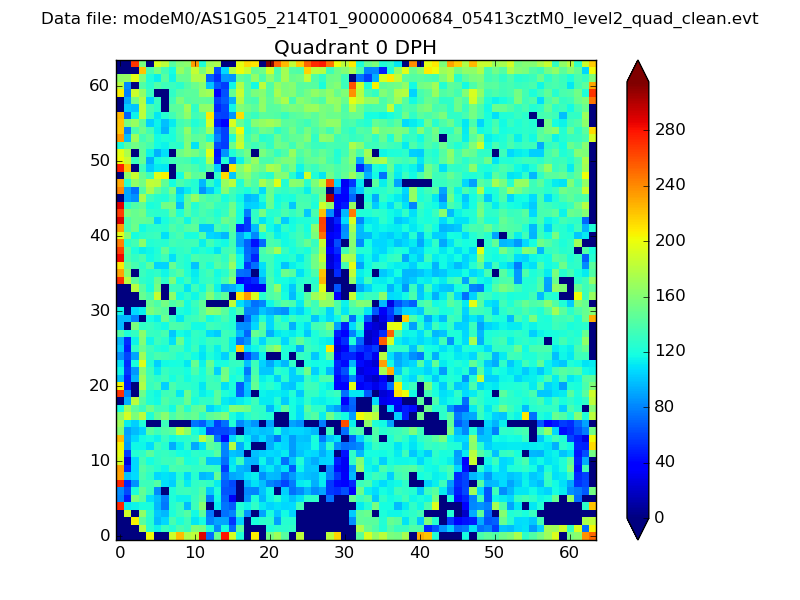 |
 |
Quadrant B |
|---|---|---|---|
| Quadrant D | 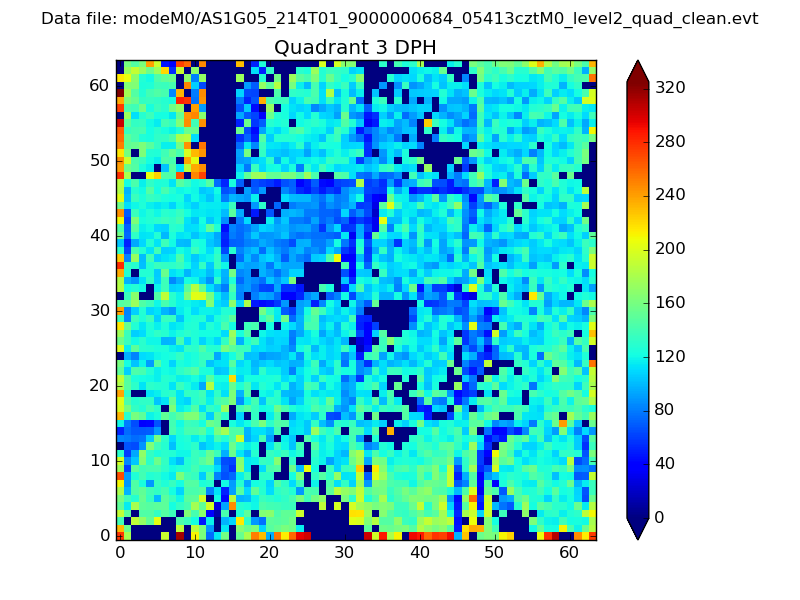 |
 |
Quadrant C |
| Plot type | Count rate plots | Images |
|---|---|---|
| Comparison with Poisson distribution Blue bars denote a histogram of data divided into 1 sec bins. Red curve is a Poisson curve with rate = median count rate of data. |
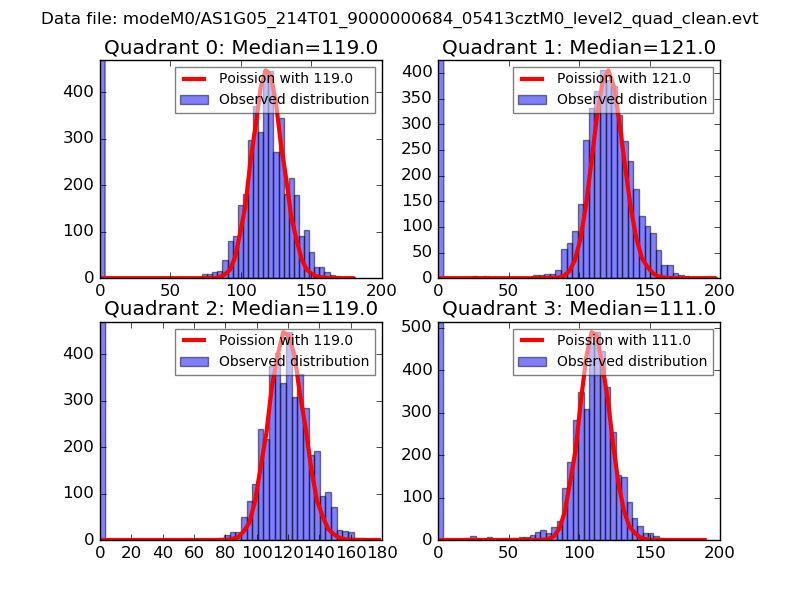 |
 |
| Quadrant-wise count rates Data is divided into 100 sec bins |
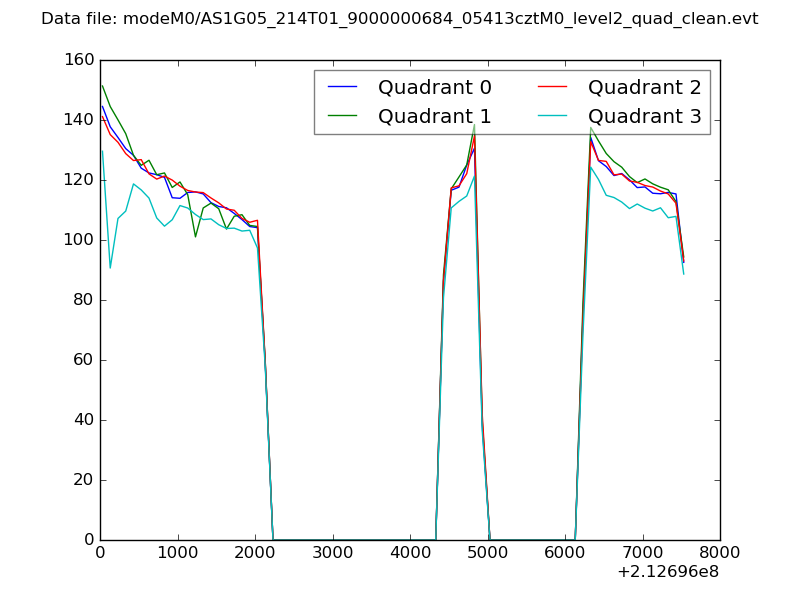 |
|
| Module-wise count rates for Quadrant A Data is divided into 100 sec bins |
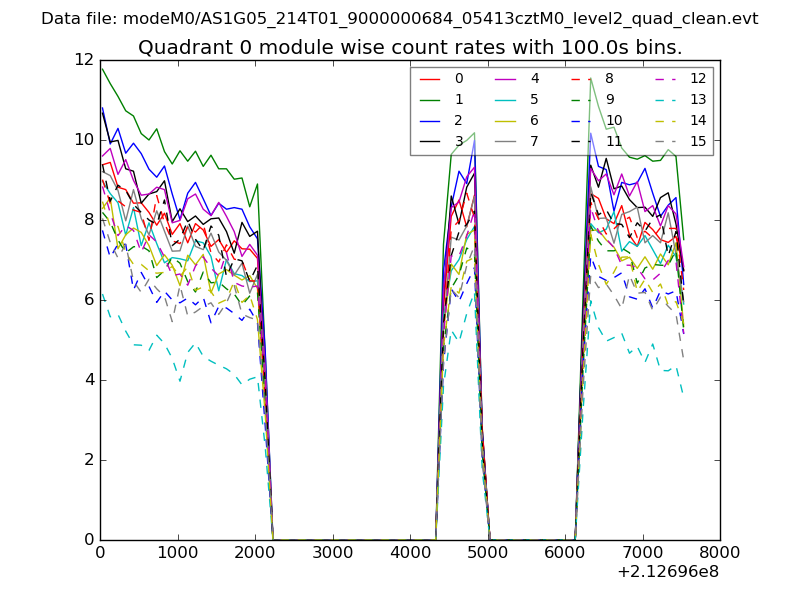 |
 |
| Module-wise count rates for Quadrant B Data is divided into 100 sec bins |
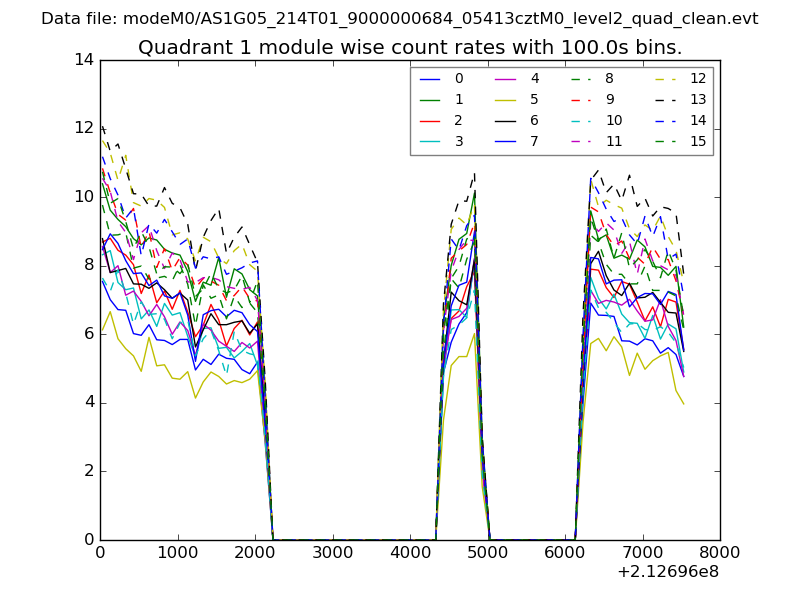 |
 |
| Module-wise count rates for Quadrant C Data is divided into 100 sec bins |
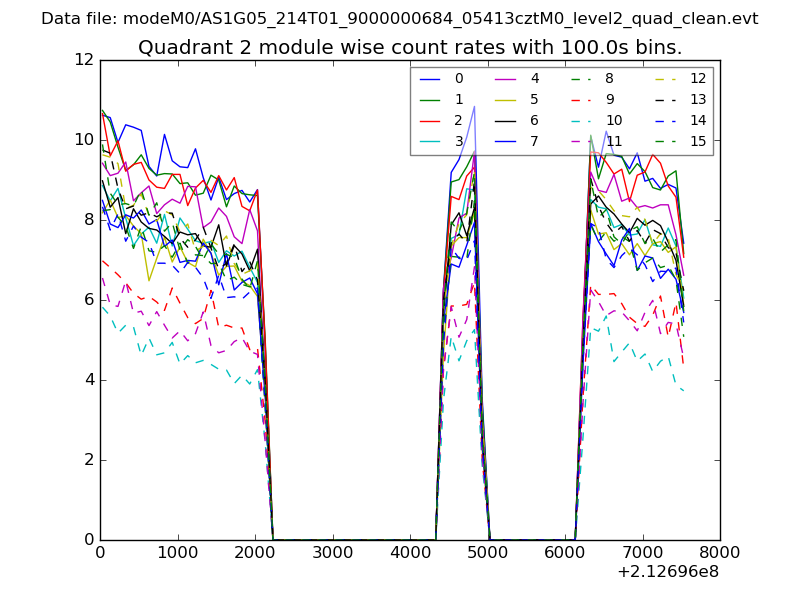 |
 |
| Module-wise count rates for Quadrant D Data is divided into 100 sec bins |
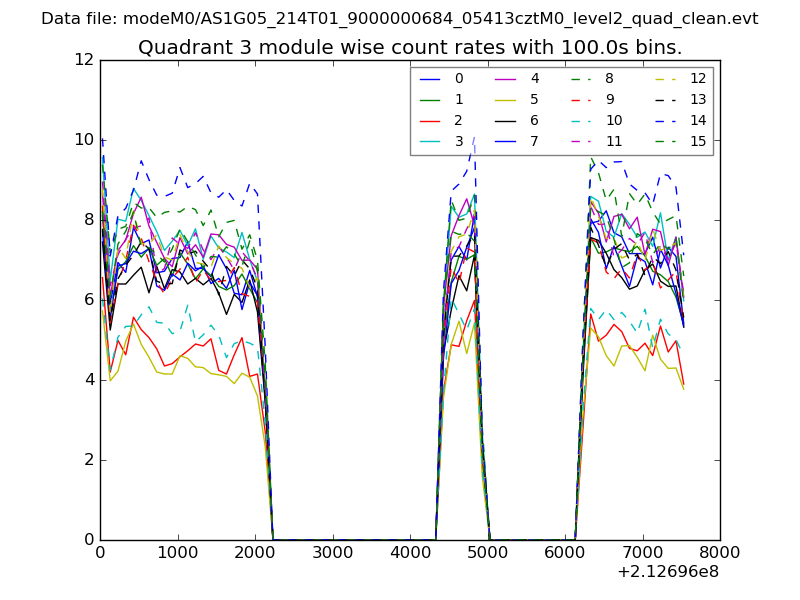 |
 |
| Parameter | Plot |
|---|---|
| CZT HV Monitor | 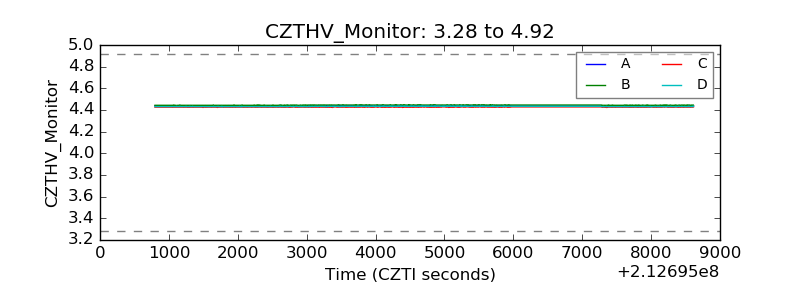 |
| D_VDD | 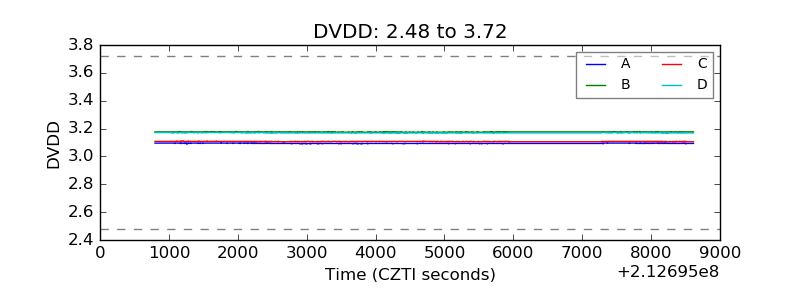 |
| Temperature 1 | 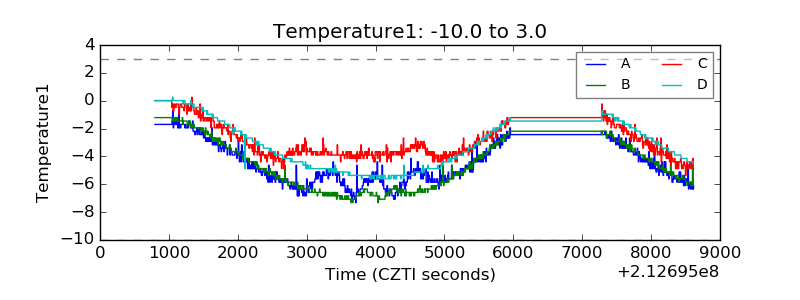 |
| Veto HV Monitor | 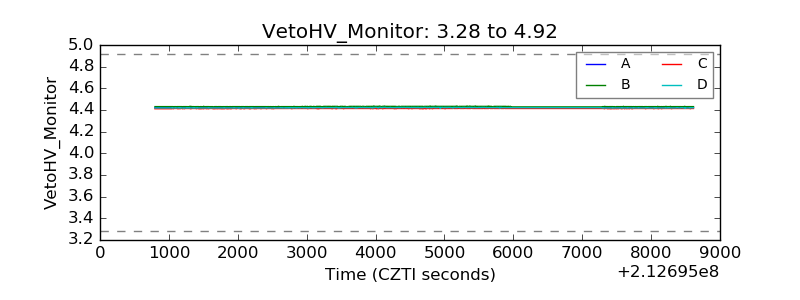 |
| Veto LLD | 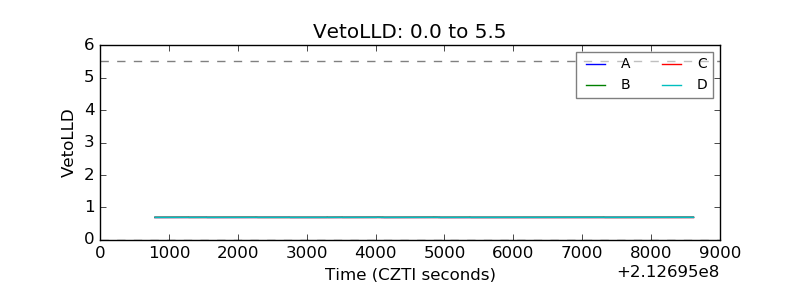 |
| Alpha Counter | 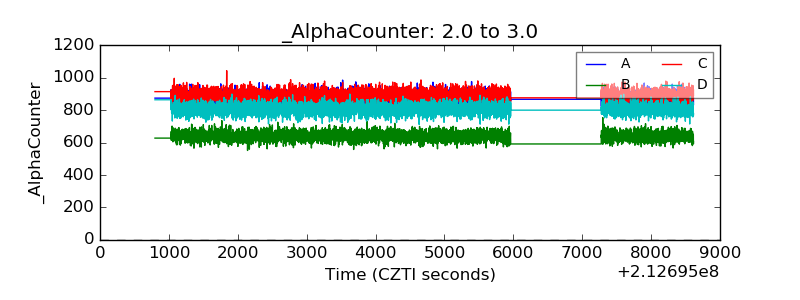 |
| _CPM_Rate | 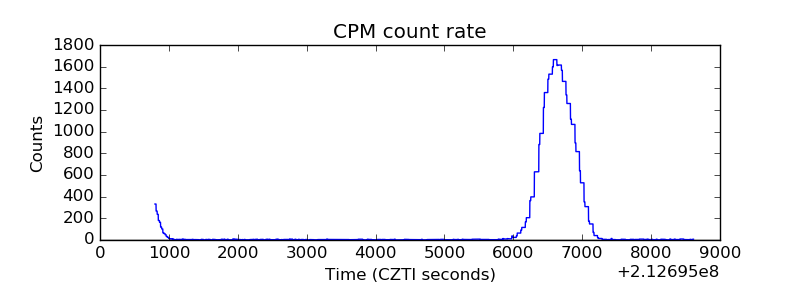 |
| CZT Counter | 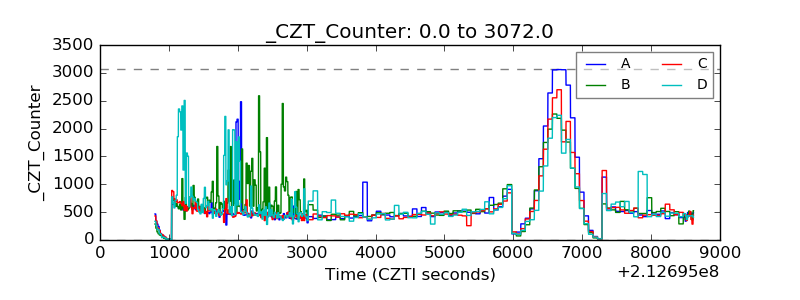 |
| +2.5 Volts monitor |  |
| +5 Volts monitor |  |
| _ROLL_ROT | 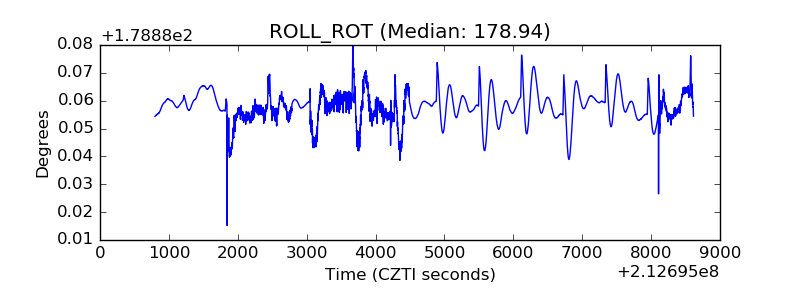 |
| _Roll_DEC | 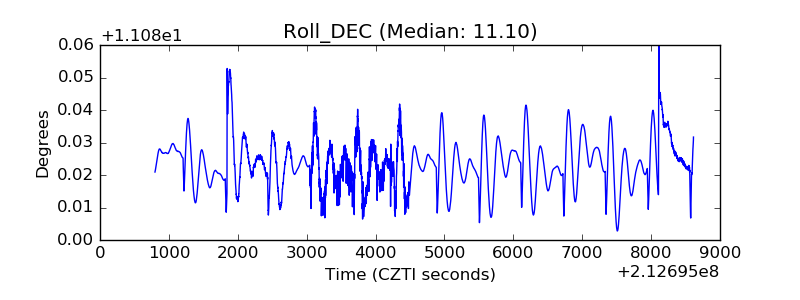 |
| _Roll_RA |  |
| Veto Counter | 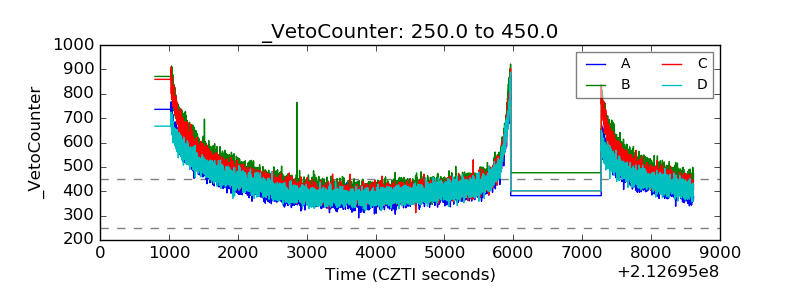 |