| Param | Original file | Final file |
|---|---|---|
| Filename | modeM0/AS1G05_214T01_9000000684_05416cztM0_level2.evt | modeM0/AS1G05_214T01_9000000684_05416cztM0_level2_quad_clean.evt |
| Size (bytes) | 307,984,320 | 46,540,800 |
| Size | 293.7 MB | 44.4 MB |
| Events in quadrant A | 2,161,905 | 271,800 |
| Events in quadrant B | 2,354,652 | 272,210 |
| Events in quadrant C | 2,104,155 | 272,661 |
| Events in quadrant D | 2,382,142 | 258,154 |
| Mode M9 | |||
|---|---|---|---|
| Quadrant | BADHDUFLAG | Total packets | Discarded packets |
| A | 0 | 11 | 0 |
| B | 0 | 11 | 0 |
| C | 0 | 11 | 0 |
| D | 0 | 11 | 0 |
| Mode SS | |||
|---|---|---|---|
| Quadrant | BADHDUFLAG | Total packets | Discarded packets |
| A | 0 | 96 | 0 |
| B | 0 | 96 | 0 |
| C | 0 | 96 | 0 |
| D | 0 | 96 | 0 |
| Mode M0 | |||
|---|---|---|---|
| Quadrant | BADHDUFLAG | Total packets | Discarded packets |
| A | 0 | 9841 | 1 |
| B | 0 | 10187 | 1 |
| C | 0 | 9755 | 1 |
| D | 0 | 10562 | 1 |
| Quadrant | Total seconds | Saturated seconds | Saturation percentage |
|---|---|---|---|
| A | 4758 | 33 | 0.693569% |
| B | 4758 | 65 | 1.366120% |
| C | 4758 | 20 | 0.420345% |
| D | 4758 | 46 | 0.966793% |
Noise dominated data is calculated using 1-second bins in cleaned event files. If a bin has >2000 counts, and if more than 50% of those come from <1% of pixels, then it is considered to be noise-dominated and hence unusable.
| Quadrant | # 1 sec bins | Bins with >0 counts | Bins with >2000 counts | High rate bins dominated by noise | Noise dominated (total time) | Noise dominated (detector-on time) | Marked lightcurve |
|---|---|---|---|---|---|---|---|
| A | 5798 | 4759 | 1 | 1 | 0.02% | 0.02% | 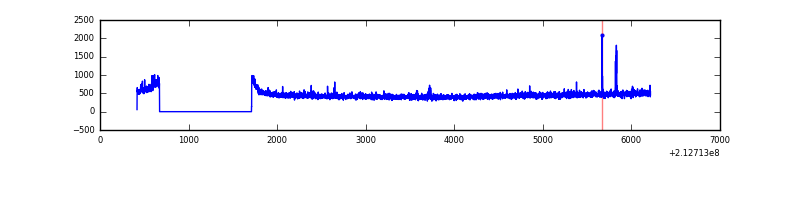 |
| B | 5798 | 4759 | 4 | 4 | 0.07% | 0.08% | 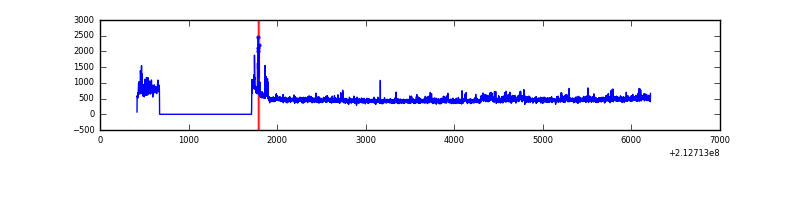 |
| C | 5798 | 4759 | 0 | 0 | 0.00% | 0.00% | 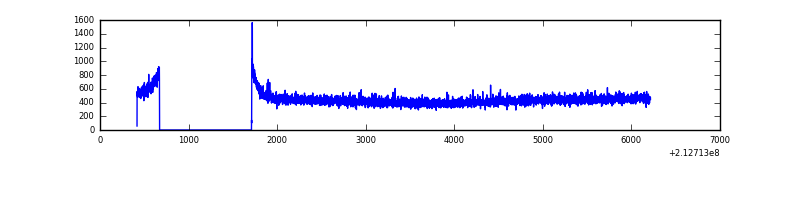 |
| D | 5798 | 4759 | 23 | 23 | 0.40% | 0.48% | 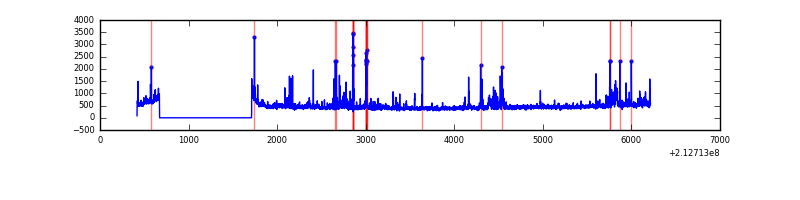 |
Top three noisy pixels from each quadrant. If the there are fewer than three noisy pixels in the level2.evt file, extra rows are filled as -1
| Pixel properties | Quadrant properties | ||||||
|---|---|---|---|---|---|---|---|
| Quadrant | DetID | PixID | Counts | Sigma | Mean | Median | Sigma |
| A | 0 | 50 | 29819 | 256.17 | 549 | 536 | 114.3 |
| A | 13 | 6 | 13044 | 109.42 | 549 | 536 | 114.3 |
| A | 12 | 194 | 5478 | 43.23 | 549 | 536 | 114.3 |
| B | 15 | 204 | 103970 | 957.43 | 558 | 544 | 108.0 |
| B | 4 | 48 | 39857 | 363.93 | 558 | 544 | 108.0 |
| B | 0 | 219 | 17399 | 156.03 | 558 | 544 | 108.0 |
| C | 14 | 67 | 7751 | 57.24 | 536 | 538 | 126.0 |
| C | 13 | 61 | 4346 | 30.22 | 536 | 538 | 126.0 |
| C | 12 | 4 | 3117 | 20.47 | 536 | 538 | 126.0 |
| D | 2 | 152 | 153905 | 1156.51 | 530 | 513 | 132.6 |
| D | 2 | 33 | 82442 | 617.71 | 530 | 513 | 132.6 |
| D | 8 | 195 | 50738 | 378.67 | 530 | 513 | 132.6 |
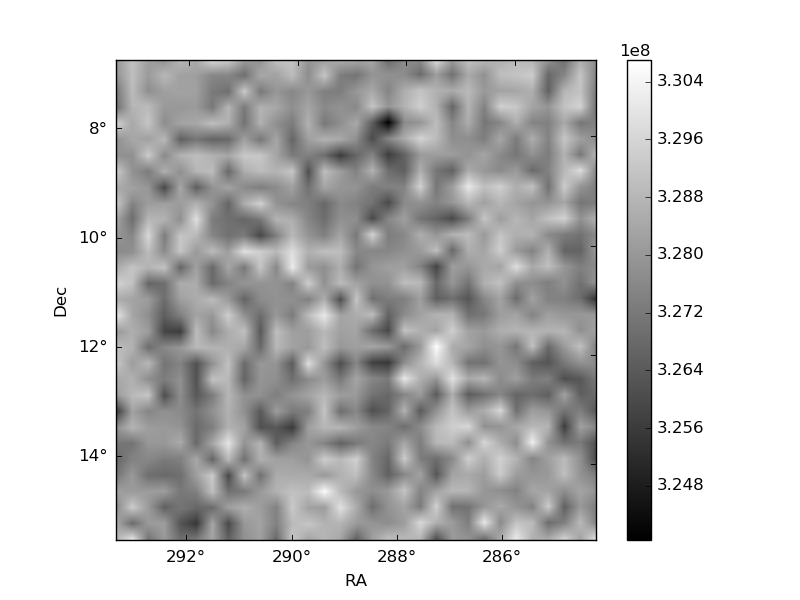
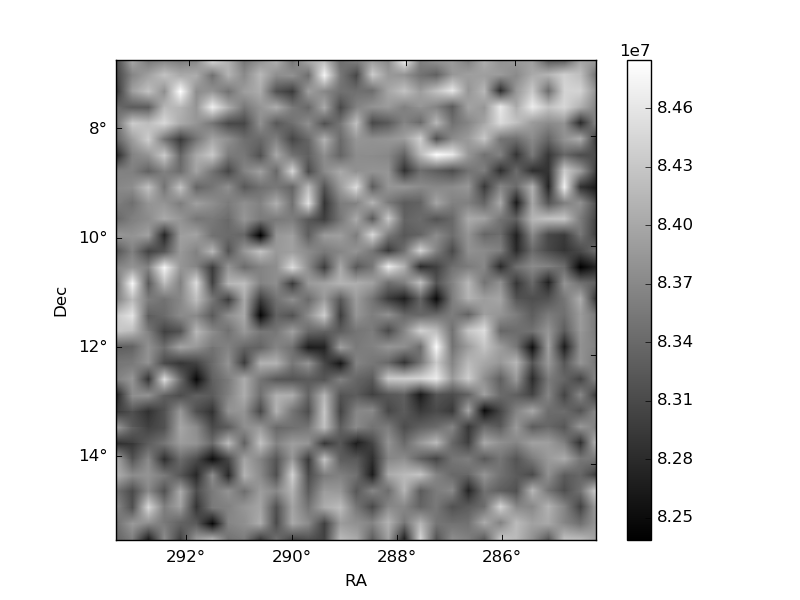
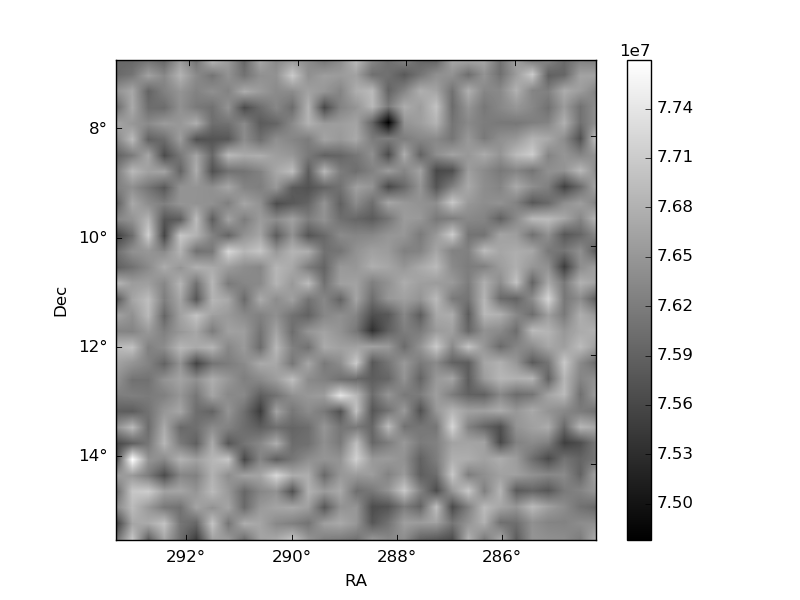
Histogram calculated using DETX and DETY for each event in the final _common_clean file
| Quadrant A | 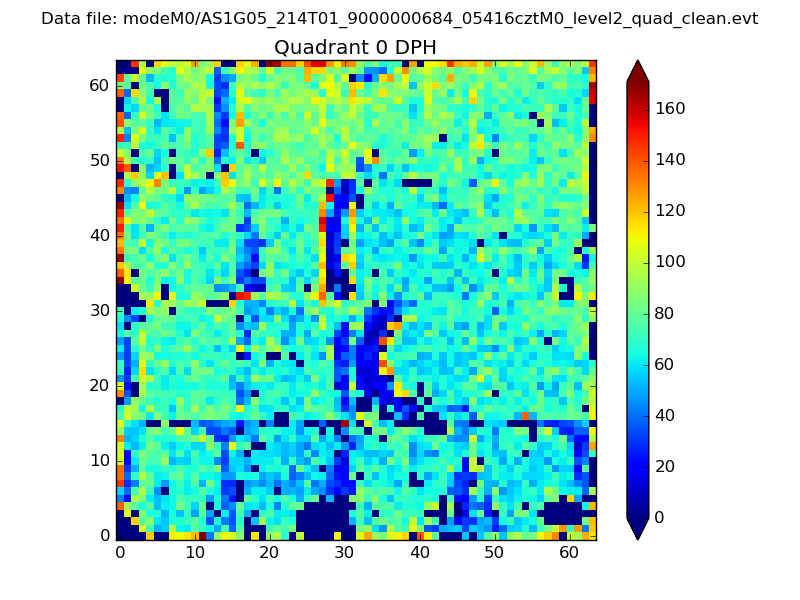 |
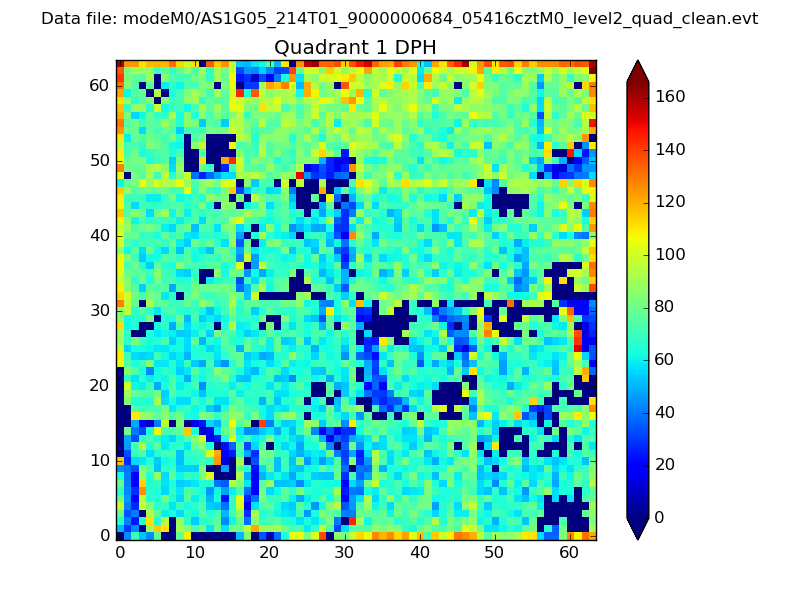 |
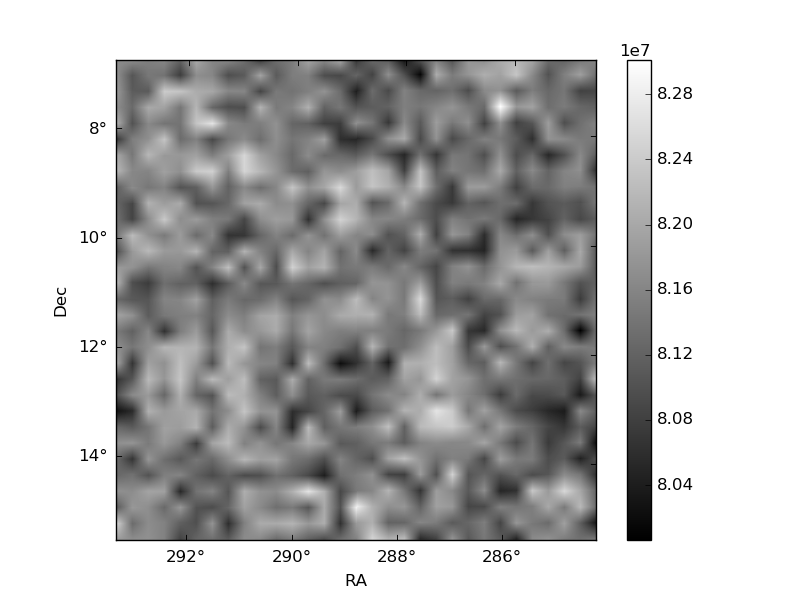
Quadrant B |
|---|---|---|---|
| Quadrant D | 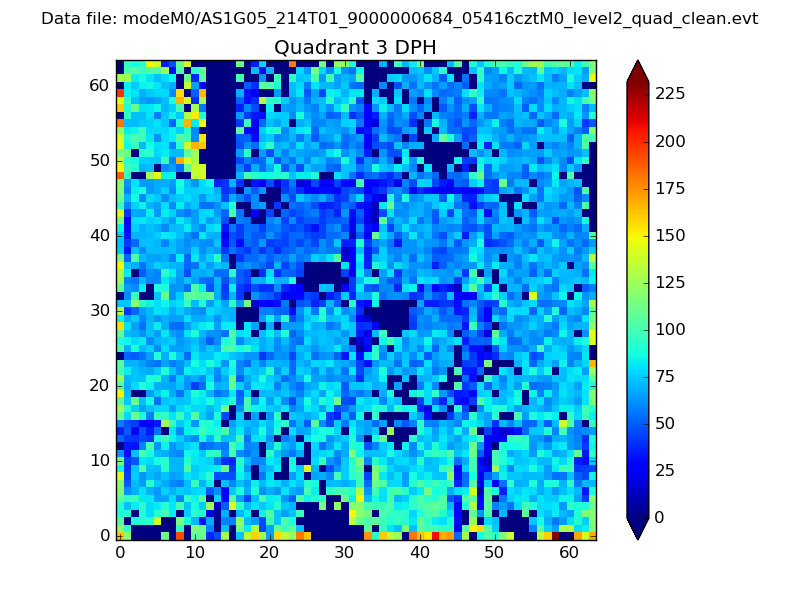 |
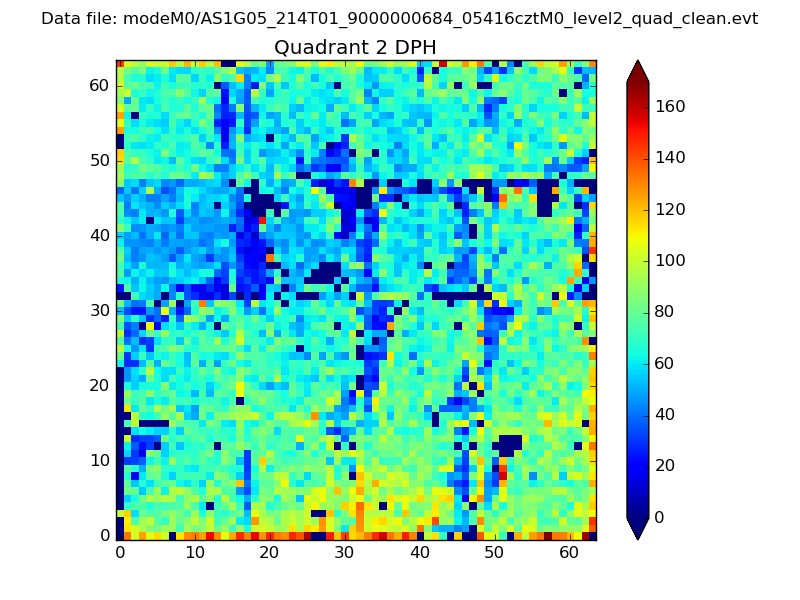 |
Quadrant C |
| Plot type | Count rate plots | Images |
|---|---|---|
| Comparison with Poisson distribution Blue bars denote a histogram of data divided into 1 sec bins. Red curve is a Poisson curve with rate = median count rate of data. |
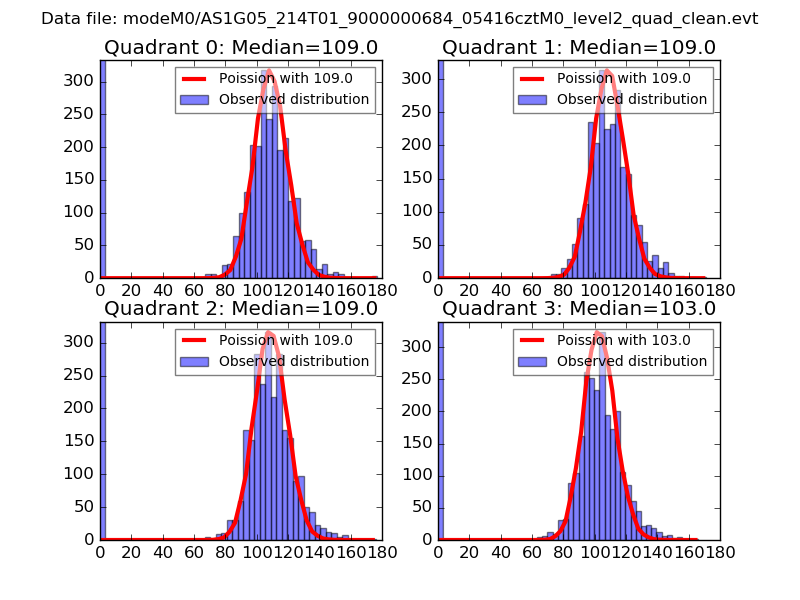 |
 |
| Quadrant-wise count rates Data is divided into 100 sec bins |
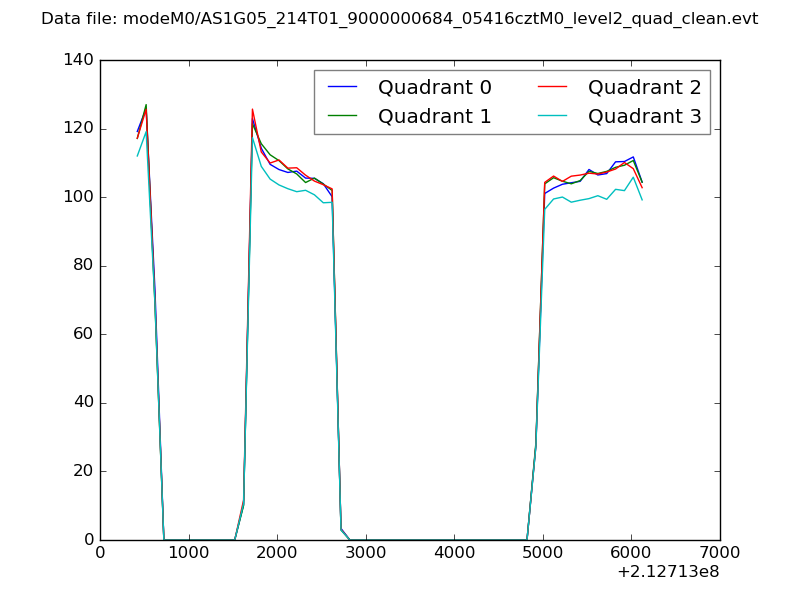 |
|
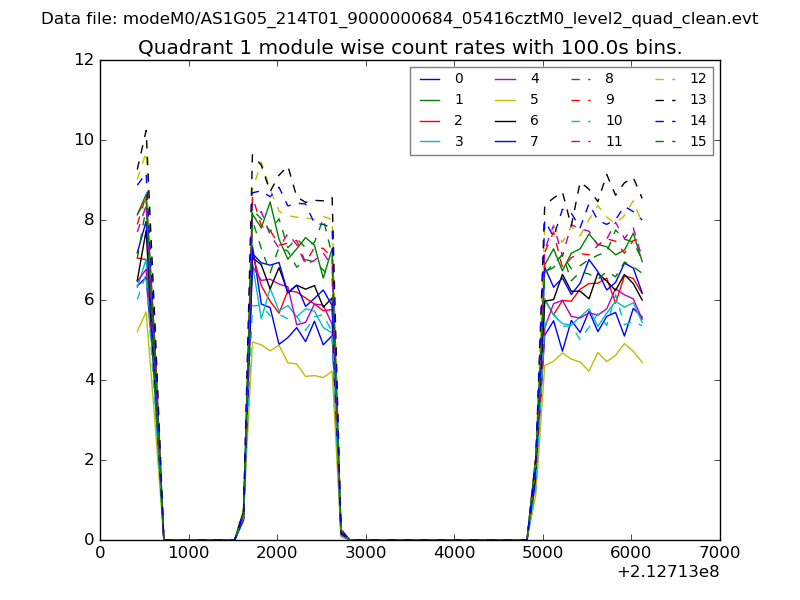
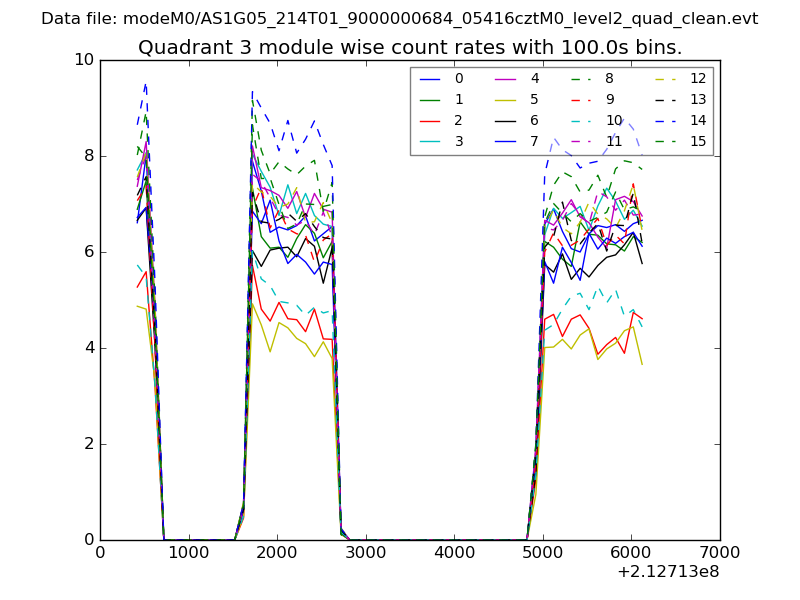
| Module-wise count rates for Quadrant A Data is divided into 100 sec bins |
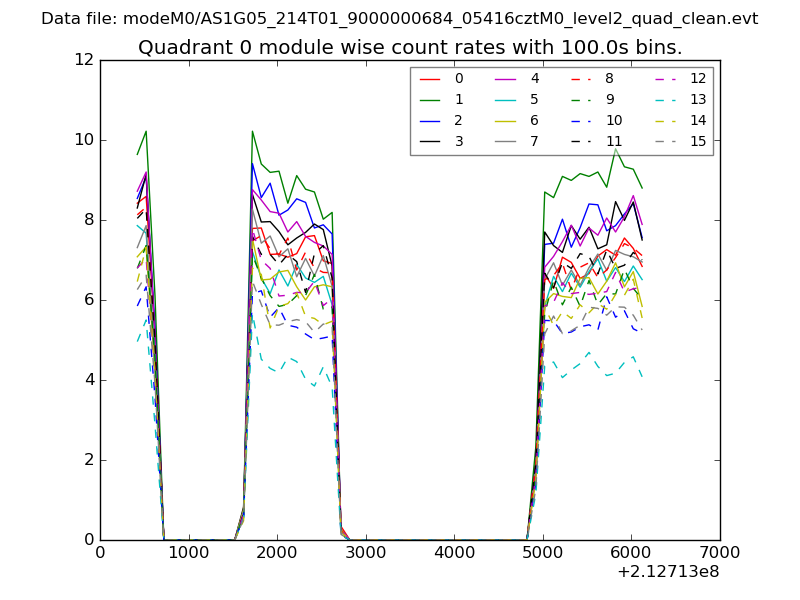 |
 |
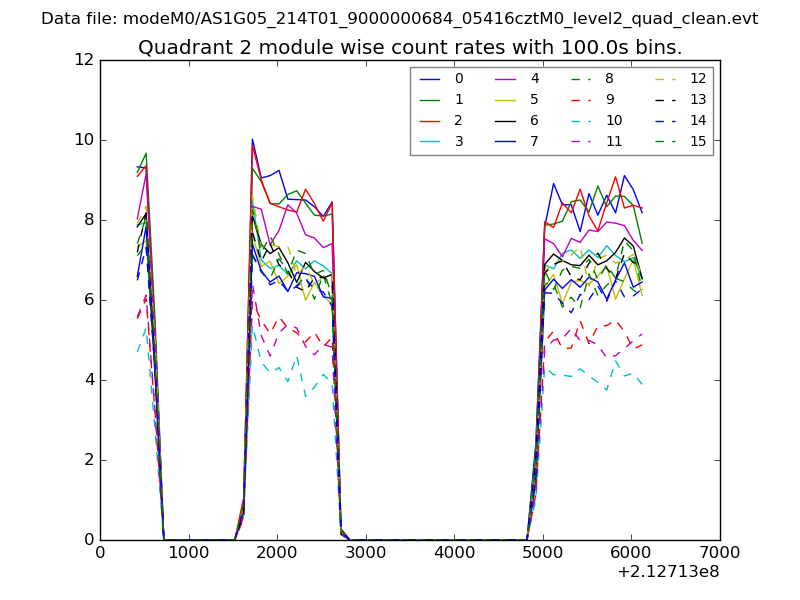
| Module-wise count rates for Quadrant B Data is divided into 100 sec bins |
 |
 |
| Module-wise count rates for Quadrant C Data is divided into 100 sec bins |
 |
 |
| Module-wise count rates for Quadrant D Data is divided into 100 sec bins |
 |
 |
| Parameter | Plot |
|---|---|
| CZT HV Monitor | 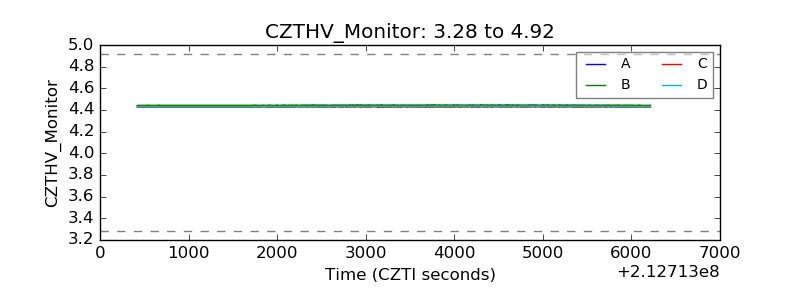 |
| D_VDD | 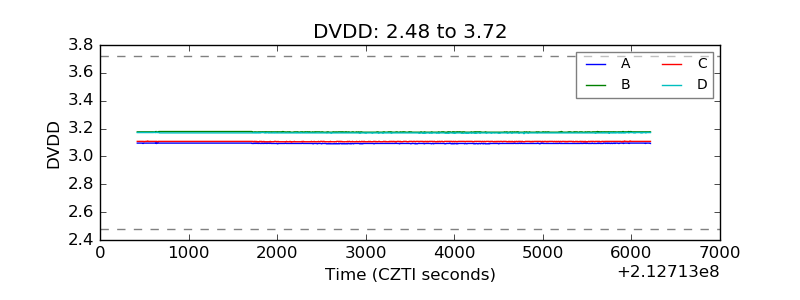 |
| Temperature 1 | 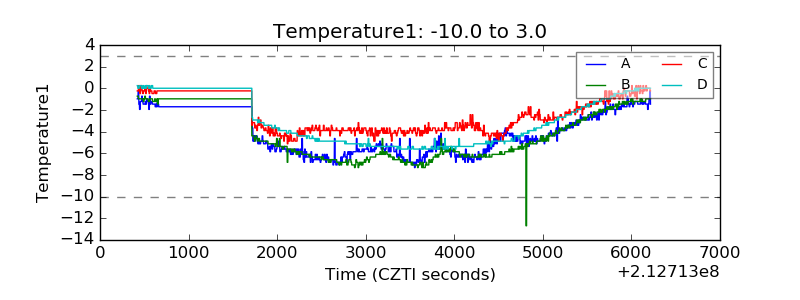 |
| Veto HV Monitor |  |
| Veto LLD | 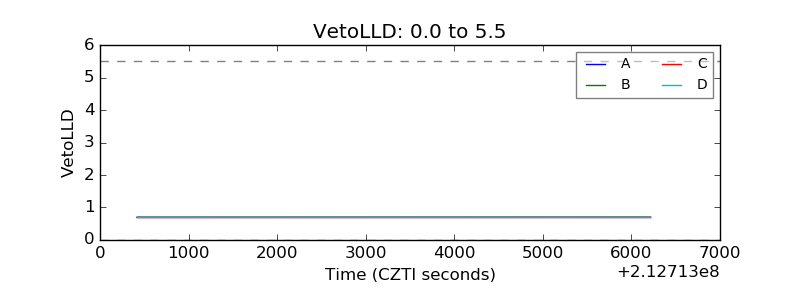 |
| Alpha Counter | 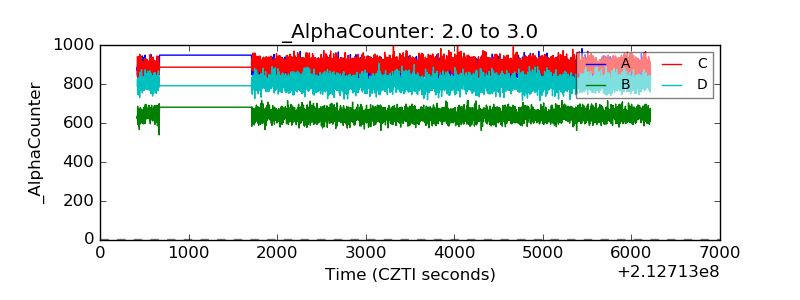 |
| _CPM_Rate | 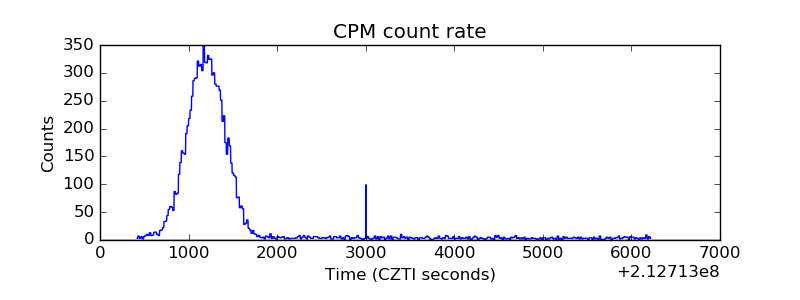 |
| CZT Counter | 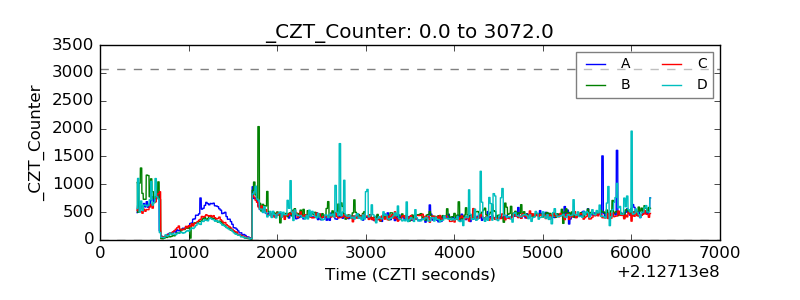 |
| +2.5 Volts monitor |  |
| +5 Volts monitor |  |
| _ROLL_ROT | 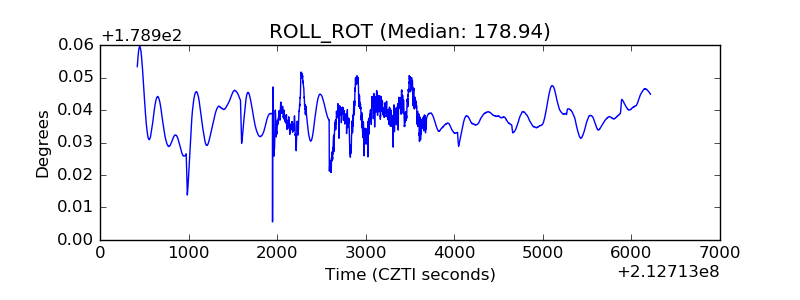 |
| _Roll_DEC | 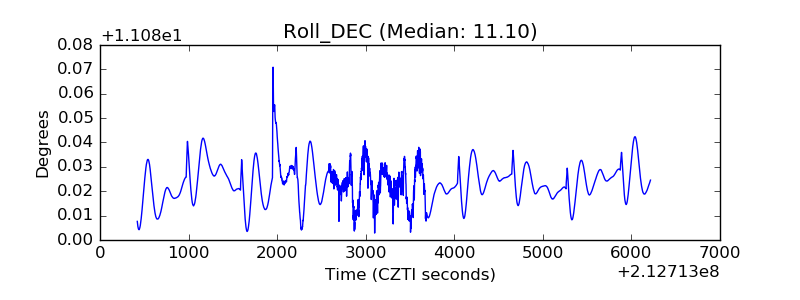 |
| _Roll_RA | 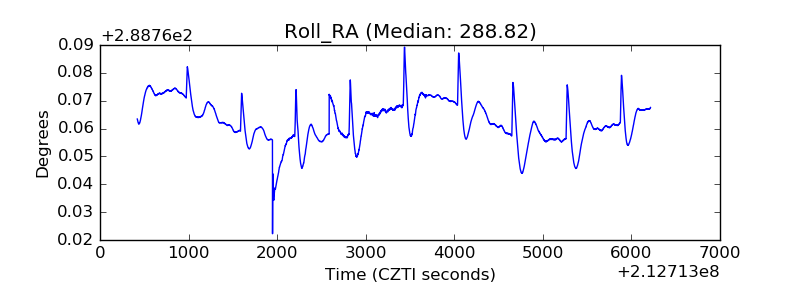 |
| Veto Counter | 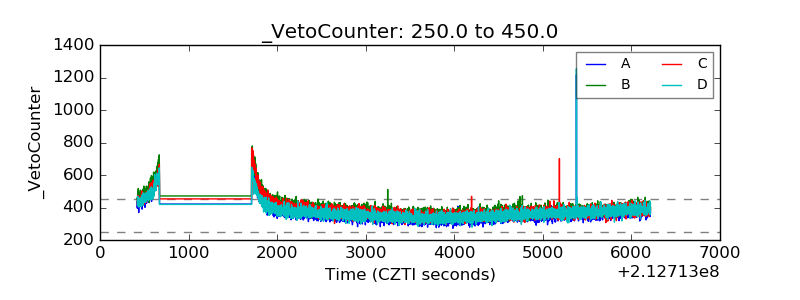 |