| Param | Original file | Final file |
|---|---|---|
| Filename | modeM0/AS1G05_243T01_9000000682_05381cztM0_level2.evt | modeM0/AS1G05_243T01_9000000682_05381cztM0_level2_quad_clean.evt |
| Size (bytes) | 543,271,680 | 49,029,120 |
| Size | 518.1 MB | 46.8 MB |
| Events in quadrant A | 2,511,952 | 297,320 |
| Events in quadrant B | 2,430,518 | 300,653 |
| Events in quadrant C | 2,280,256 | 300,444 |
| Events in quadrant D | 8,911,164 | 254,136 |
| Mode SS | |||
|---|---|---|---|
| Quadrant | BADHDUFLAG | Total packets | Discarded packets |
| A | 0 | 98 | 0 |
| B | 0 | 98 | 0 |
| C | 0 | 98 | 0 |
| D | 0 | 98 | 0 |
| Mode M9 | |||
|---|---|---|---|
| Quadrant | BADHDUFLAG | Total packets | Discarded packets |
| A | 0 | 10 | 0 |
| B | 0 | 10 | 0 |
| C | 0 | 10 | 0 |
| D | 0 | 10 | 0 |
| Mode M0 | |||
|---|---|---|---|
| Quadrant | BADHDUFLAG | Total packets | Discarded packets |
| A | 0 | 10782 | 1 |
| B | 0 | 10415 | 3 |
| C | 0 | 10135 | 1 |
| D | 0 | 29644 | 6 |
| Quadrant | Total seconds | Saturated seconds | Saturation percentage |
|---|---|---|---|
| A | 4713 | 213 | 4.519414% |
| B | 4712 | 89 | 1.888795% |
| C | 4713 | 54 | 1.145767% |
| D | 4712 | 1338 | 28.395586% |
Noise dominated data is calculated using 1-second bins in cleaned event files. If a bin has >2000 counts, and if more than 50% of those come from <1% of pixels, then it is considered to be noise-dominated and hence unusable.
| Quadrant | # 1 sec bins | Bins with >0 counts | Bins with >2000 counts | High rate bins dominated by noise | Noise dominated (total time) | Noise dominated (detector-on time) | Marked lightcurve |
|---|---|---|---|---|---|---|---|
| A | 5788 | 4713 | 51 | 51 | 0.88% | 1.08% | 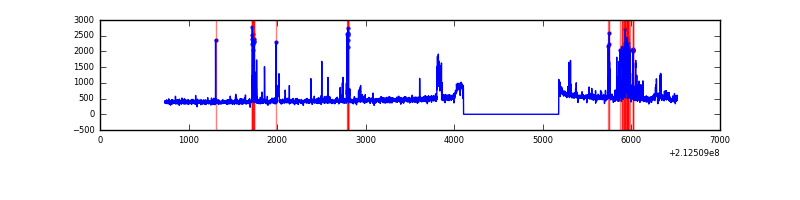 |
| B | 5787 | 4712 | 11 | 11 | 0.19% | 0.23% | 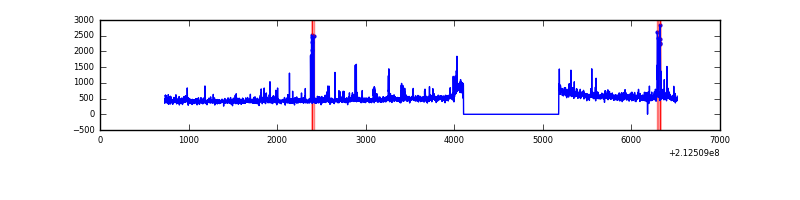 |
| C | 5788 | 4713 | 0 | 0 | 0.00% | 0.00% | 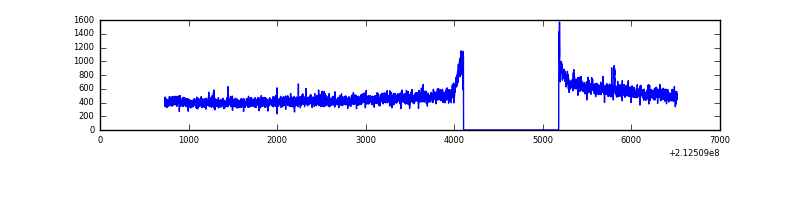 |
| D | 5788 | 4713 | 1642 | 1642 | 28.37% | 34.84% | 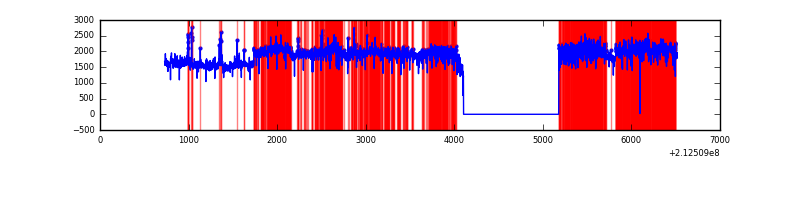 |
Top three noisy pixels from each quadrant. If the there are fewer than three noisy pixels in the level2.evt file, extra rows are filled as -1
| Pixel properties | Quadrant properties | ||||||
|---|---|---|---|---|---|---|---|
| Quadrant | DetID | PixID | Counts | Sigma | Mean | Median | Sigma |
| A | 14 | 111 | 258852 | 2255.1 | 551 | 538 | 114.5 |
| A | 15 | 174 | 61039 | 528.18 | 551 | 538 | 114.5 |
| A | 0 | 50 | 57711 | 499.12 | 551 | 538 | 114.5 |
| B | 4 | 80 | 111762 | 1019.54 | 562 | 548 | 109.1 |
| B | 15 | 204 | 67163 | 610.69 | 562 | 548 | 109.1 |
| B | 10 | 245 | 25032 | 224.45 | 562 | 548 | 109.1 |
| C | 1 | 16 | 154416 | 1214.23 | 543 | 547 | 126.7 |
| C | 13 | 61 | 4321 | 29.78 | 543 | 547 | 126.7 |
| C | 12 | 4 | 3949 | 26.85 | 543 | 547 | 126.7 |
| D | 7 | 237 | 6782838 | 53780.65 | 511 | 495 | 126.1 |
| D | 4 | 95 | 55824 | 438.73 | 511 | 495 | 126.1 |
| D | 11 | 18 | 32723 | 255.55 | 511 | 495 | 126.1 |
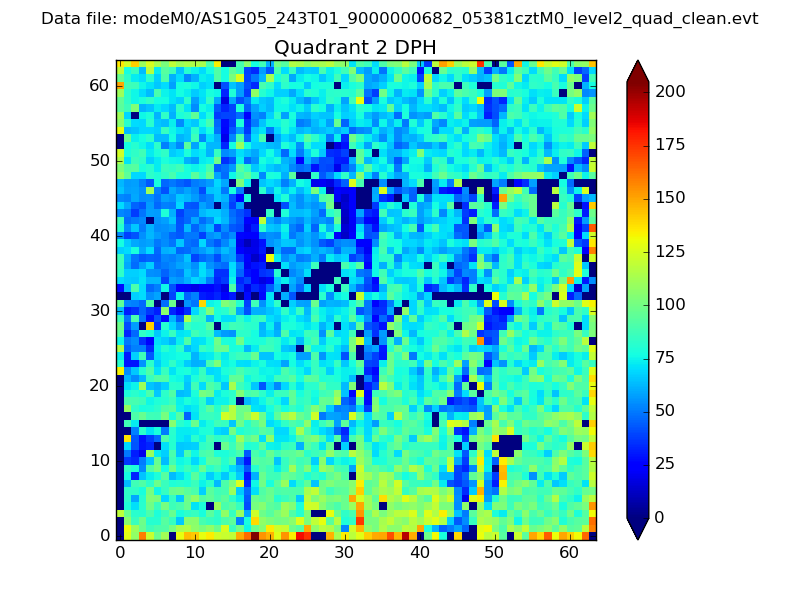
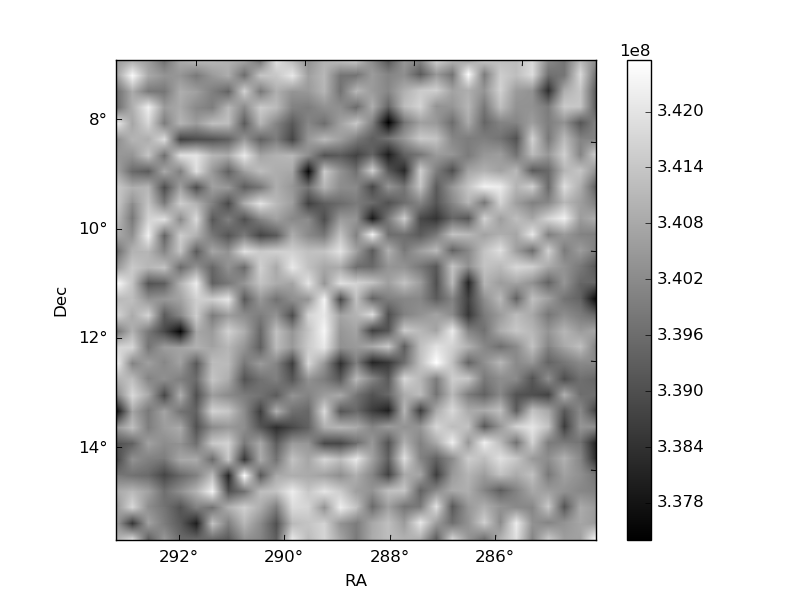
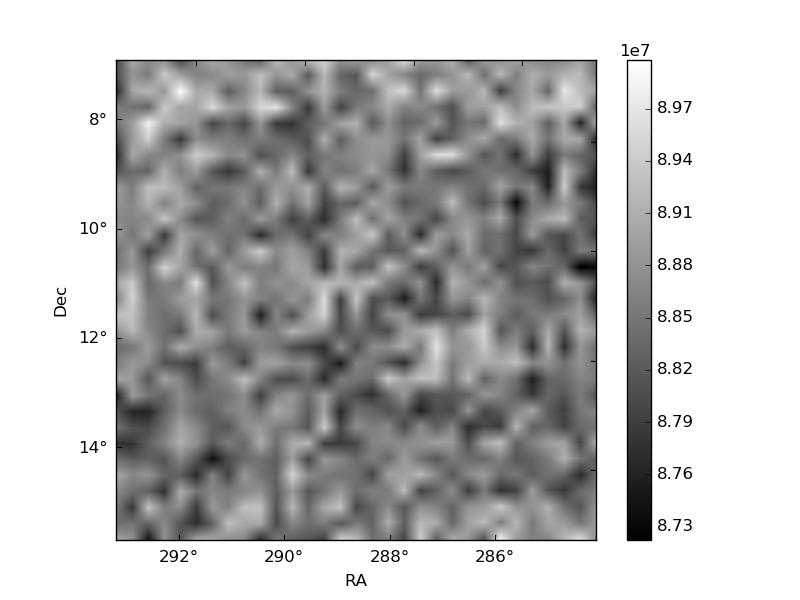
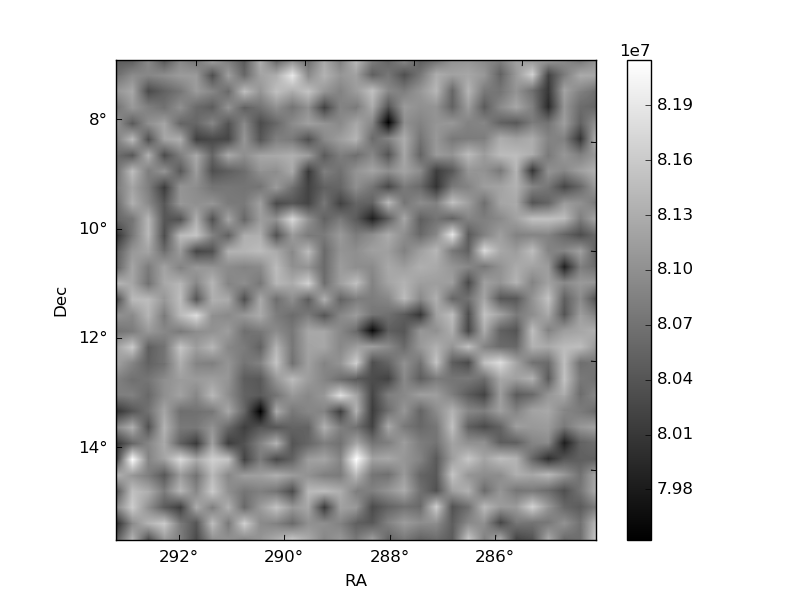
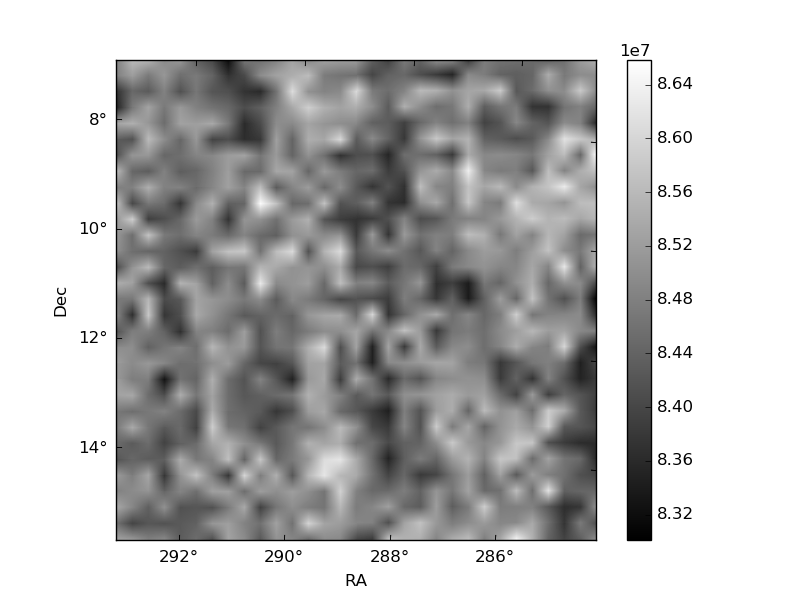
Histogram calculated using DETX and DETY for each event in the final _common_clean file
| Quadrant A | 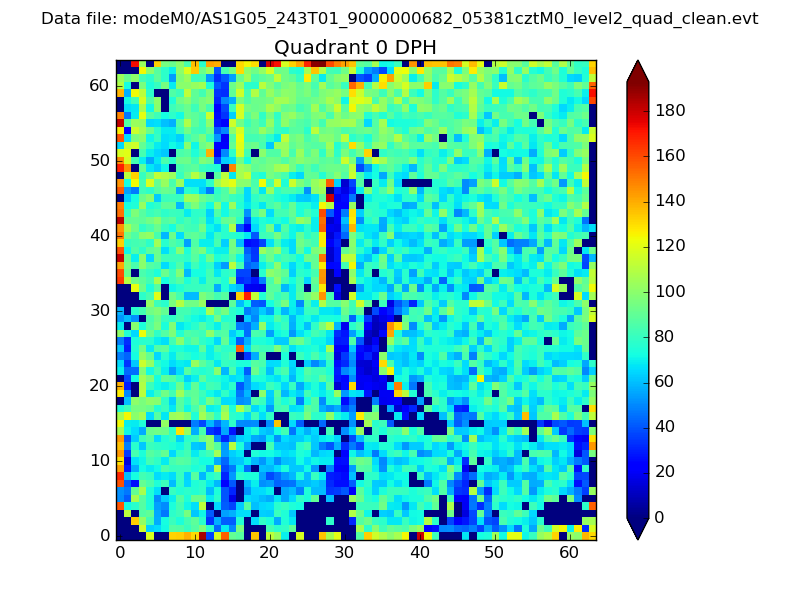 |
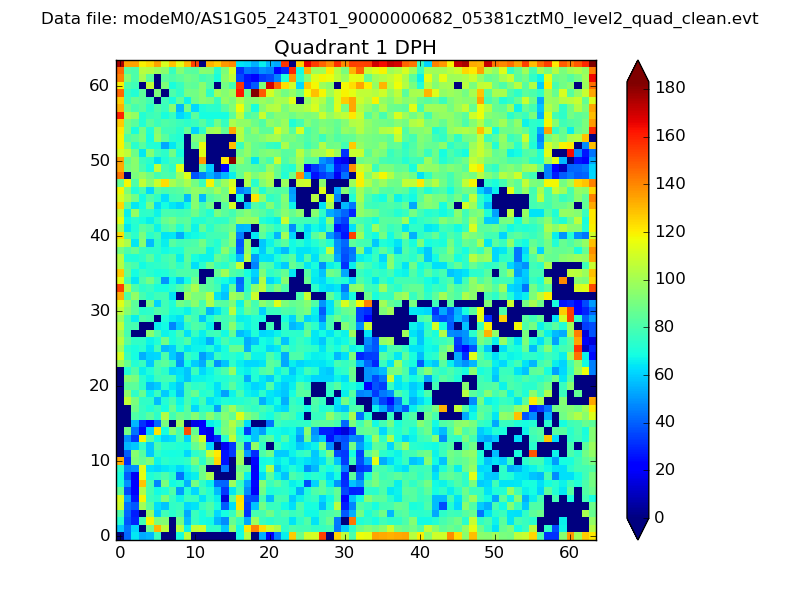 |
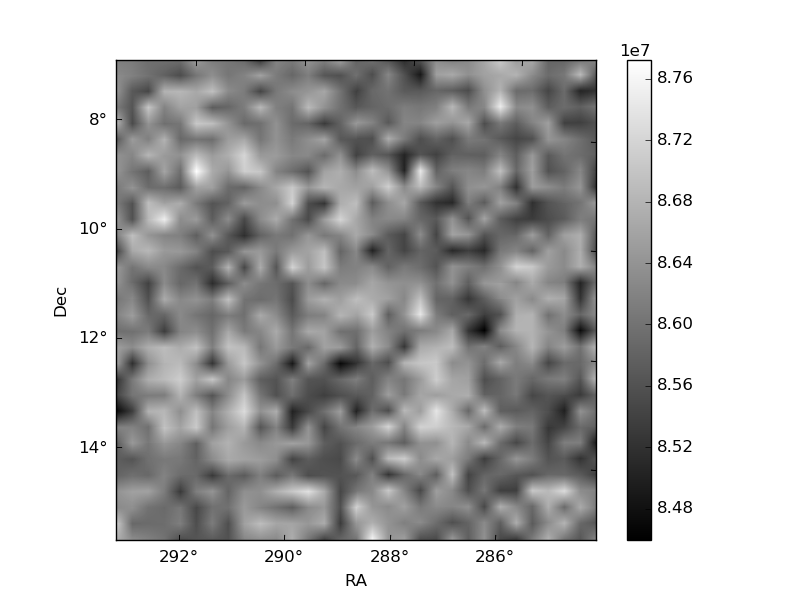
Quadrant B |
|---|---|---|---|
| Quadrant D | 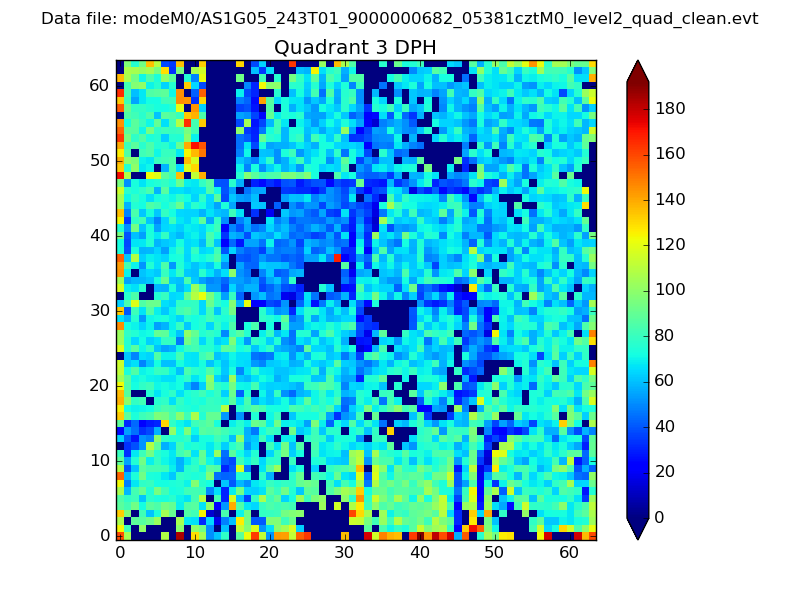 |
 |
Quadrant C |
| Plot type | Count rate plots | Images |
|---|---|---|
| Comparison with Poisson distribution Blue bars denote a histogram of data divided into 1 sec bins. Red curve is a Poisson curve with rate = median count rate of data. |
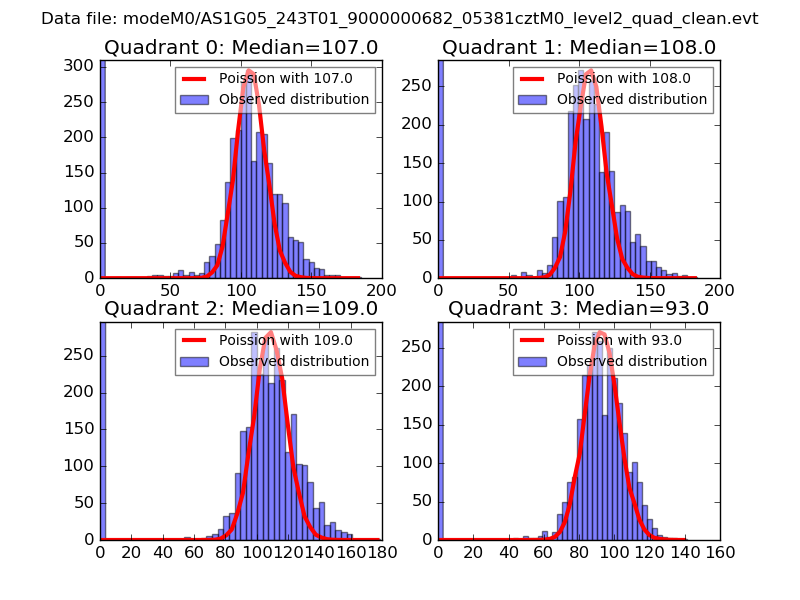 |
 |
| Quadrant-wise count rates Data is divided into 100 sec bins |
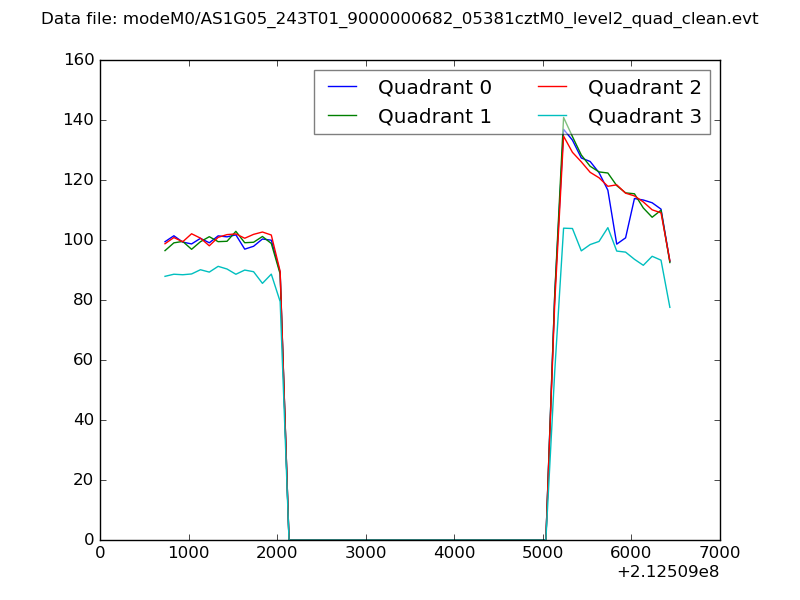 |
|
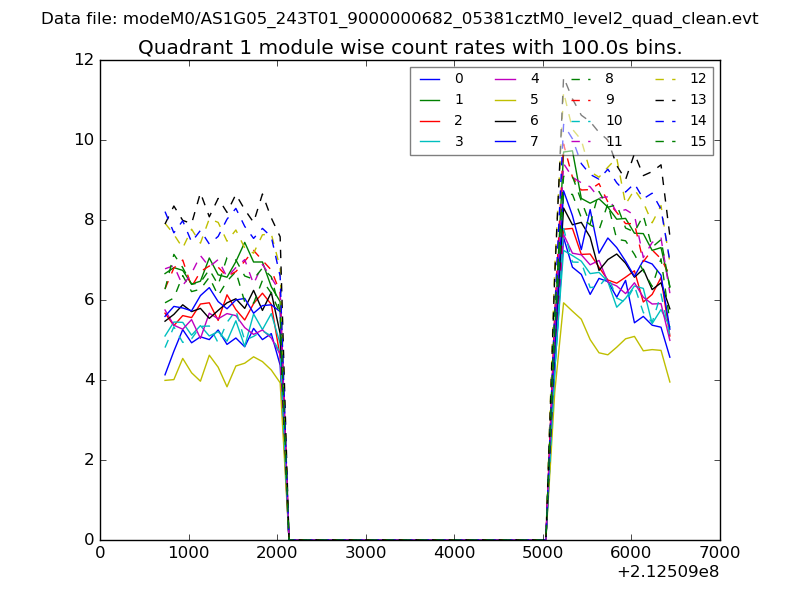
| Module-wise count rates for Quadrant A Data is divided into 100 sec bins |
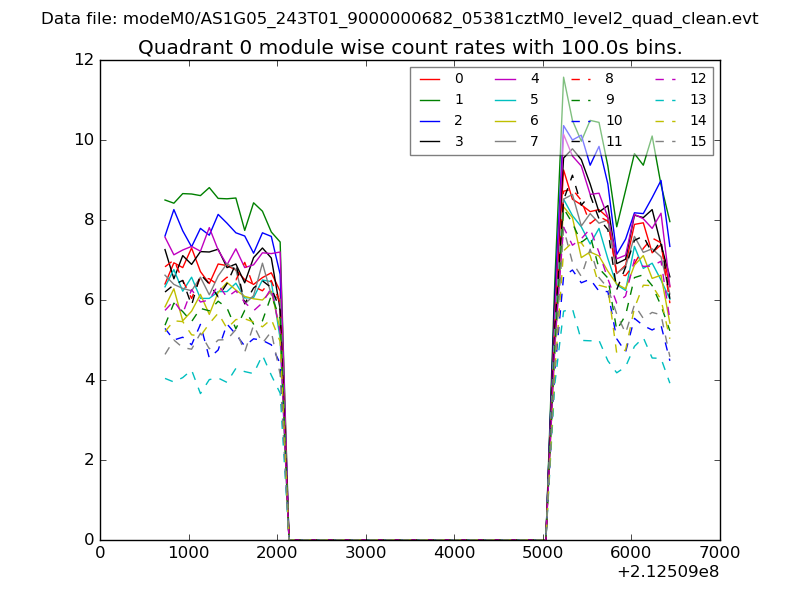 |
 |
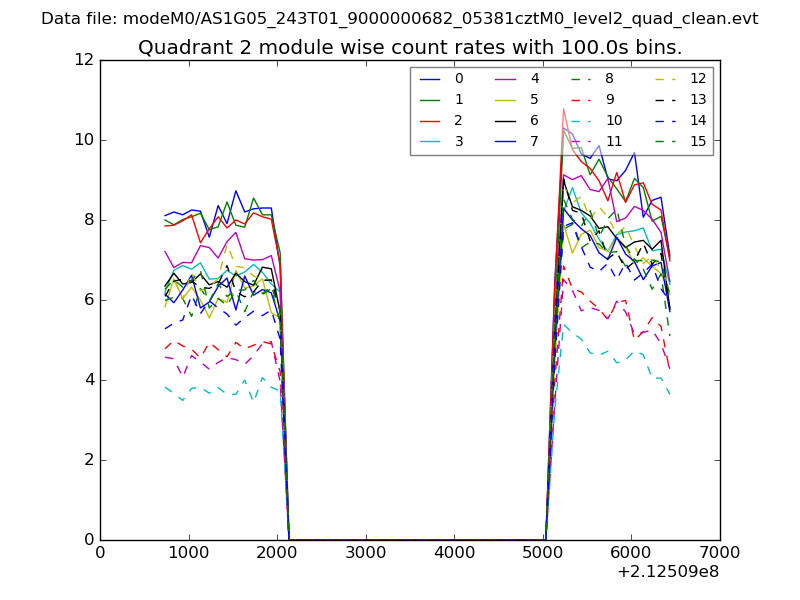
| Module-wise count rates for Quadrant B Data is divided into 100 sec bins |
 |
 |
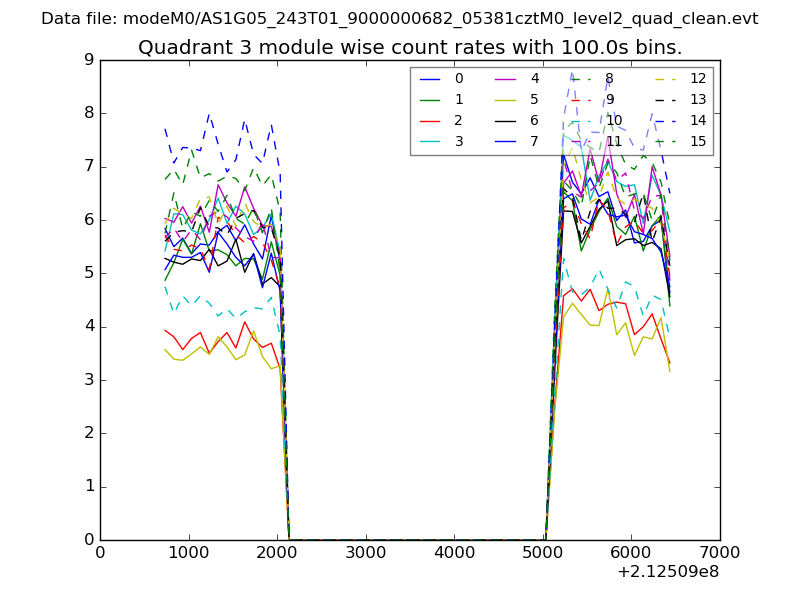
| Module-wise count rates for Quadrant C Data is divided into 100 sec bins |
 |
 |
| Module-wise count rates for Quadrant D Data is divided into 100 sec bins |
 |
 |
| Parameter | Plot |
|---|---|
| CZT HV Monitor | 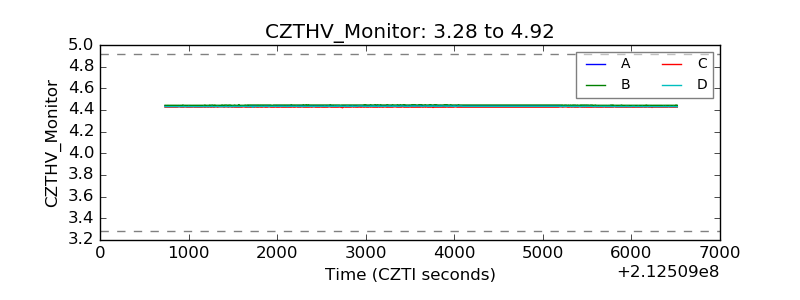 |
| D_VDD | 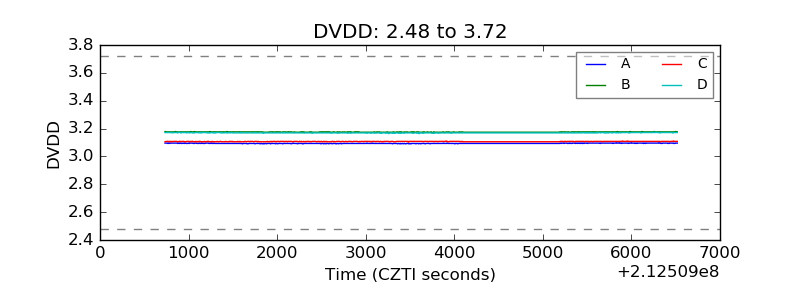 |
| Temperature 1 | 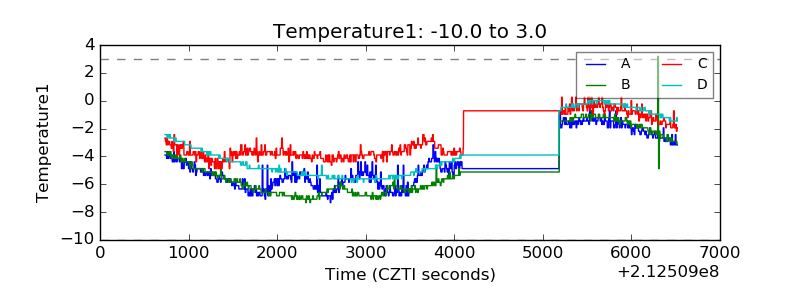 |
| Veto HV Monitor | 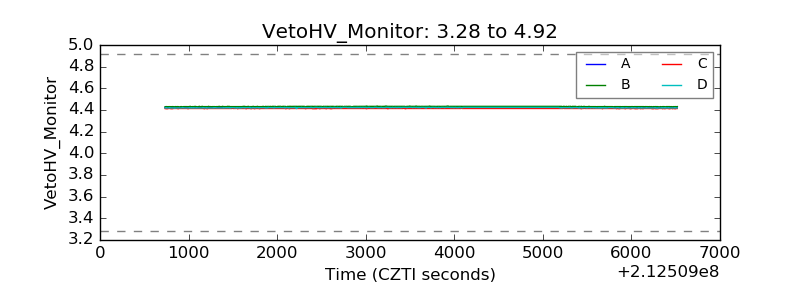 |
| Veto LLD | 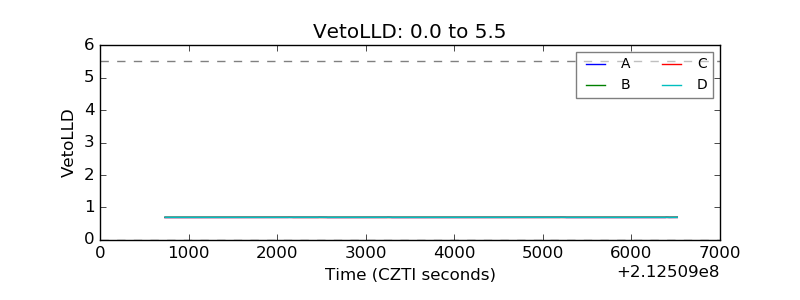 |
| Alpha Counter | 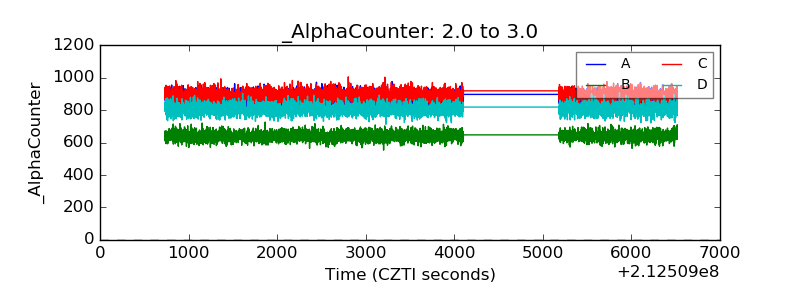 |
| _CPM_Rate | 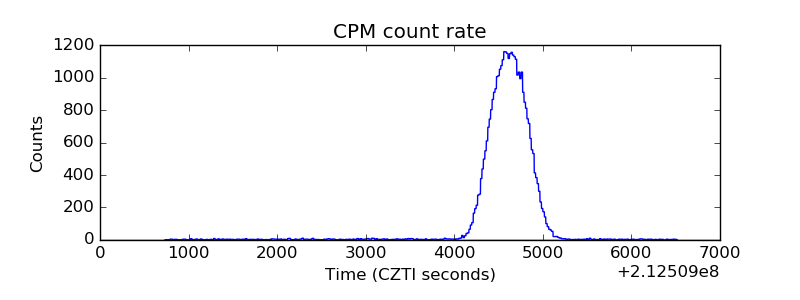 |
| CZT Counter | 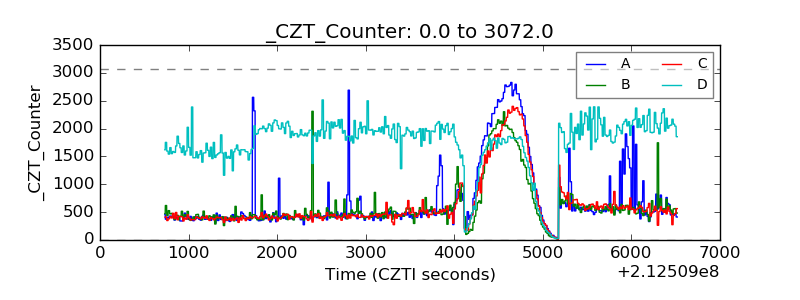 |
| +2.5 Volts monitor | 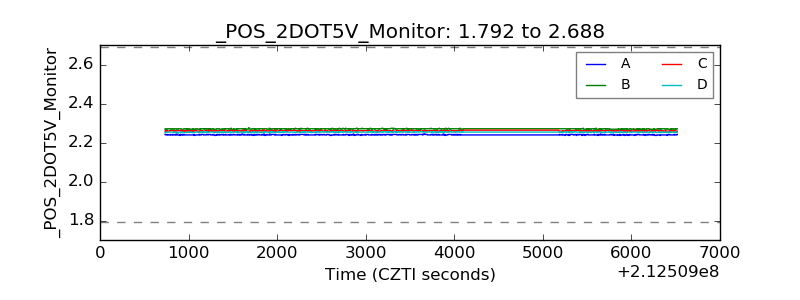 |
| +5 Volts monitor |  |
| _ROLL_ROT | 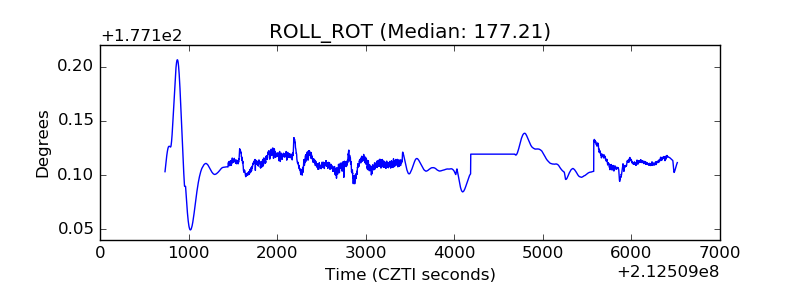 |
| _Roll_DEC | 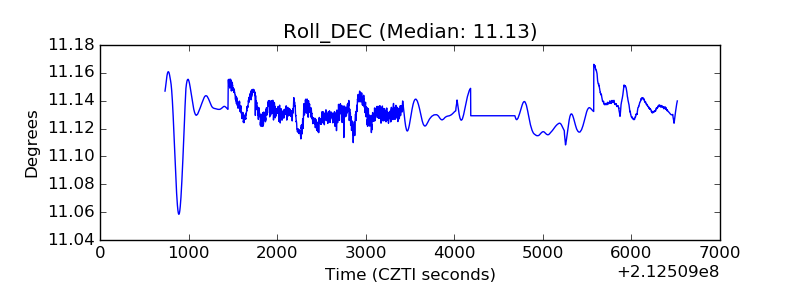 |
| _Roll_RA | 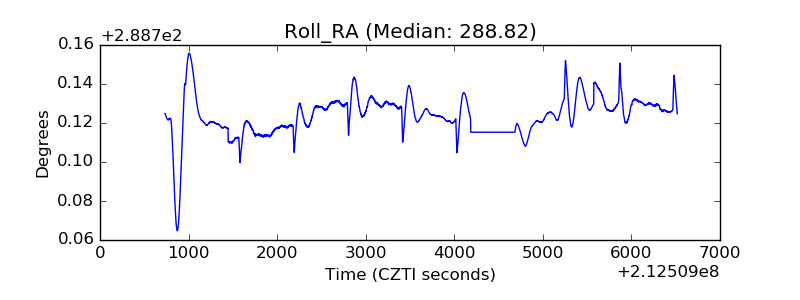 |
| Veto Counter | 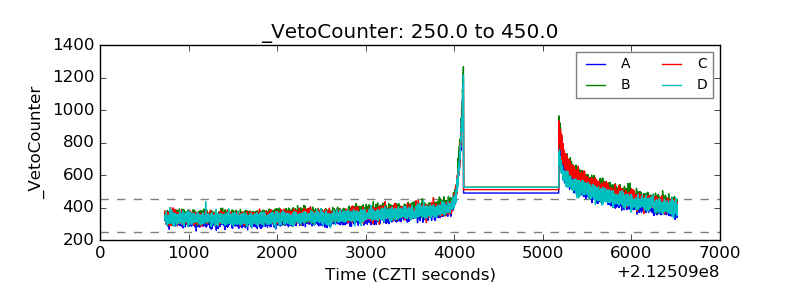 |