| Param | Original file | Final file |
|---|---|---|
| Filename | modeM0/AS1G05_132T01_9000000686_05425cztM0_level2.evt | modeM0/AS1G05_132T01_9000000686_05425cztM0_level2_quad_clean.evt |
| Size (bytes) | 427,835,520 | 71,112,960 |
| Size | 408.0 MB | 67.8 MB |
| Events in quadrant A | 2,982,108 | 438,995 |
| Events in quadrant B | 3,149,050 | 439,494 |
| Events in quadrant C | 2,634,106 | 439,561 |
| Events in quadrant D | 3,782,577 | 414,785 |
| Mode M9 | |||
|---|---|---|---|
| Quadrant | BADHDUFLAG | Total packets | Discarded packets |
| A | 0 | 12 | 0 |
| B | 0 | 12 | 0 |
| C | 0 | 12 | 0 |
| D | 0 | 12 | 0 |
| Mode SS | |||
|---|---|---|---|
| Quadrant | BADHDUFLAG | Total packets | Discarded packets |
| A | 0 | 122 | 0 |
| B | 0 | 122 | 0 |
| C | 0 | 122 | 0 |
| D | 0 | 122 | 0 |
| Mode M0 | |||
|---|---|---|---|
| Quadrant | BADHDUFLAG | Total packets | Discarded packets |
| A | 0 | 13043 | 2 |
| B | 0 | 13405 | 1 |
| C | 0 | 12253 | 1 |
| D | 0 | 15232 | 1 |
| Quadrant | Total seconds | Saturated seconds | Saturation percentage |
|---|---|---|---|
| A | 6021 | 105 | 1.743896% |
| B | 6021 | 79 | 1.312074% |
| C | 6021 | 27 | 0.448430% |
| D | 6021 | 142 | 2.358412% |
Noise dominated data is calculated using 1-second bins in cleaned event files. If a bin has >2000 counts, and if more than 50% of those come from <1% of pixels, then it is considered to be noise-dominated and hence unusable.
| Quadrant | # 1 sec bins | Bins with >0 counts | Bins with >2000 counts | High rate bins dominated by noise | Noise dominated (total time) | Noise dominated (detector-on time) | Marked lightcurve |
|---|---|---|---|---|---|---|---|
| A | 7176 | 6022 | 34 | 34 | 0.47% | 0.56% | 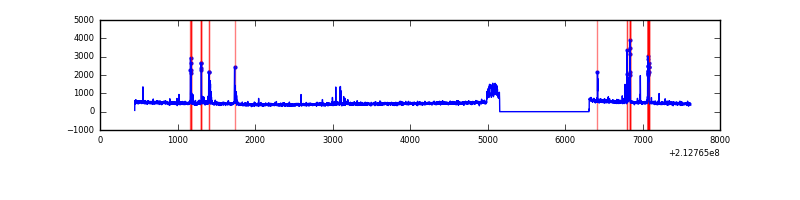 |
| B | 7176 | 6022 | 34 | 34 | 0.47% | 0.56% |  |
| C | 7176 | 6022 | 0 | 0 | 0.00% | 0.00% | 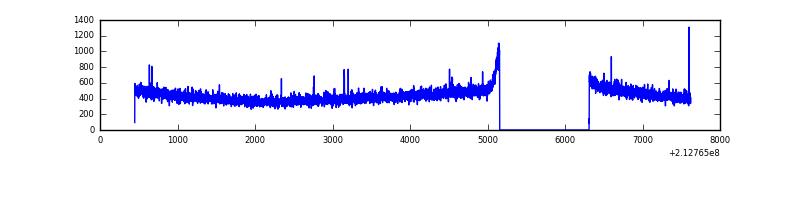 |
| D | 7176 | 6022 | 119 | 119 | 1.66% | 1.98% |  |
Top three noisy pixels from each quadrant. If the there are fewer than three noisy pixels in the level2.evt file, extra rows are filled as -1
| Pixel properties | Quadrant properties | ||||||
|---|---|---|---|---|---|---|---|
| Quadrant | DetID | PixID | Counts | Sigma | Mean | Median | Sigma |
| A | 0 | 50 | 257781 | 1795.08 | 700 | 686 | 143.2 |
| A | 15 | 174 | 19823 | 133.62 | 700 | 686 | 143.2 |
| A | 0 | 226 | 7236 | 45.73 | 700 | 686 | 143.2 |
| B | 0 | 219 | 142812 | 1048.21 | 706 | 691 | 135.6 |
| B | 15 | 204 | 126849 | 930.47 | 706 | 691 | 135.6 |
| B | 4 | 81 | 93836 | 686.99 | 706 | 691 | 135.6 |
| C | 4 | 238 | 5977 | 34.08 | 671 | 674 | 155.6 |
| C | 13 | 61 | 5611 | 31.73 | 671 | 674 | 155.6 |
| C | 14 | 67 | 4302 | 23.32 | 671 | 674 | 155.6 |
| D | 7 | 203 | 663727 | 4002.83 | 669 | 647 | 165.7 |
| D | 8 | 195 | 173381 | 1042.75 | 669 | 647 | 165.7 |
| D | 2 | 152 | 172561 | 1037.8 | 669 | 647 | 165.7 |
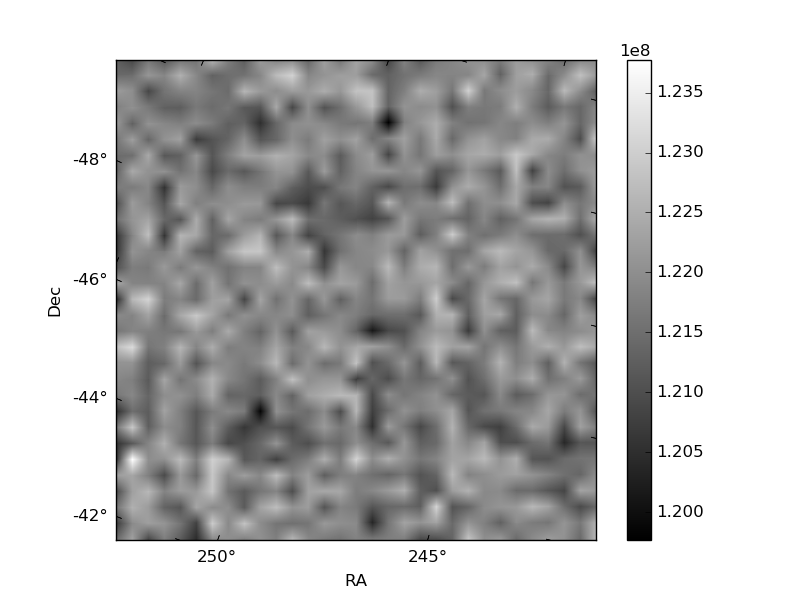
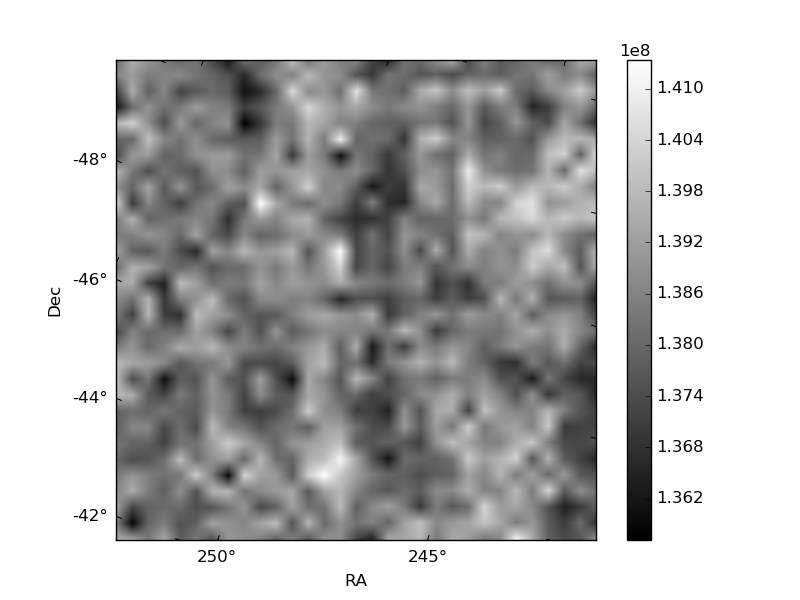
Histogram calculated using DETX and DETY for each event in the final _common_clean file
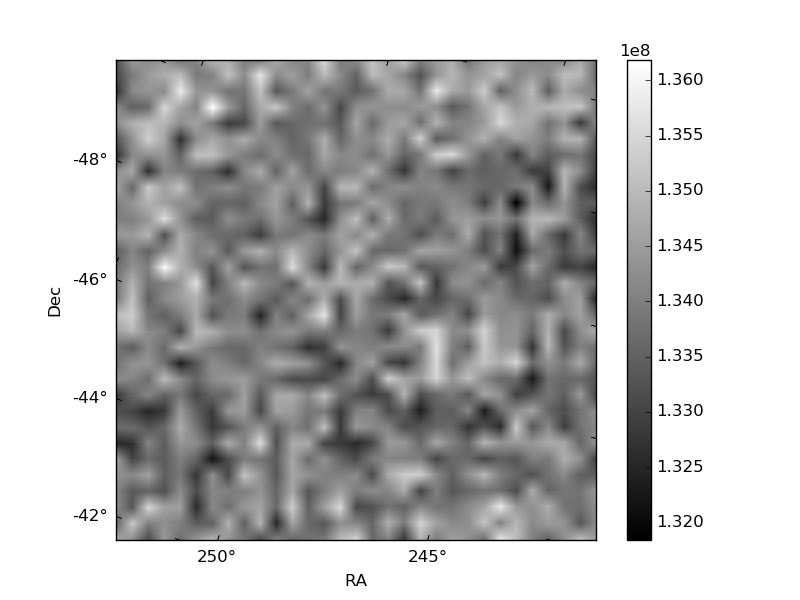
| Quadrant A | 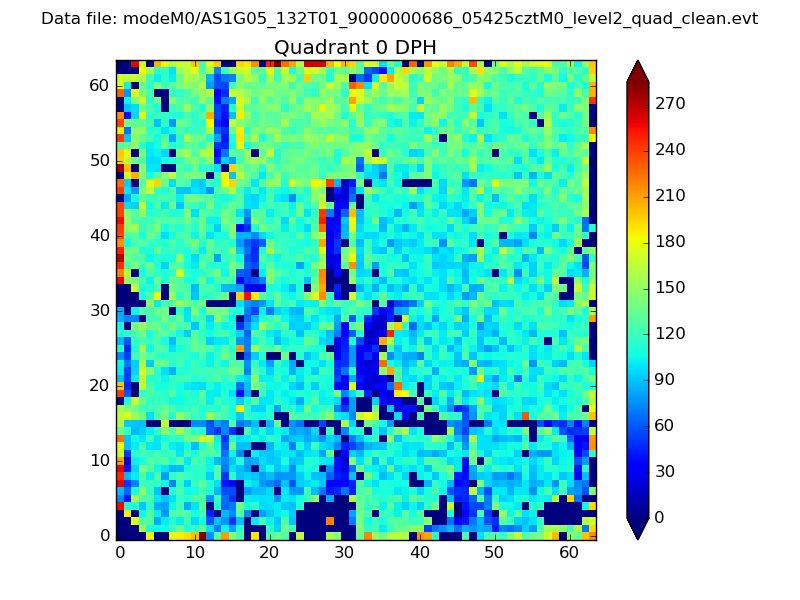 |
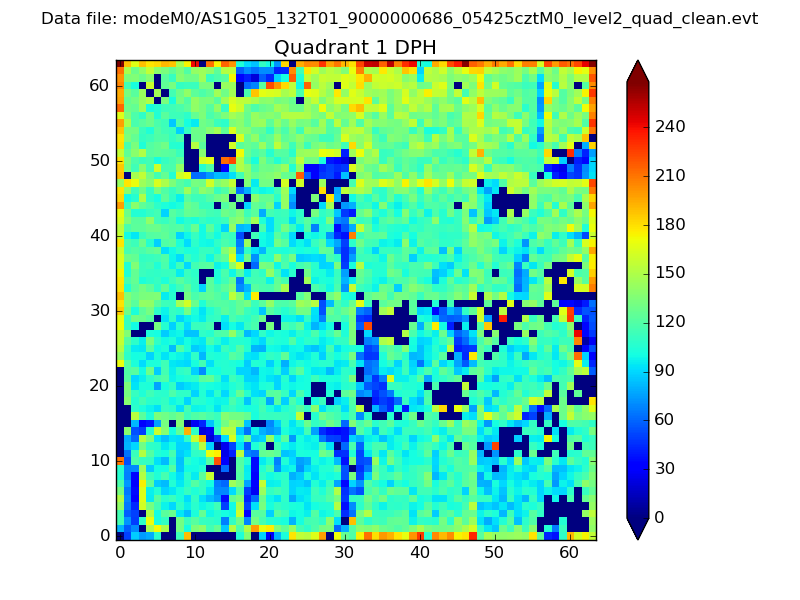 |
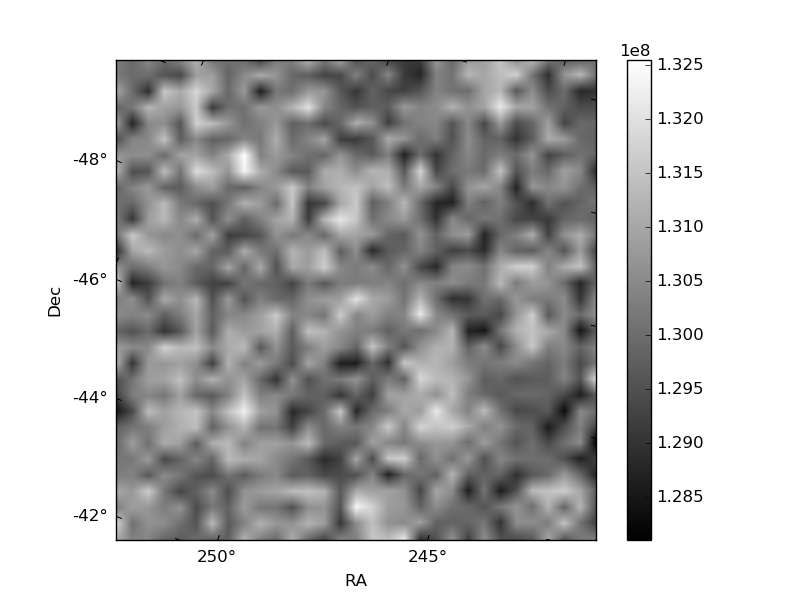
Quadrant B |
|---|---|---|---|
| Quadrant D |  |
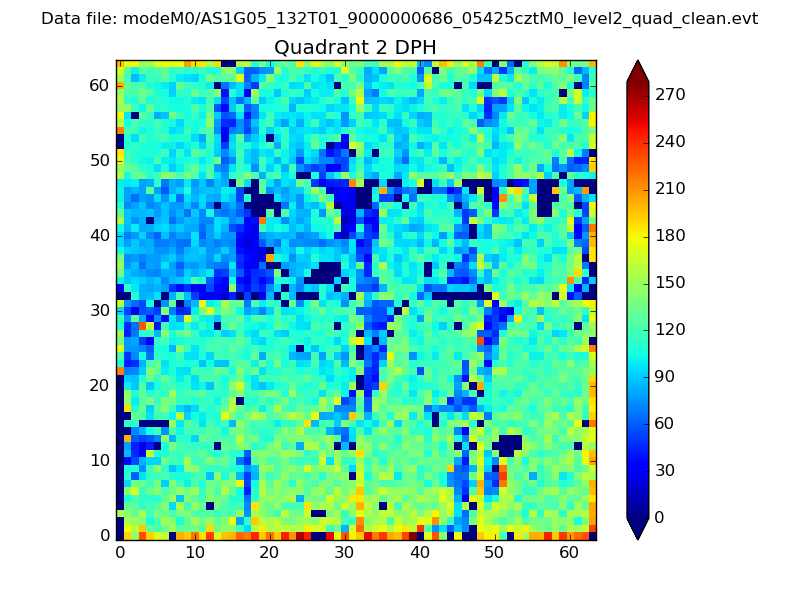 |
Quadrant C |
| Plot type | Count rate plots | Images |
|---|---|---|
| Comparison with Poisson distribution Blue bars denote a histogram of data divided into 1 sec bins. Red curve is a Poisson curve with rate = median count rate of data. |
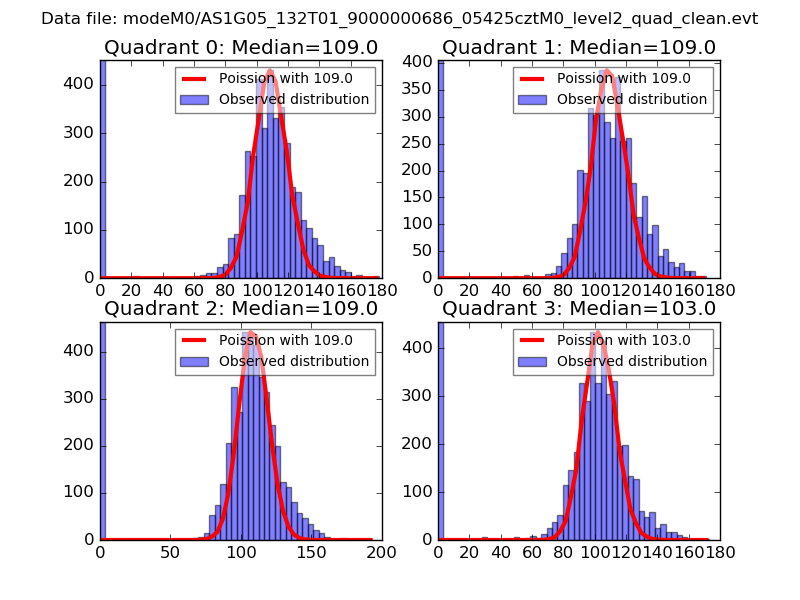 |
 |
| Quadrant-wise count rates Data is divided into 100 sec bins |
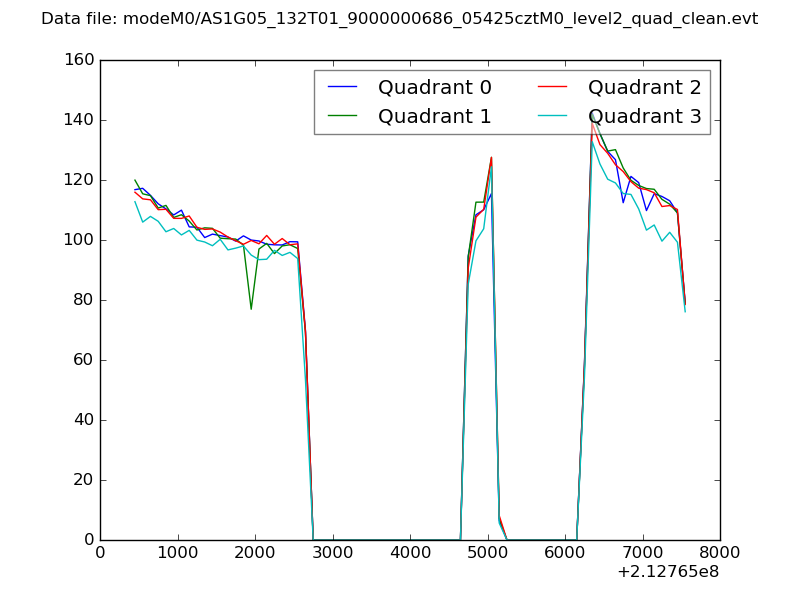 |
|
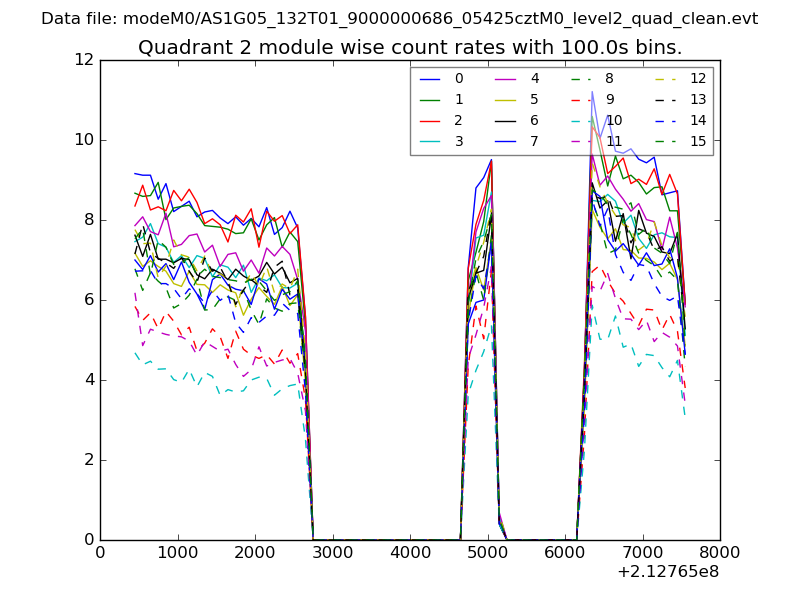
| Module-wise count rates for Quadrant A Data is divided into 100 sec bins |
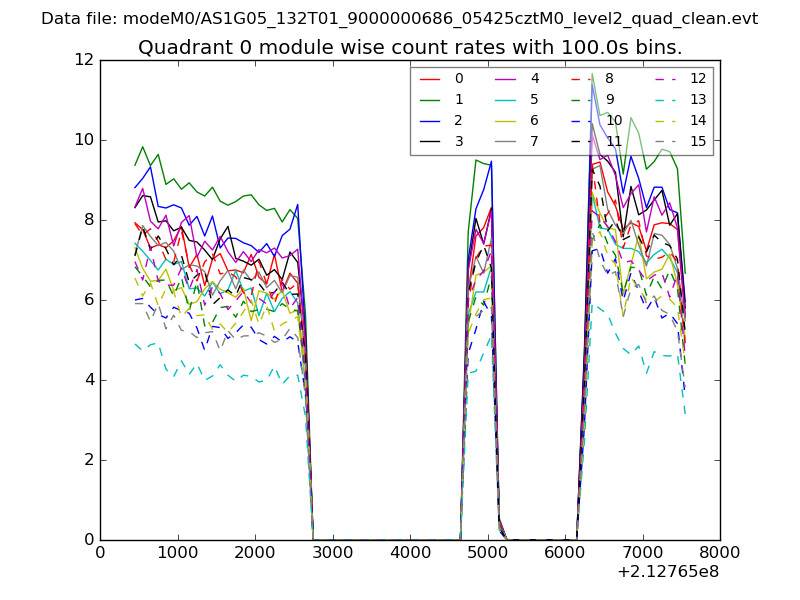 |
 |
| Module-wise count rates for Quadrant B Data is divided into 100 sec bins |
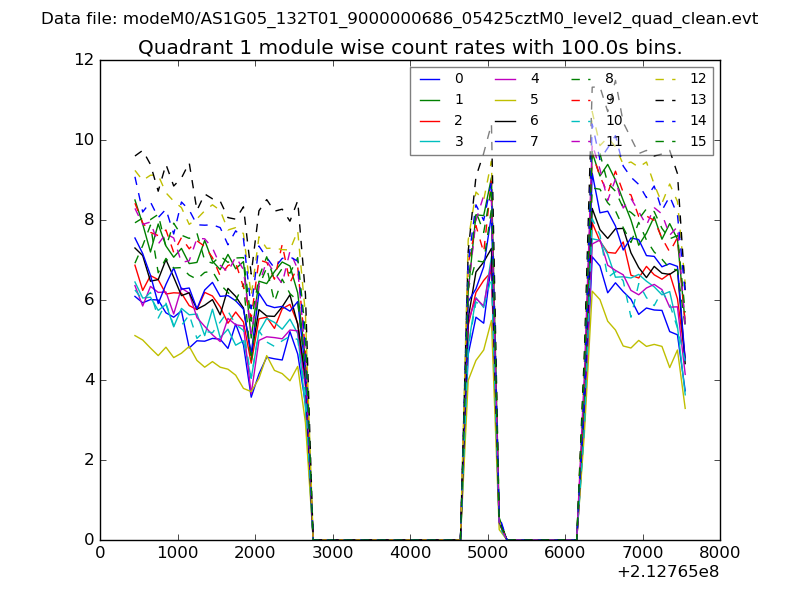 |
 |
| Module-wise count rates for Quadrant C Data is divided into 100 sec bins |
 |
 |
| Module-wise count rates for Quadrant D Data is divided into 100 sec bins |
 |
 |
| Parameter | Plot |
|---|---|
| CZT HV Monitor | 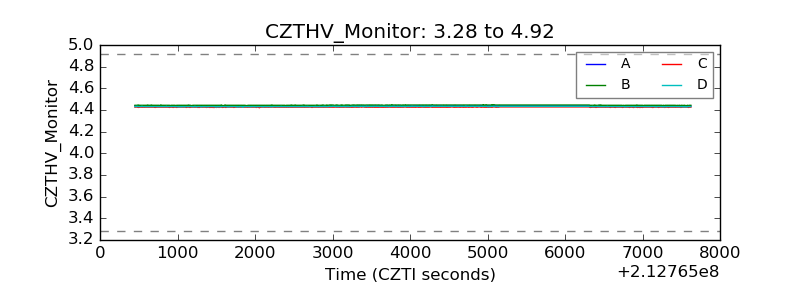 |
| D_VDD | 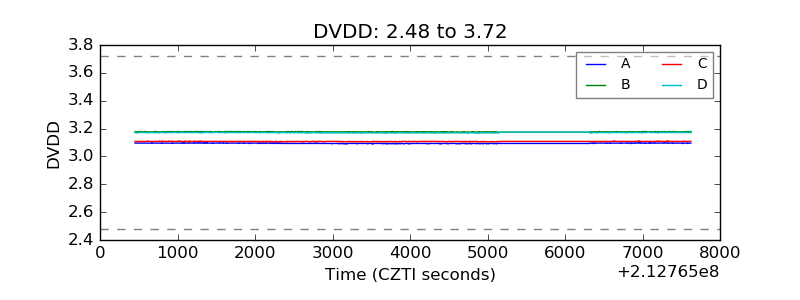 |
| Temperature 1 | 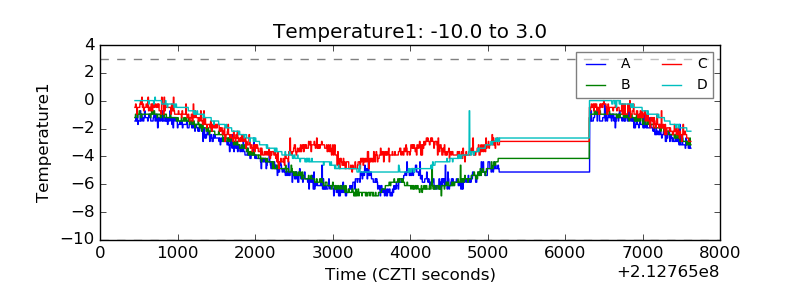 |
| Veto HV Monitor |  |
| Veto LLD | 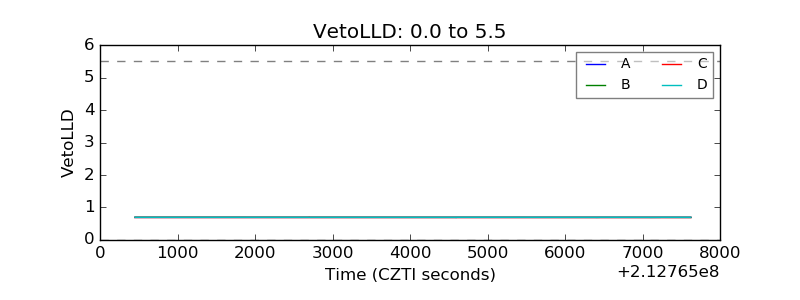 |
| Alpha Counter | 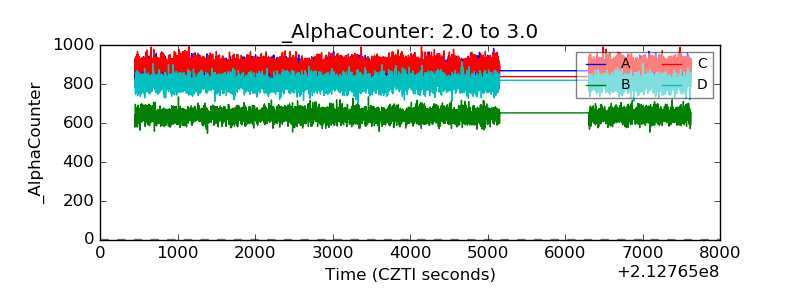 |
| _CPM_Rate | 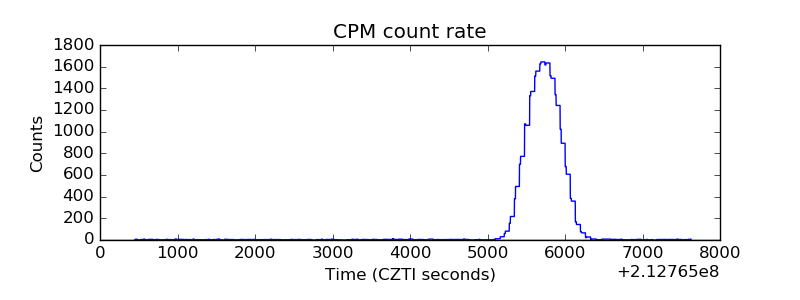 |
| CZT Counter | 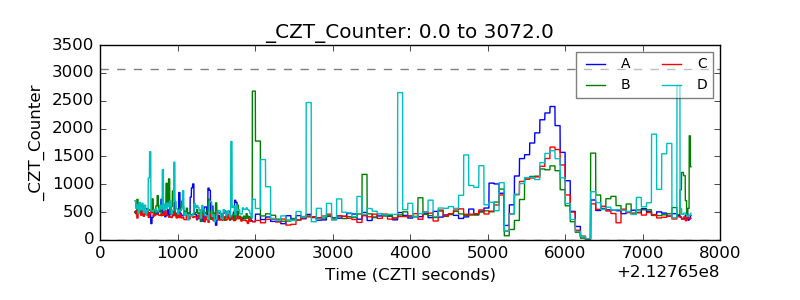 |
| +2.5 Volts monitor | 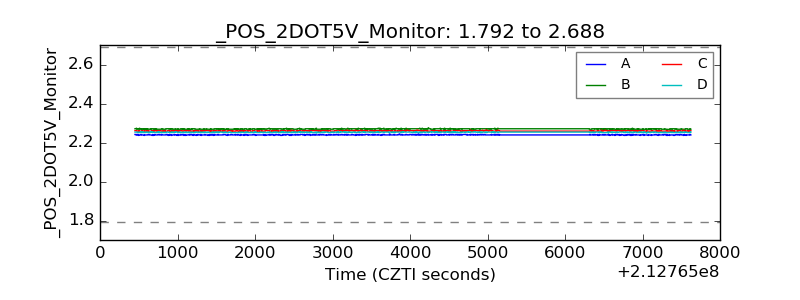 |
| +5 Volts monitor |  |
| _ROLL_ROT | 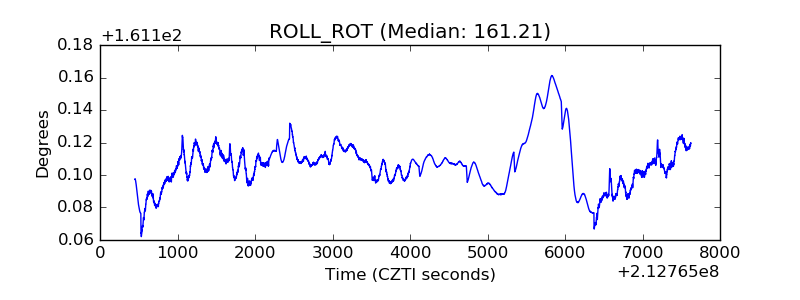 |
| _Roll_DEC | 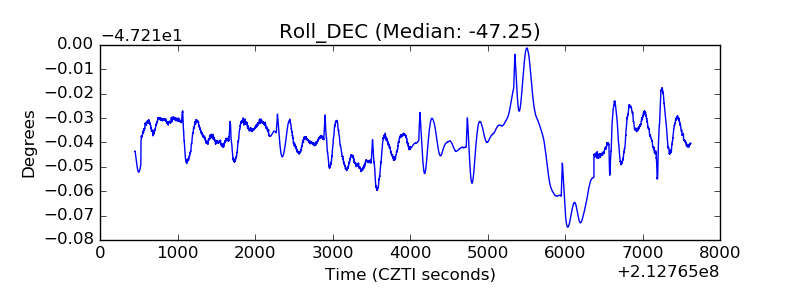 |
| _Roll_RA | 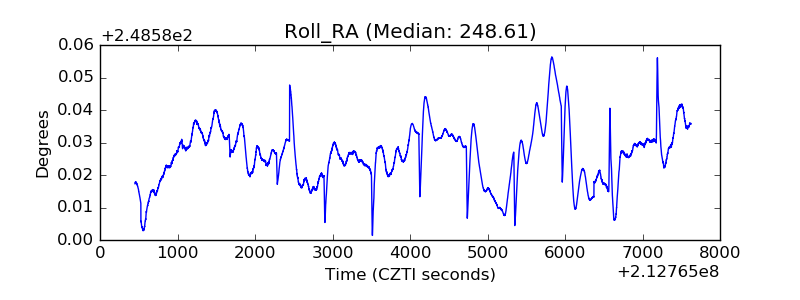 |
| Veto Counter | 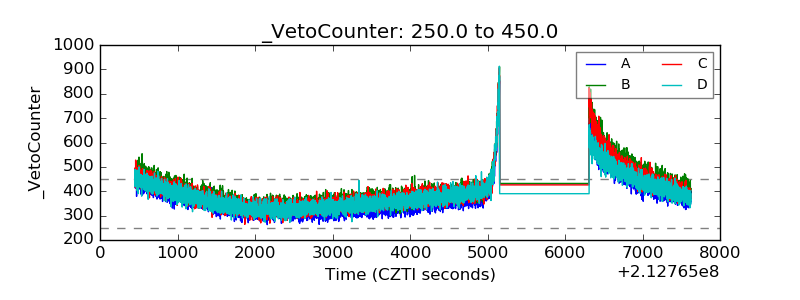 |