| Param | Original file | Final file |
|---|---|---|
| Filename | modeM0/AS1G05_132T01_9000000686_05427cztM0_level2.evt | modeM0/AS1G05_132T01_9000000686_05427cztM0_level2_quad_clean.evt |
| Size (bytes) | 481,645,440 | 76,815,360 |
| Size | 459.3 MB | 73.3 MB |
| Events in quadrant A | 3,024,966 | 485,577 |
| Events in quadrant B | 3,235,998 | 495,346 |
| Events in quadrant C | 2,785,473 | 486,633 |
| Events in quadrant D | 5,124,903 | 431,085 |
| Mode M9 | |||
|---|---|---|---|
| Quadrant | BADHDUFLAG | Total packets | Discarded packets |
| A | 0 | 14 | 0 |
| B | 0 | 14 | 0 |
| C | 0 | 14 | 0 |
| D | 0 | 14 | 0 |
| Mode SS | |||
|---|---|---|---|
| Quadrant | BADHDUFLAG | Total packets | Discarded packets |
| A | 0 | 124 | 0 |
| B | 0 | 124 | 0 |
| C | 0 | 124 | 0 |
| D | 0 | 124 | 0 |
| Mode M0 | |||
|---|---|---|---|
| Quadrant | BADHDUFLAG | Total packets | Discarded packets |
| A | 0 | 13087 | 3 |
| B | 0 | 13570 | 5 |
| C | 0 | 12532 | 4 |
| D | 0 | 19398 | 5 |
| Quadrant | Total seconds | Saturated seconds | Saturation percentage |
|---|---|---|---|
| A | 6120 | 83 | 1.356209% |
| B | 6119 | 50 | 0.817127% |
| C | 6119 | 20 | 0.326851% |
| D | 6120 | 458 | 7.483660% |
Noise dominated data is calculated using 1-second bins in cleaned event files. If a bin has >2000 counts, and if more than 50% of those come from <1% of pixels, then it is considered to be noise-dominated and hence unusable.
| Quadrant | # 1 sec bins | Bins with >0 counts | Bins with >2000 counts | High rate bins dominated by noise | Noise dominated (total time) | Noise dominated (detector-on time) | Marked lightcurve |
|---|---|---|---|---|---|---|---|
| A | 7440 | 6121 | 30 | 30 | 0.40% | 0.49% | 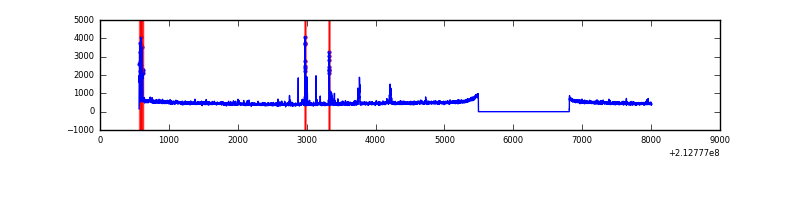 |
| B | 7440 | 6121 | 8 | 8 | 0.11% | 0.13% | 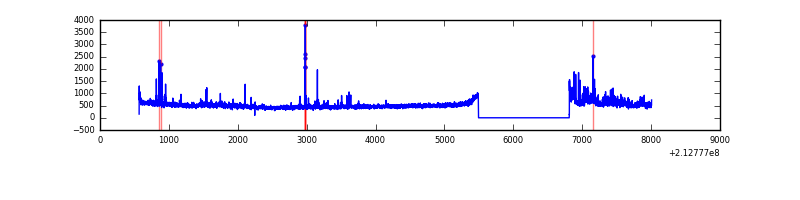 |
| C | 7440 | 6121 | 0 | 0 | 0.00% | 0.00% | 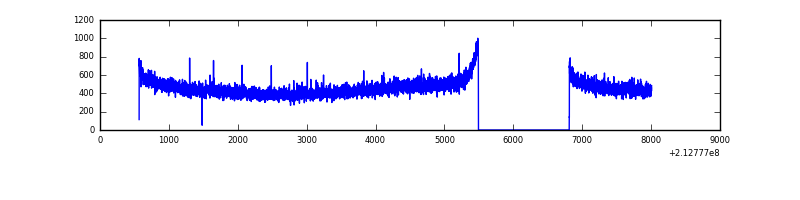 |
| D | 7441 | 6122 | 474 | 474 | 6.37% | 7.74% | 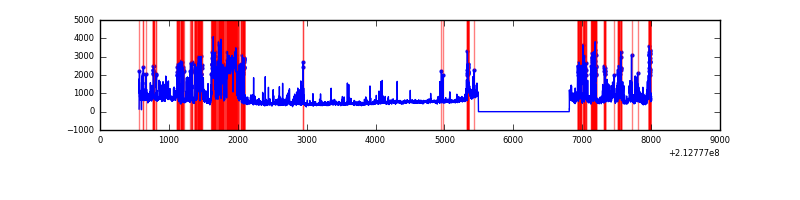 |
Top three noisy pixels from each quadrant. If the there are fewer than three noisy pixels in the level2.evt file, extra rows are filled as -1
| Pixel properties | Quadrant properties | ||||||
|---|---|---|---|---|---|---|---|
| Quadrant | DetID | PixID | Counts | Sigma | Mean | Median | Sigma |
| A | 0 | 50 | 171445 | 1123.47 | 738 | 722 | 152.0 |
| A | 15 | 174 | 7998 | 47.88 | 738 | 722 | 152.0 |
| A | 0 | 226 | 7497 | 44.58 | 738 | 722 | 152.0 |
| B | 15 | 204 | 140134 | 979.02 | 753 | 737 | 142.4 |
| B | 0 | 219 | 84628 | 589.18 | 753 | 737 | 142.4 |
| B | 4 | 48 | 37599 | 258.89 | 753 | 737 | 142.4 |
| C | 14 | 67 | 9251 | 52.06 | 710 | 713 | 164.0 |
| C | 13 | 61 | 5896 | 31.61 | 710 | 713 | 164.0 |
| C | 12 | 4 | 3553 | 17.32 | 710 | 713 | 164.0 |
| D | 2 | 33 | 986572 | 5825.87 | 687 | 666 | 169.2 |
| D | 12 | 233 | 714172 | 4216.22 | 687 | 666 | 169.2 |
| D | 8 | 195 | 224672 | 1323.69 | 687 | 666 | 169.2 |
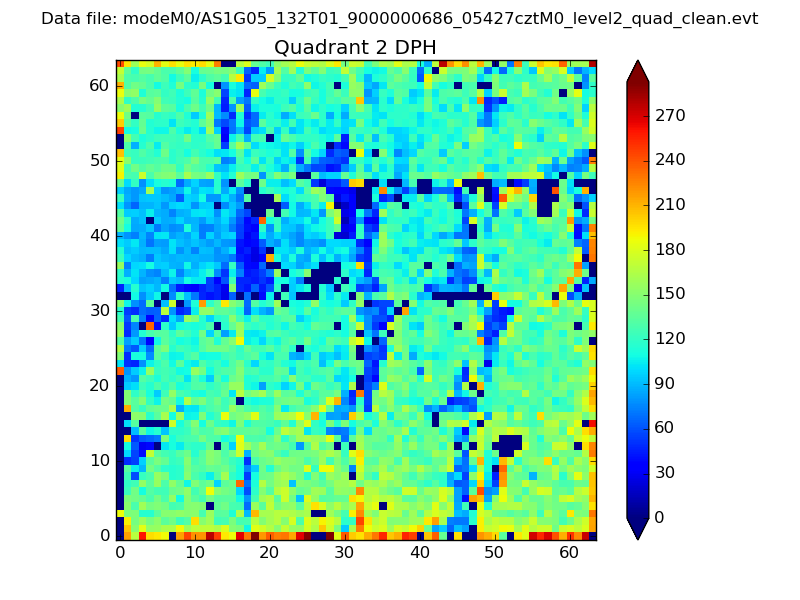
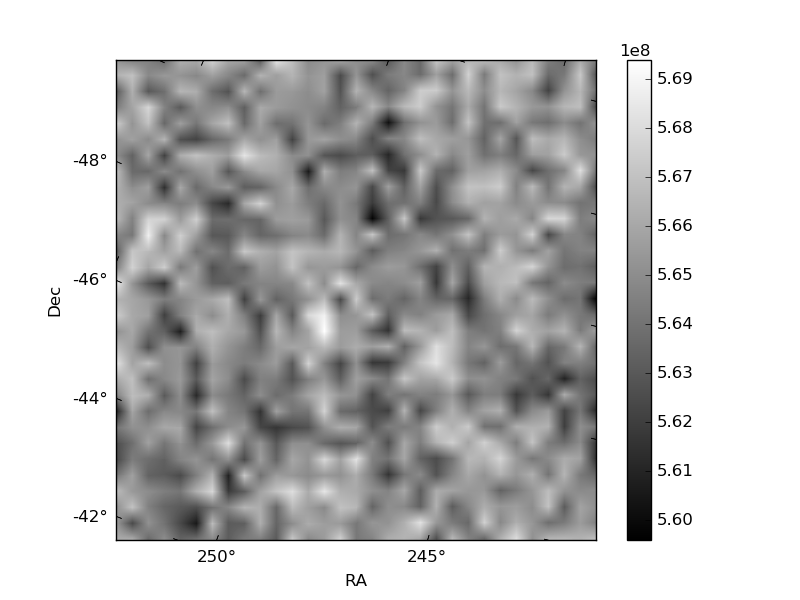
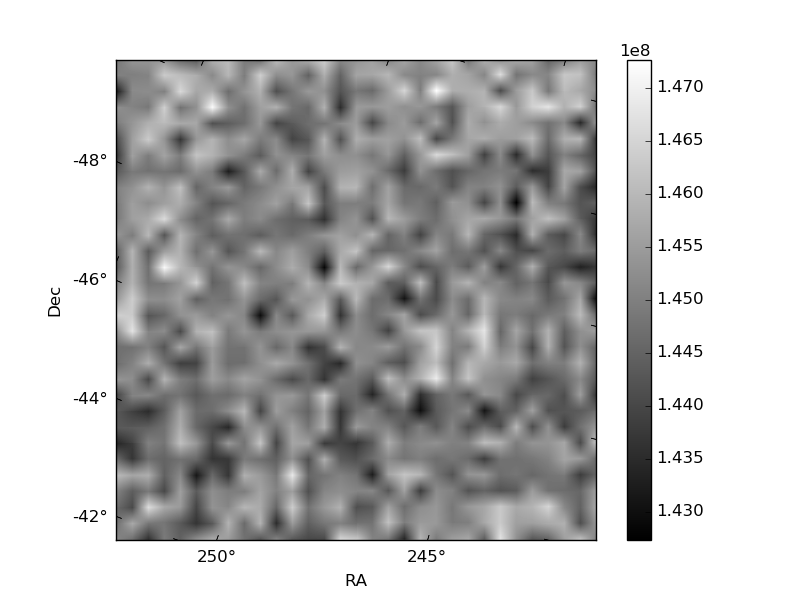
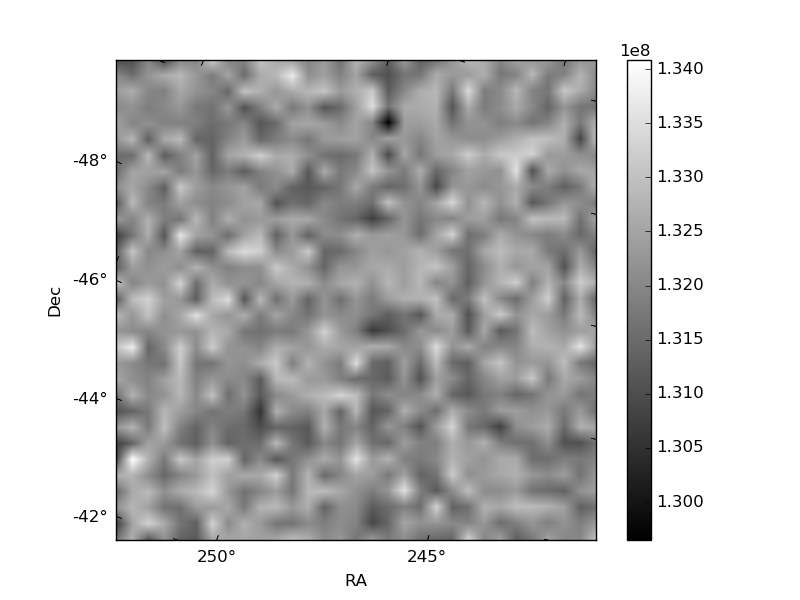
Histogram calculated using DETX and DETY for each event in the final _common_clean file
| Quadrant A | 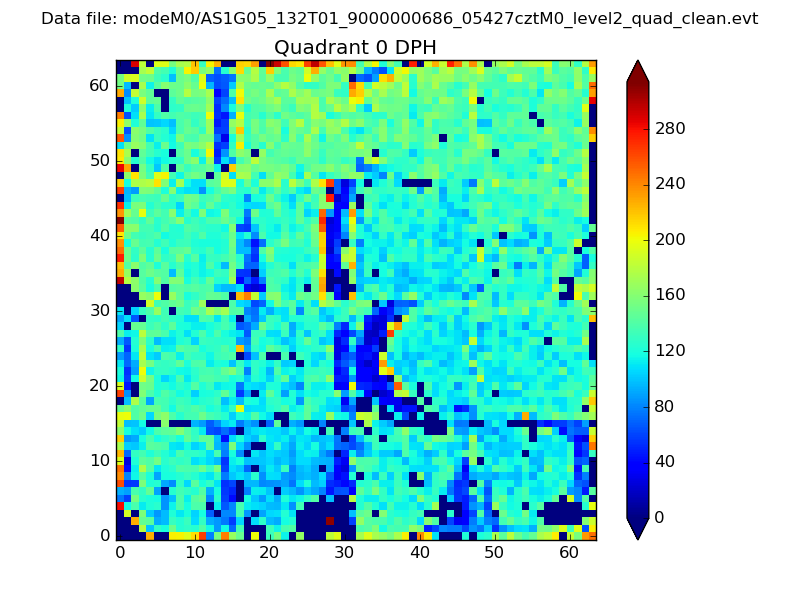 |
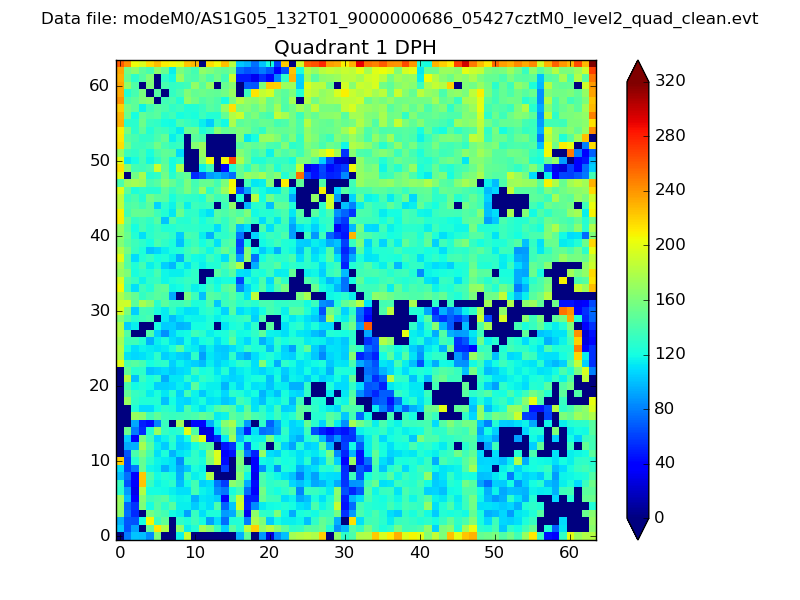 |
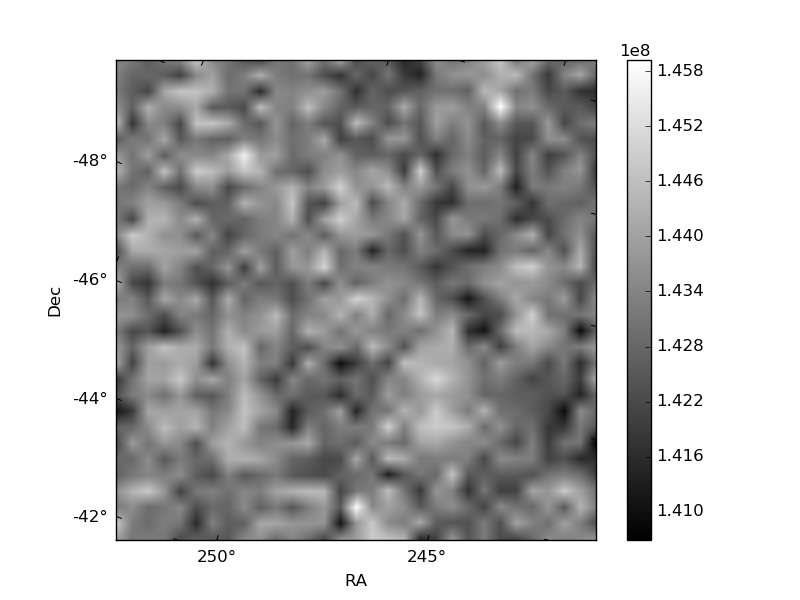
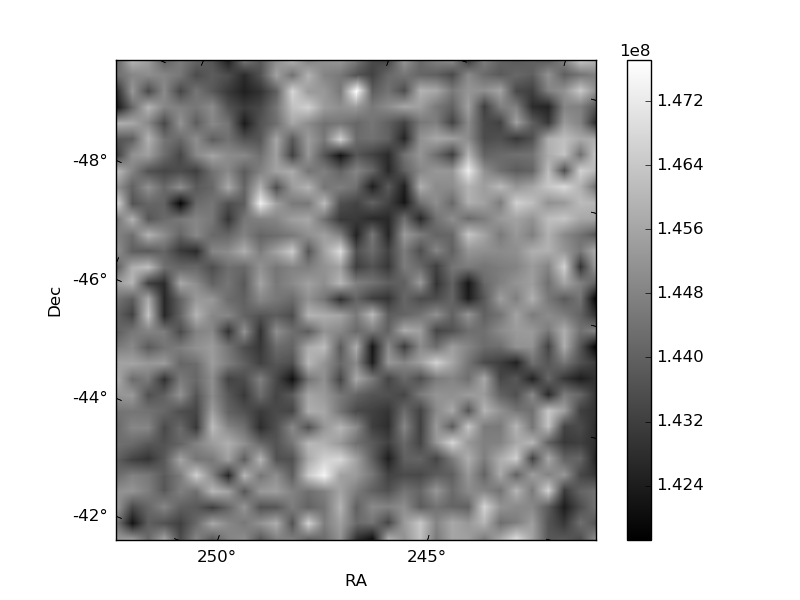
Quadrant B |
|---|---|---|---|
| Quadrant D | 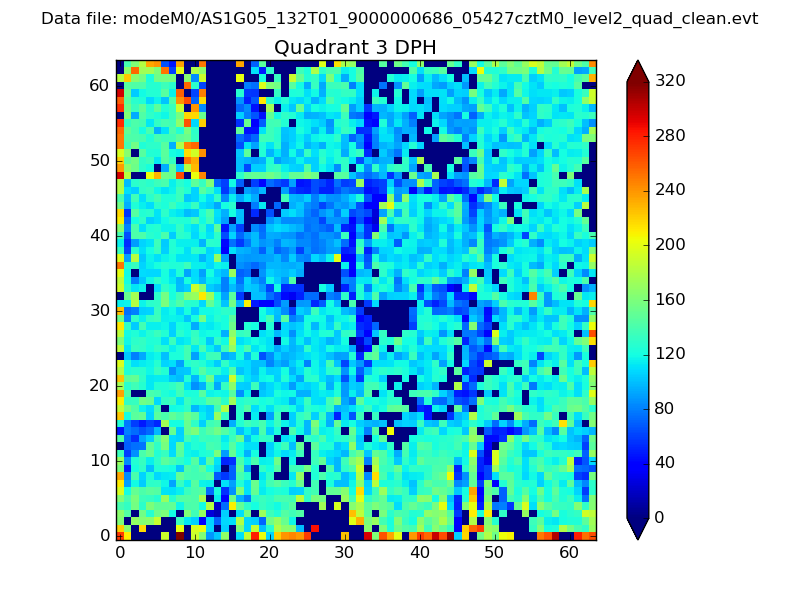 |
 |
Quadrant C |
| Plot type | Count rate plots | Images |
|---|---|---|
| Comparison with Poisson distribution Blue bars denote a histogram of data divided into 1 sec bins. Red curve is a Poisson curve with rate = median count rate of data. |
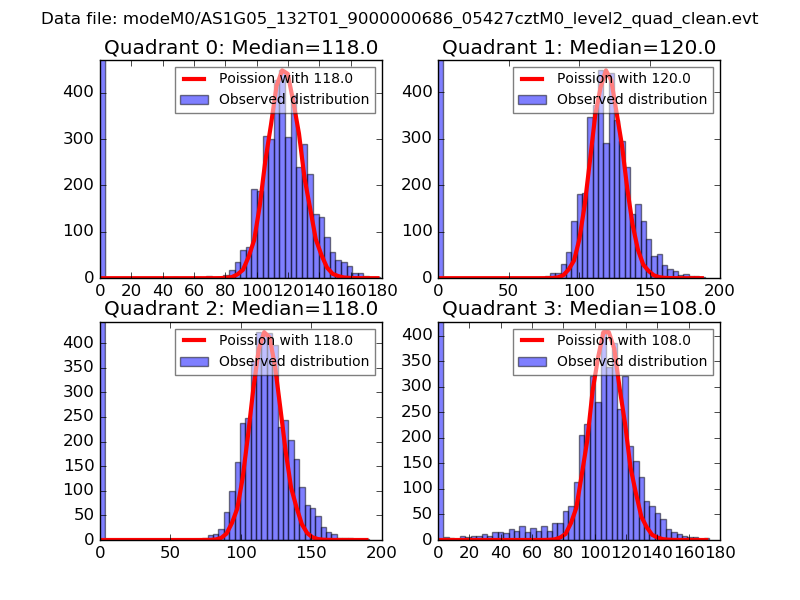 |
 |
| Quadrant-wise count rates Data is divided into 100 sec bins |
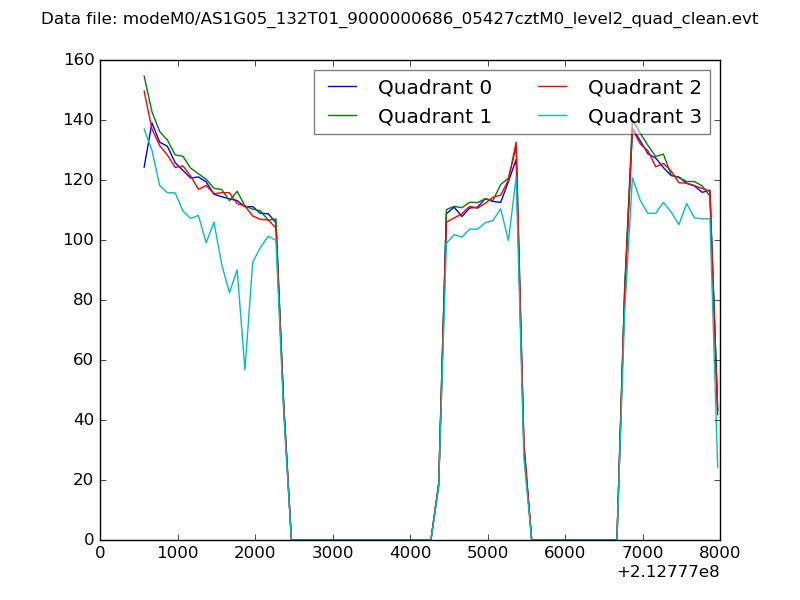 |
|
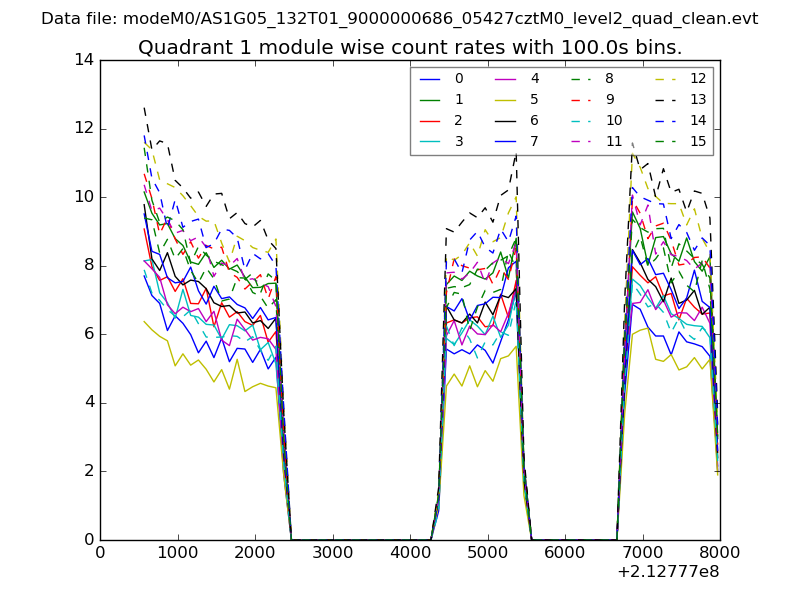
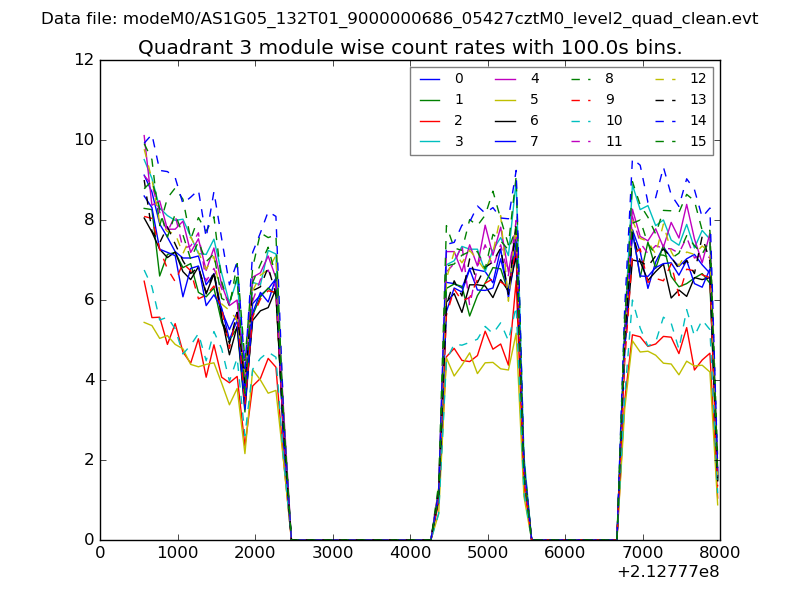
| Module-wise count rates for Quadrant A Data is divided into 100 sec bins |
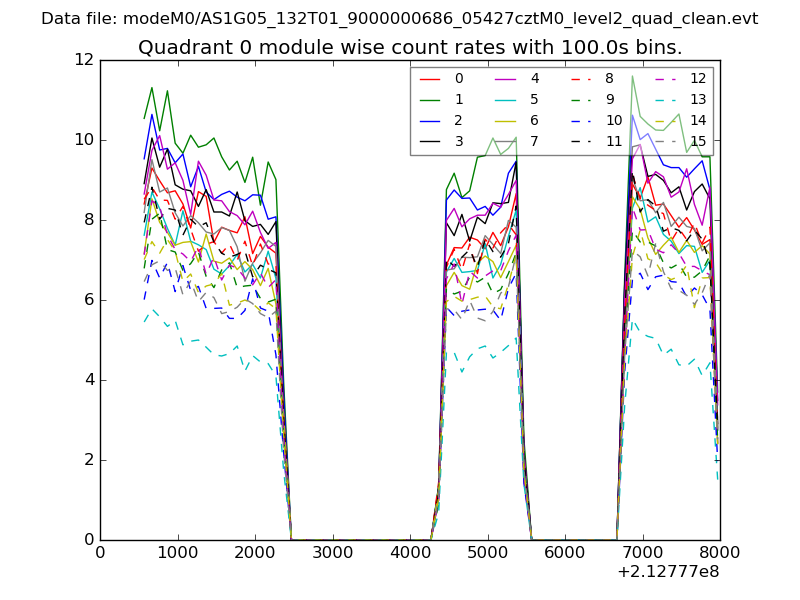 |
 |
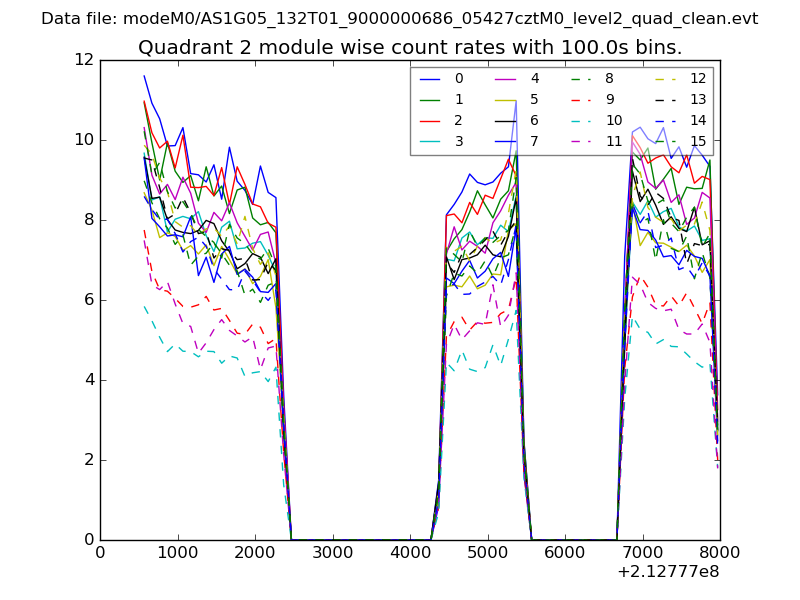
| Module-wise count rates for Quadrant B Data is divided into 100 sec bins |
 |
 |
| Module-wise count rates for Quadrant C Data is divided into 100 sec bins |
 |
 |
| Module-wise count rates for Quadrant D Data is divided into 100 sec bins |
 |
 |
| Parameter | Plot |
|---|---|
| CZT HV Monitor |  |
| D_VDD | 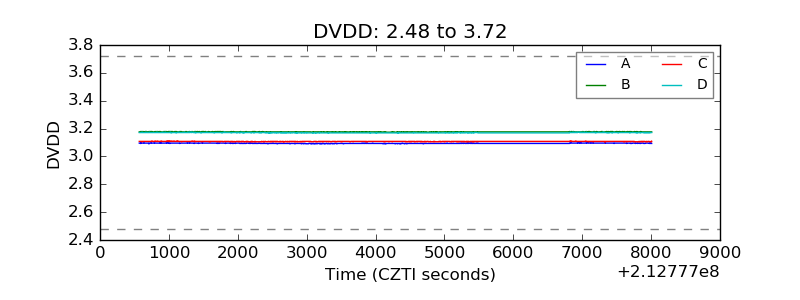 |
| Temperature 1 | 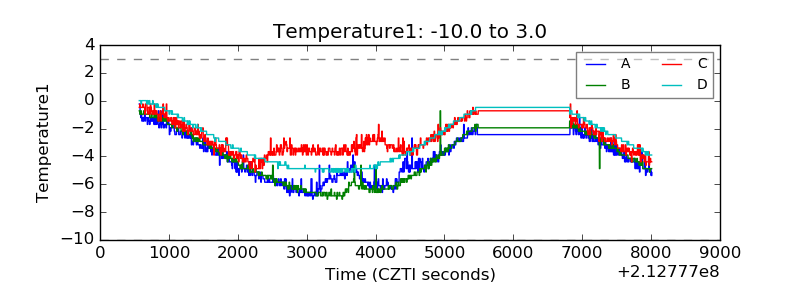 |
| Veto HV Monitor | 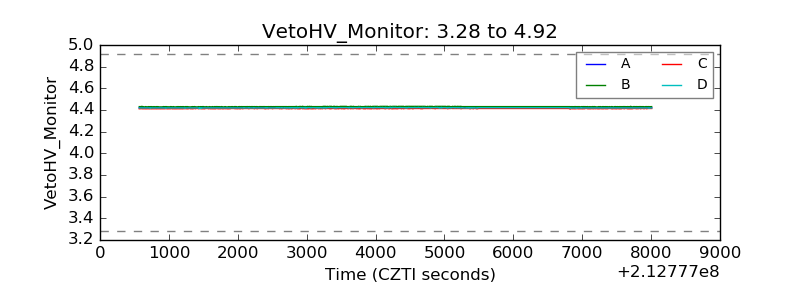 |
| Veto LLD | 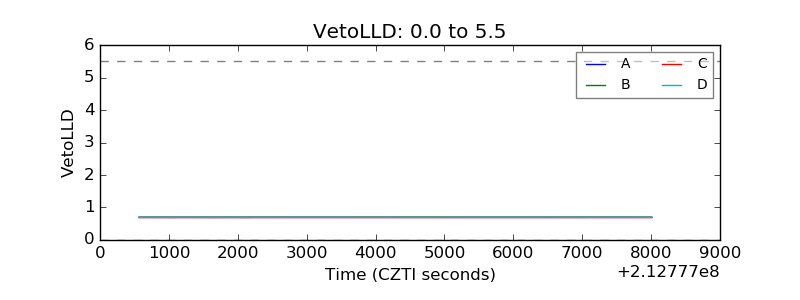 |
| Alpha Counter | 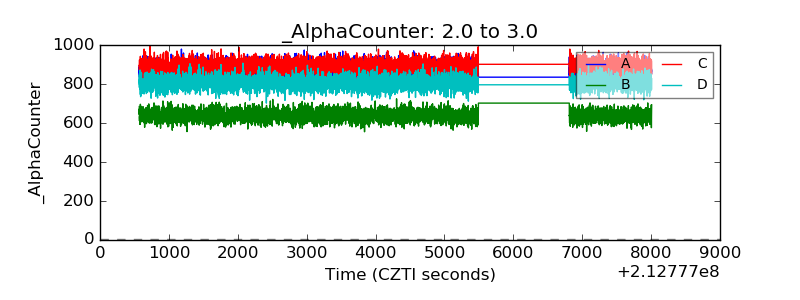 |
| _CPM_Rate | 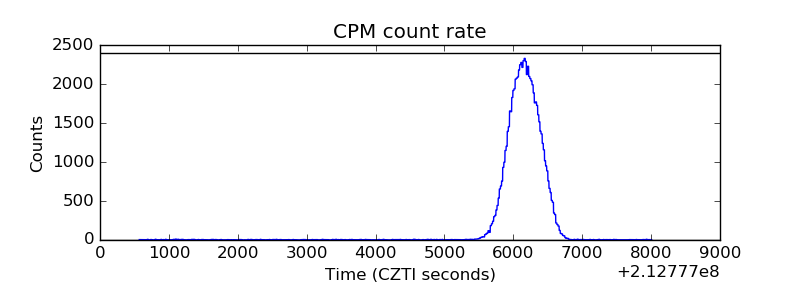 |
| CZT Counter | 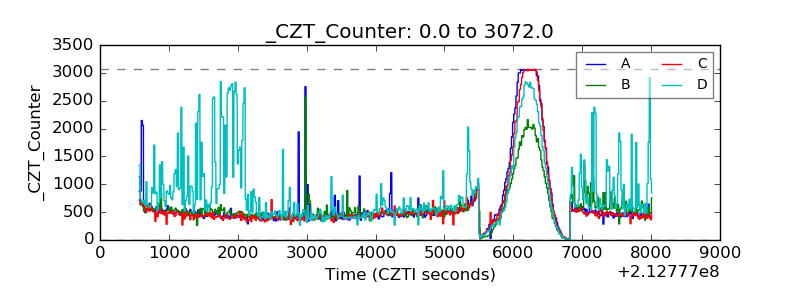 |
| +2.5 Volts monitor |  |
| +5 Volts monitor |  |
| _ROLL_ROT | 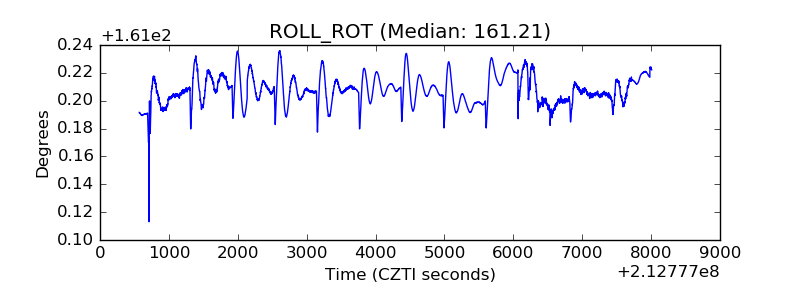 |
| _Roll_DEC | 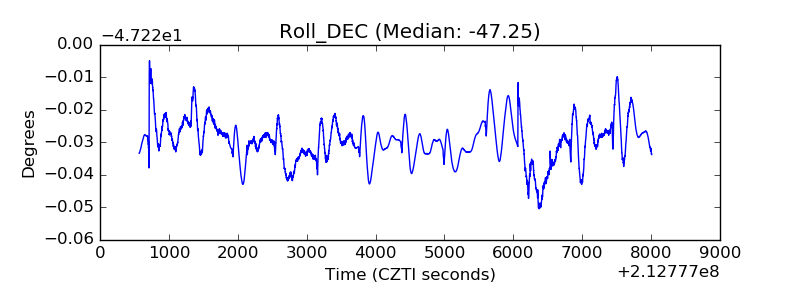 |
| _Roll_RA | 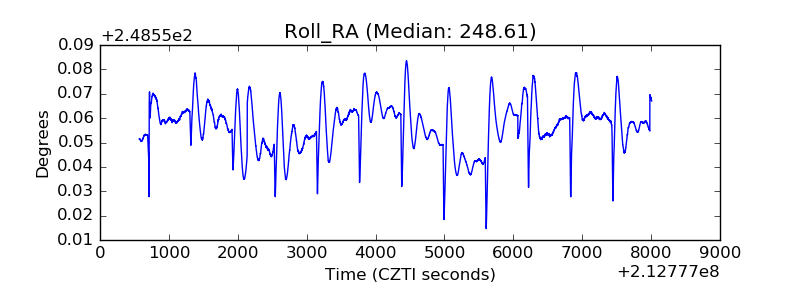 |
| Veto Counter | 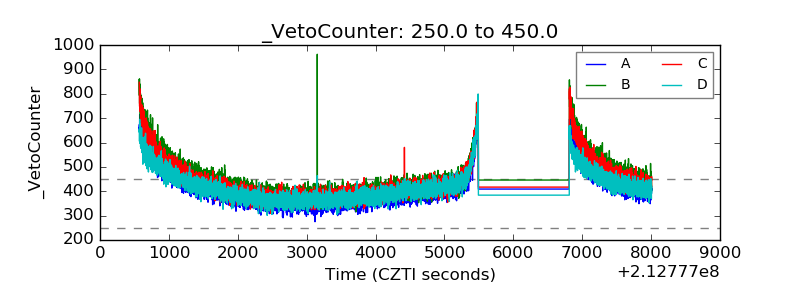 |