| Param | Original file | Final file |
|---|---|---|
| Filename | modeM0/AS1G05_132T01_9000000686_05428cztM0_level2.evt | modeM0/AS1G05_132T01_9000000686_05428cztM0_level2_quad_clean.evt |
| Size (bytes) | 466,214,400 | 74,908,800 |
| Size | 444.6 MB | 71.4 MB |
| Events in quadrant A | 2,954,316 | 466,298 |
| Events in quadrant B | 3,392,451 | 471,266 |
| Events in quadrant C | 2,848,073 | 468,066 |
| Events in quadrant D | 4,500,098 | 426,409 |
| Mode M9 | |||
|---|---|---|---|
| Quadrant | BADHDUFLAG | Total packets | Discarded packets |
| A | 0 | 16 | 1 |
| B | 0 | 16 | 0 |
| C | 0 | 16 | 0 |
| D | 0 | 17 | 0 |
| Mode SS | |||
|---|---|---|---|
| Quadrant | BADHDUFLAG | Total packets | Discarded packets |
| A | 0 | 126 | 0 |
| B | 0 | 126 | 0 |
| C | 0 | 126 | 2 |
| D | 0 | 126 | 0 |
| Mode M0 | |||
|---|---|---|---|
| Quadrant | BADHDUFLAG | Total packets | Discarded packets |
| A | 0 | 13011 | 29 |
| B | 0 | 14175 | 10 |
| C | 0 | 12829 | 4 |
| D | 0 | 17790 | 35 |
| Quadrant | Total seconds | Saturated seconds | Saturation percentage |
|---|---|---|---|
| A | 6251 | 24 | 0.383939% |
| B | 6259 | 45 | 0.718965% |
| C | 6262 | 17 | 0.271479% |
| D | 6252 | 254 | 4.062700% |
Noise dominated data is calculated using 1-second bins in cleaned event files. If a bin has >2000 counts, and if more than 50% of those come from <1% of pixels, then it is considered to be noise-dominated and hence unusable.
| Quadrant | # 1 sec bins | Bins with >0 counts | Bins with >2000 counts | High rate bins dominated by noise | Noise dominated (total time) | Noise dominated (detector-on time) | Marked lightcurve |
|---|---|---|---|---|---|---|---|
| A | 7568 | 6263 | 1 | 1 | 0.01% | 0.02% | 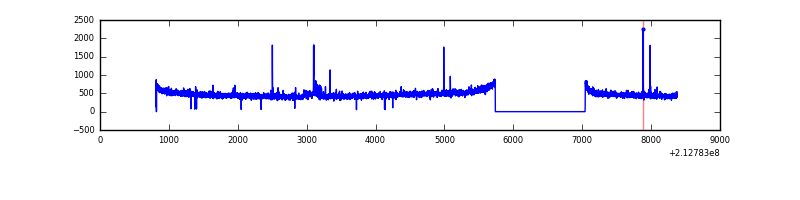 |
| B | 7568 | 6264 | 1 | 1 | 0.01% | 0.02% | 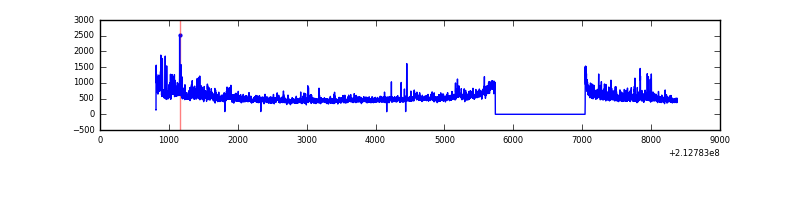 |
| C | 7568 | 6264 | 0 | 0 | 0.00% | 0.00% | 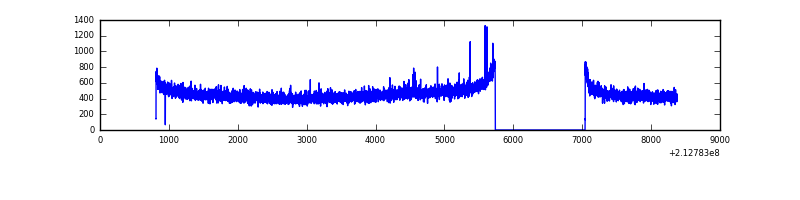 |
| D | 7568 | 6264 | 248 | 248 | 3.28% | 3.96% | 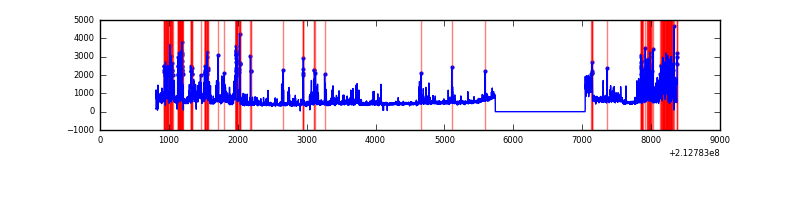 |
Top three noisy pixels from each quadrant. If the there are fewer than three noisy pixels in the level2.evt file, extra rows are filled as -1
| Pixel properties | Quadrant properties | ||||||
|---|---|---|---|---|---|---|---|
| Quadrant | DetID | PixID | Counts | Sigma | Mean | Median | Sigma |
| A | 0 | 50 | 57629 | 372.63 | 750 | 734 | 152.7 |
| A | 13 | 6 | 7971 | 47.4 | 750 | 734 | 152.7 |
| A | 0 | 226 | 7549 | 44.63 | 750 | 734 | 152.7 |
| B | 15 | 204 | 261763 | 1797.17 | 764 | 748 | 145.2 |
| B | 0 | 219 | 49622 | 336.51 | 764 | 748 | 145.2 |
| B | 4 | 48 | 30831 | 207.13 | 764 | 748 | 145.2 |
| C | 9 | 247 | 14454 | 82.77 | 723 | 727 | 165.9 |
| C | 13 | 61 | 5935 | 31.4 | 723 | 727 | 165.9 |
| C | 14 | 67 | 5078 | 26.23 | 723 | 727 | 165.9 |
| D | 2 | 152 | 647600 | 3719.83 | 705 | 683 | 173.9 |
| D | 2 | 33 | 443724 | 2547.52 | 705 | 683 | 173.9 |
| D | 12 | 233 | 297205 | 1705.03 | 705 | 683 | 173.9 |
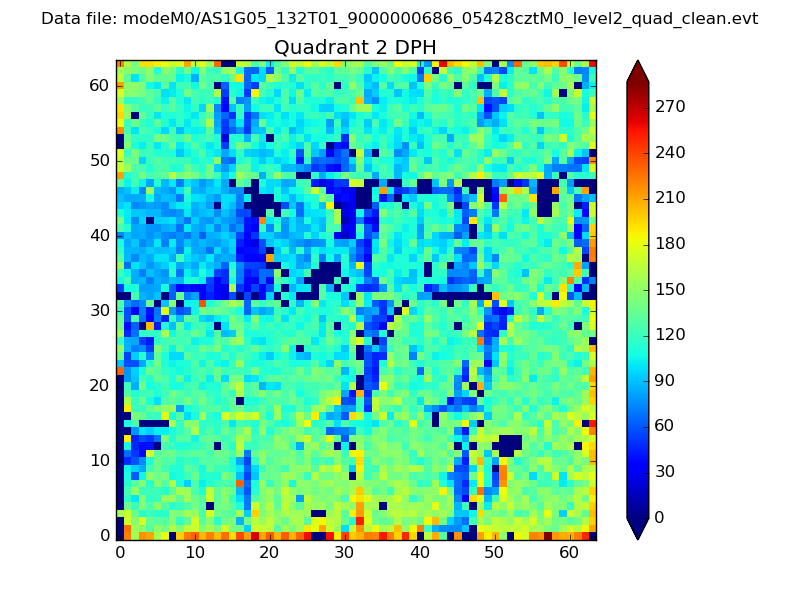
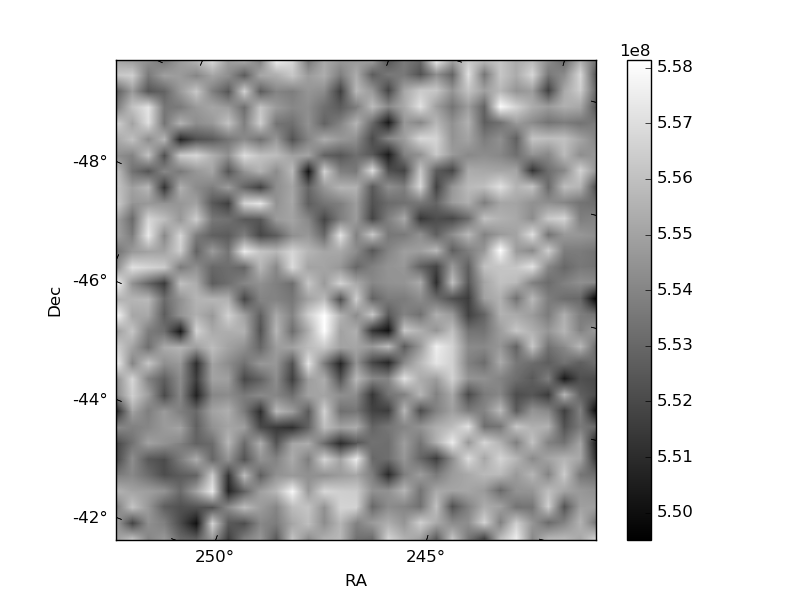
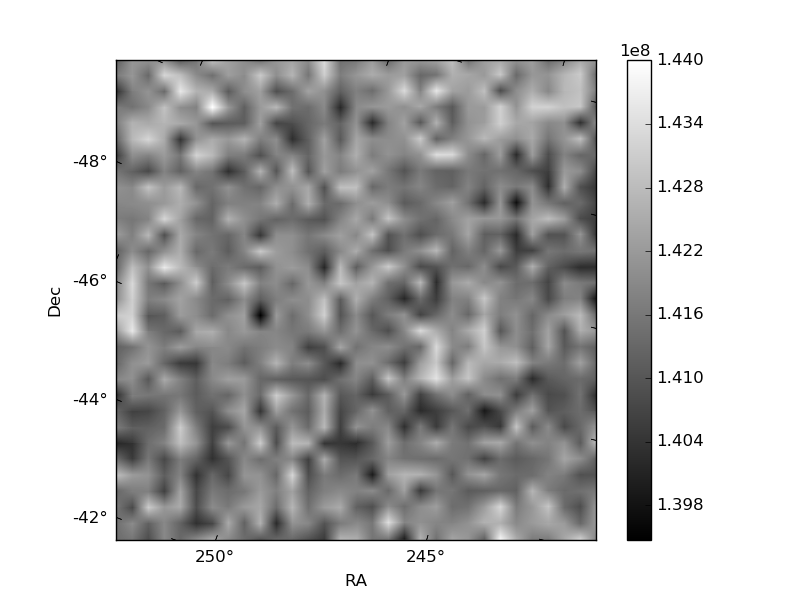
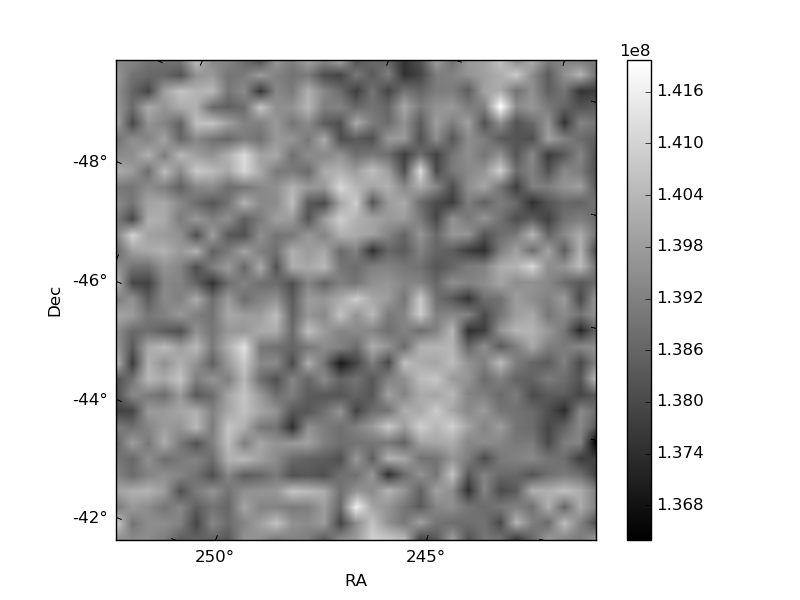
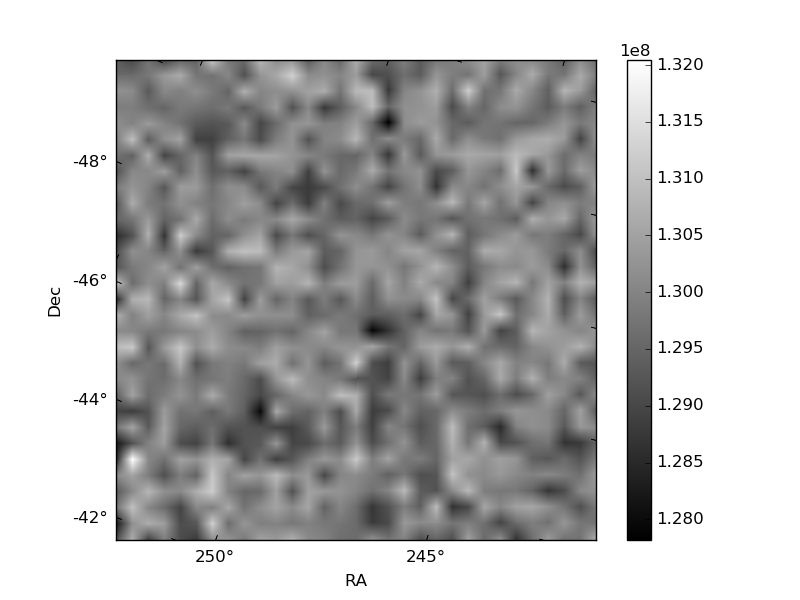
Histogram calculated using DETX and DETY for each event in the final _common_clean file
| Quadrant A | 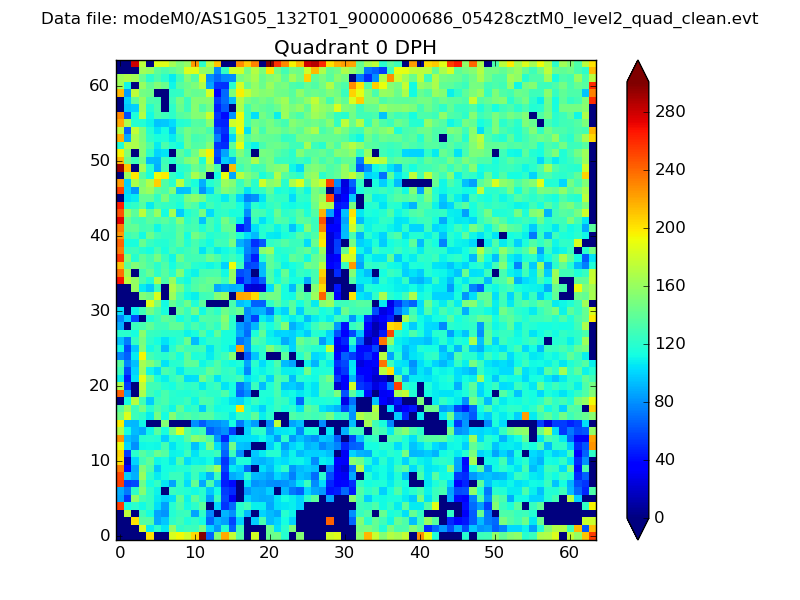 |
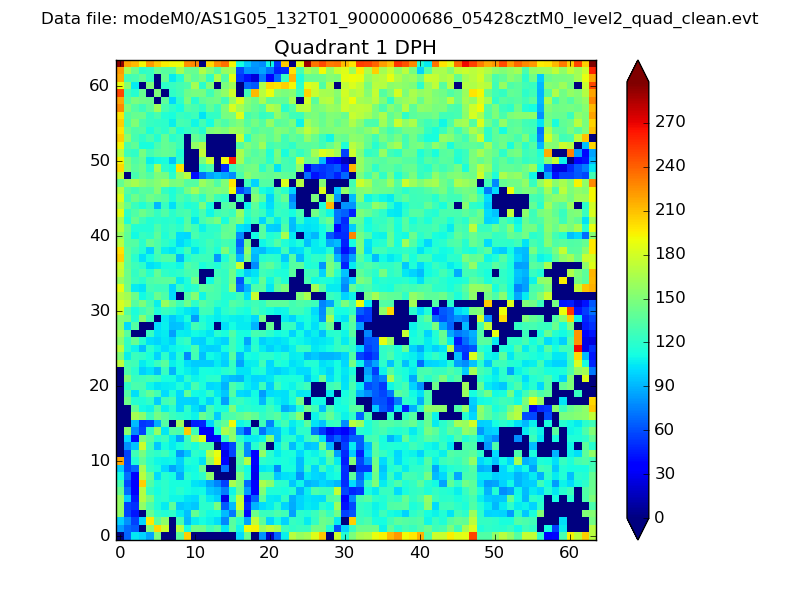 |
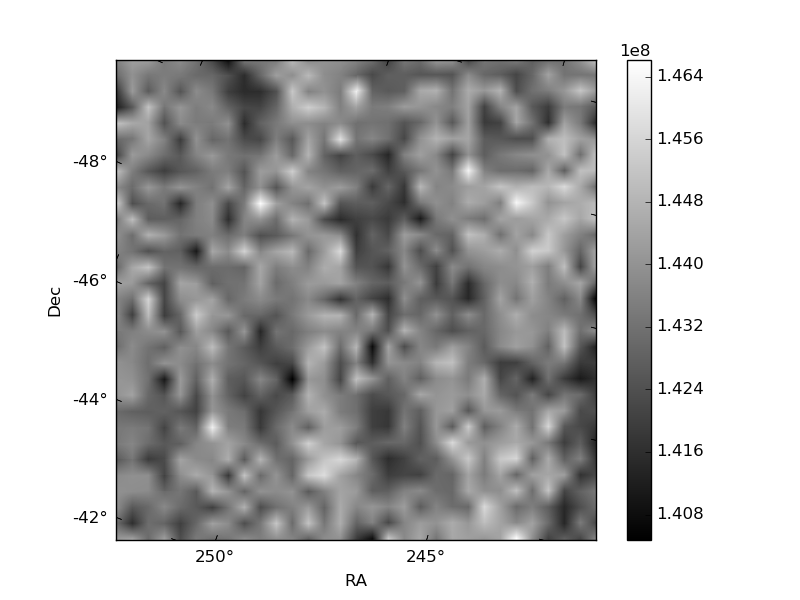
Quadrant B |
|---|---|---|---|
| Quadrant D | 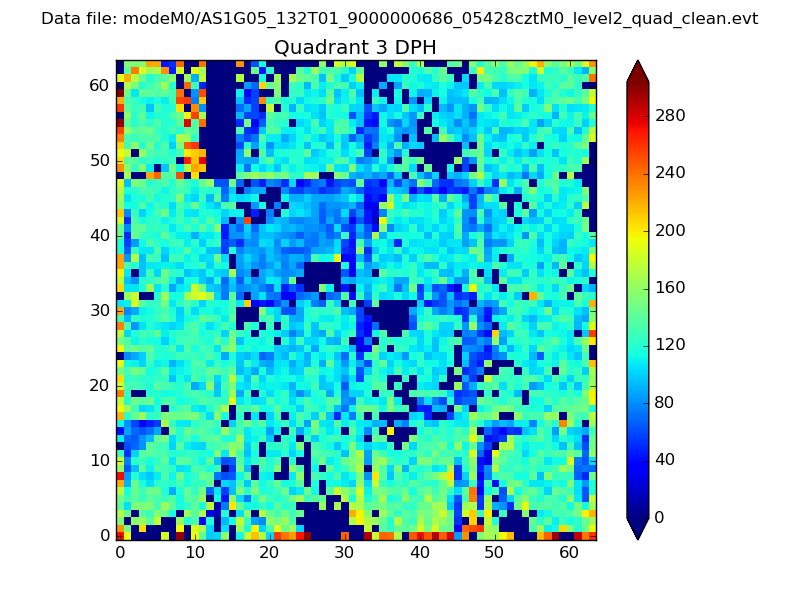 |
 |
Quadrant C |
| Plot type | Count rate plots | Images |
|---|---|---|
| Comparison with Poisson distribution Blue bars denote a histogram of data divided into 1 sec bins. Red curve is a Poisson curve with rate = median count rate of data. |
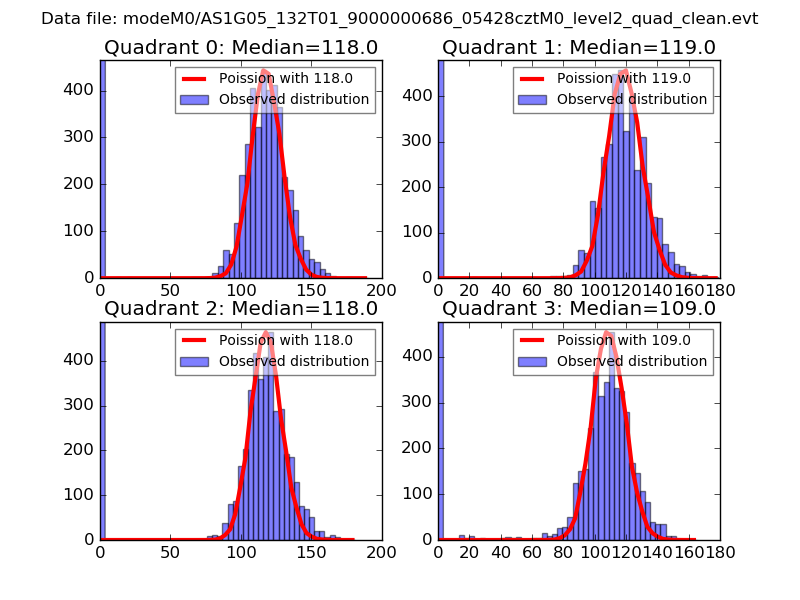 |
 |
| Quadrant-wise count rates Data is divided into 100 sec bins |
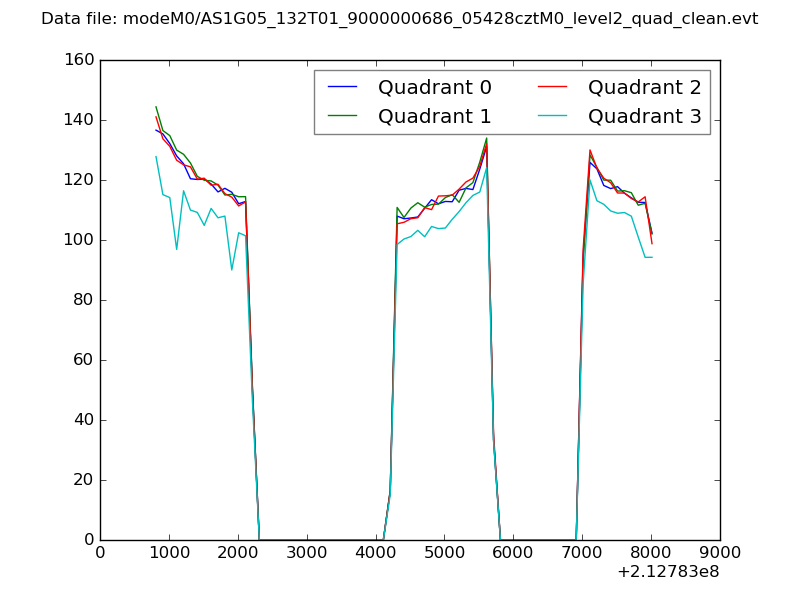 |
|
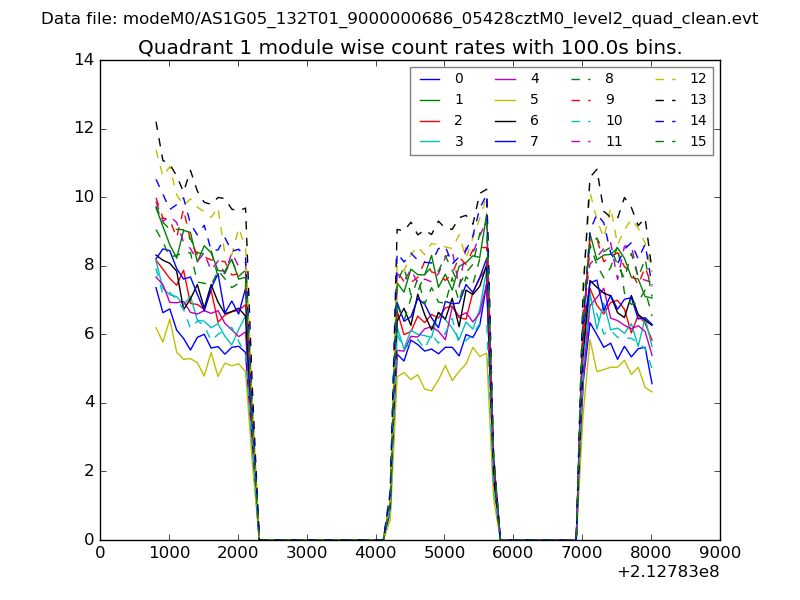
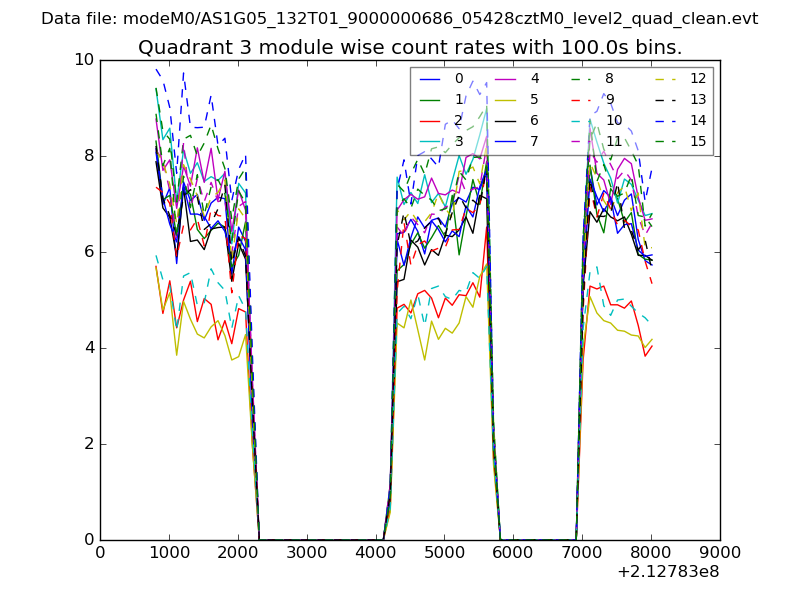
| Module-wise count rates for Quadrant A Data is divided into 100 sec bins |
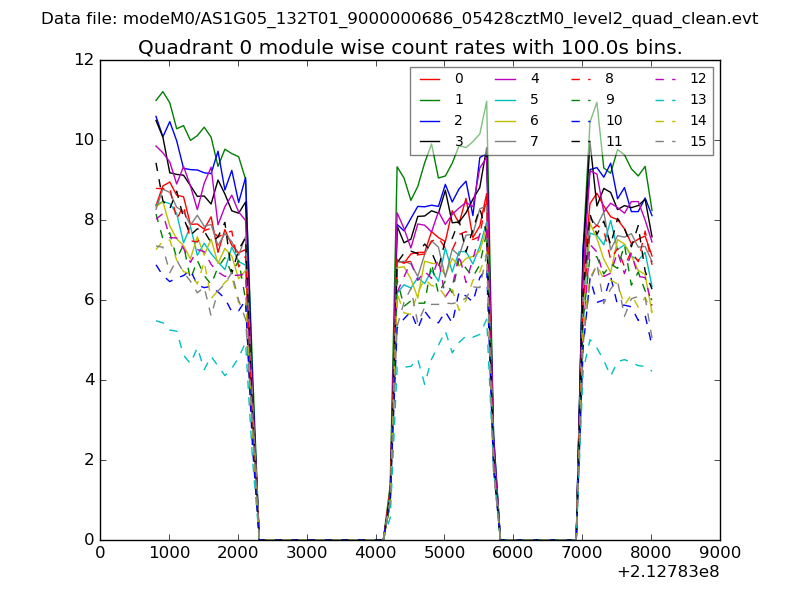 |
 |
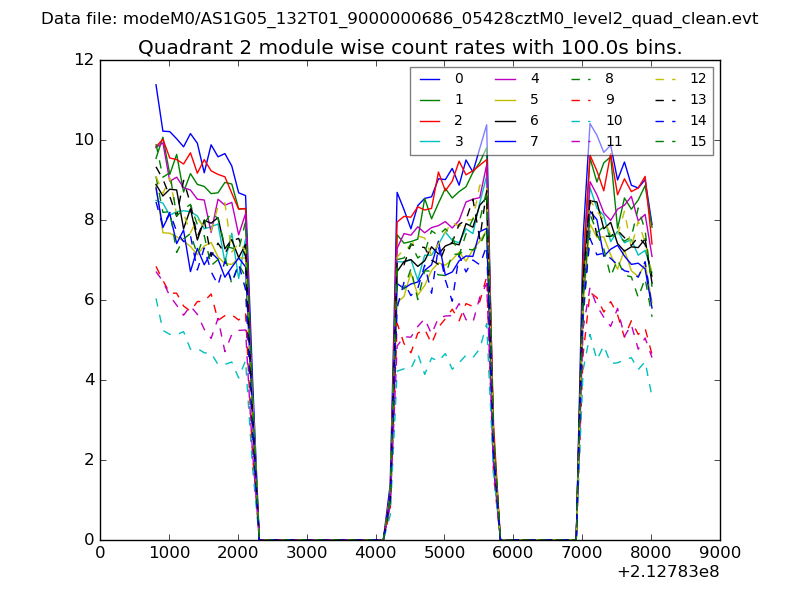
| Module-wise count rates for Quadrant B Data is divided into 100 sec bins |
 |
 |
| Module-wise count rates for Quadrant C Data is divided into 100 sec bins |
 |
 |
| Module-wise count rates for Quadrant D Data is divided into 100 sec bins |
 |
 |
| Parameter | Plot |
|---|---|
| CZT HV Monitor | 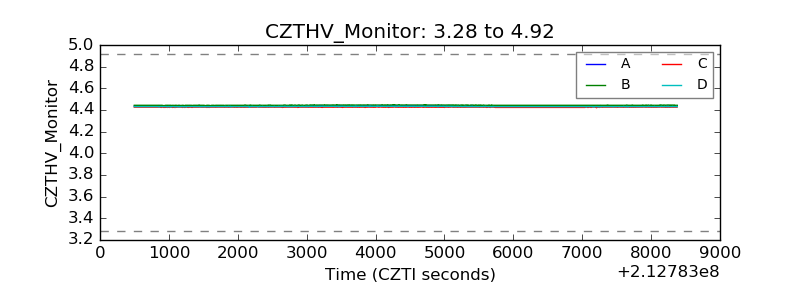 |
| D_VDD | 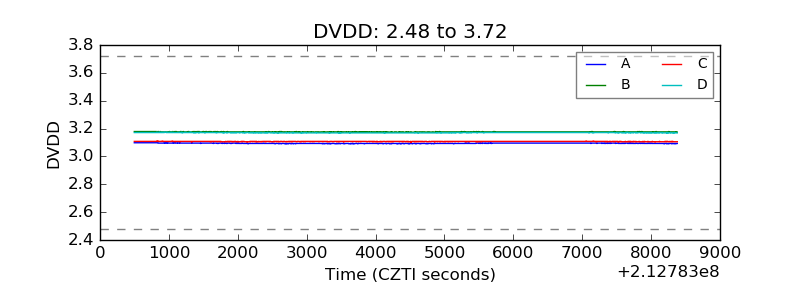 |
| Temperature 1 | 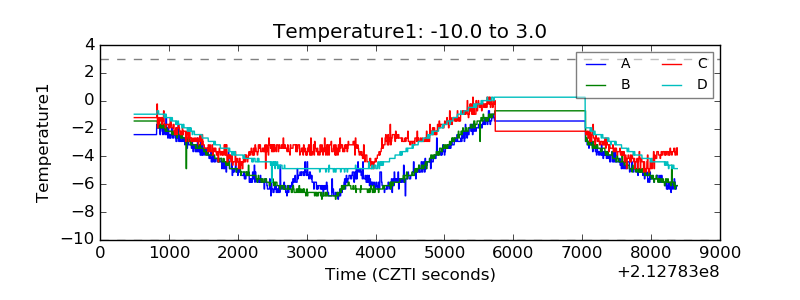 |
| Veto HV Monitor |  |
| Veto LLD | 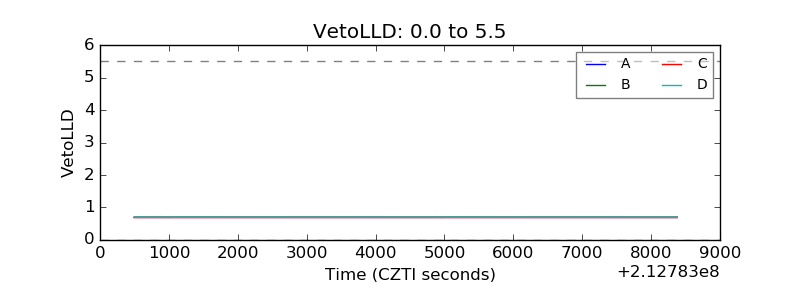 |
| Alpha Counter | 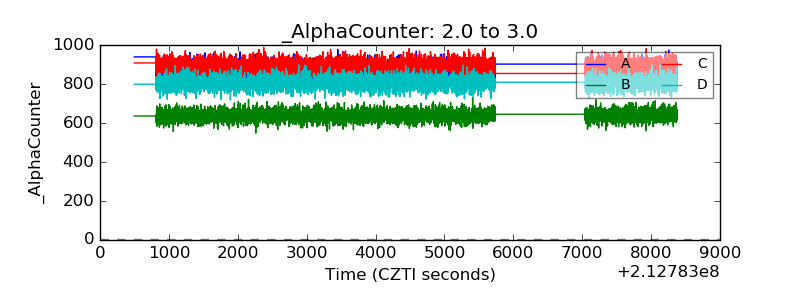 |
| _CPM_Rate | 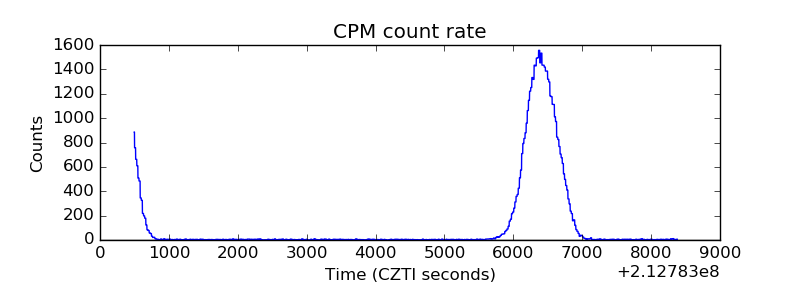 |
| CZT Counter | 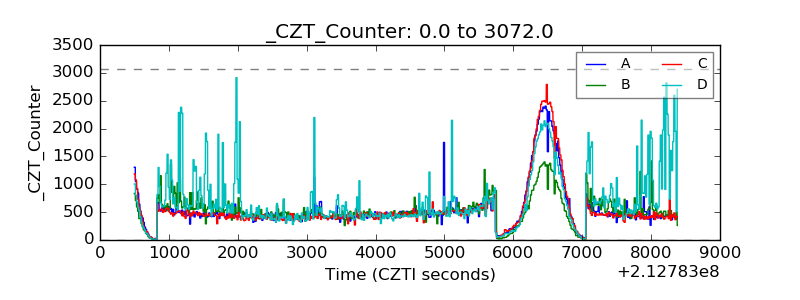 |
| +2.5 Volts monitor |  |
| +5 Volts monitor |  |
| _ROLL_ROT | 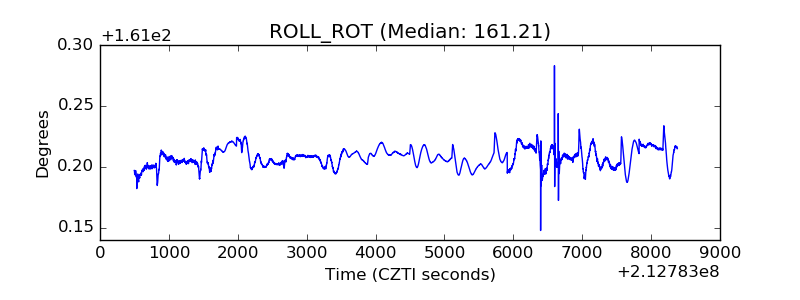 |
| _Roll_DEC | 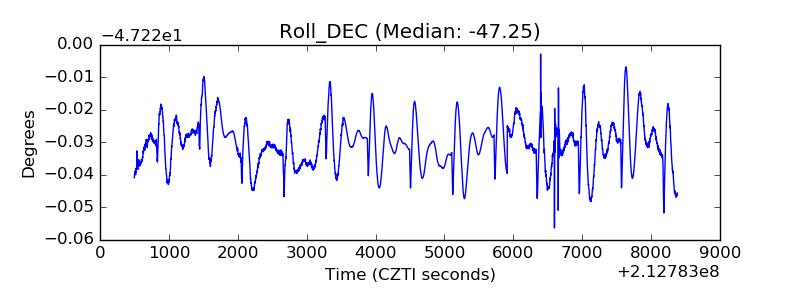 |
| _Roll_RA | 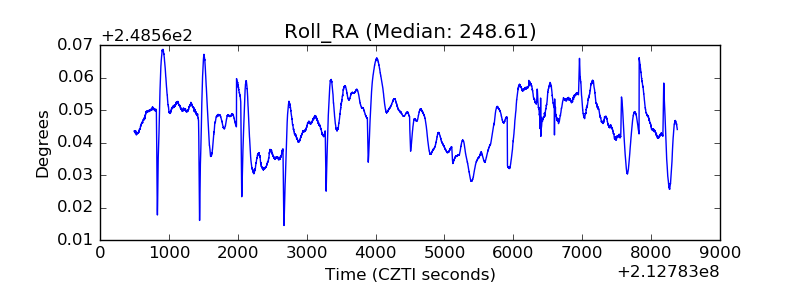 |
| Veto Counter | 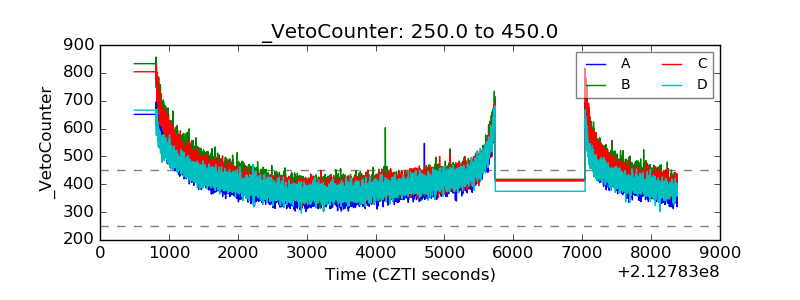 |