| Param | Original file | Final file |
|---|---|---|
| Filename | modeM0/AS1G05_132T01_9000000686_05429cztM0_level2.evt | modeM0/AS1G05_132T01_9000000686_05429cztM0_level2_quad_clean.evt |
| Size (bytes) | 450,495,360 | 68,057,280 |
| Size | 429.6 MB | 64.9 MB |
| Events in quadrant A | 2,866,083 | 410,199 |
| Events in quadrant B | 3,232,531 | 414,504 |
| Events in quadrant C | 2,811,669 | 413,779 |
| Events in quadrant D | 4,306,432 | 383,976 |
| Mode M9 | |||
|---|---|---|---|
| Quadrant | BADHDUFLAG | Total packets | Discarded packets |
| A | 0 | 19 | 0 |
| B | 0 | 19 | 0 |
| C | 0 | 19 | 0 |
| D | 0 | 20 | 0 |
| Mode SS | |||
|---|---|---|---|
| Quadrant | BADHDUFLAG | Total packets | Discarded packets |
| A | 0 | 126 | 0 |
| B | 0 | 126 | 0 |
| C | 0 | 126 | 0 |
| D | 0 | 126 | 0 |
| Mode M0 | |||
|---|---|---|---|
| Quadrant | BADHDUFLAG | Total packets | Discarded packets |
| A | 0 | 12875 | 3 |
| B | 0 | 13728 | 2 |
| C | 0 | 12762 | 2 |
| D | 0 | 17278 | 2 |
| Quadrant | Total seconds | Saturated seconds | Saturation percentage |
|---|---|---|---|
| A | 6284 | 16 | 0.254615% |
| B | 6284 | 24 | 0.381922% |
| C | 6284 | 3 | 0.047740% |
| D | 6284 | 212 | 3.373647% |
Noise dominated data is calculated using 1-second bins in cleaned event files. If a bin has >2000 counts, and if more than 50% of those come from <1% of pixels, then it is considered to be noise-dominated and hence unusable.
| Quadrant | # 1 sec bins | Bins with >0 counts | Bins with >2000 counts | High rate bins dominated by noise | Noise dominated (total time) | Noise dominated (detector-on time) | Marked lightcurve |
|---|---|---|---|---|---|---|---|
| A | 7524 | 6285 | 2 | 2 | 0.03% | 0.03% | 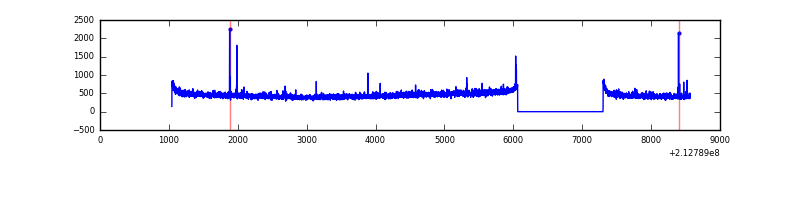 |
| B | 7524 | 6285 | 1 | 1 | 0.01% | 0.02% | 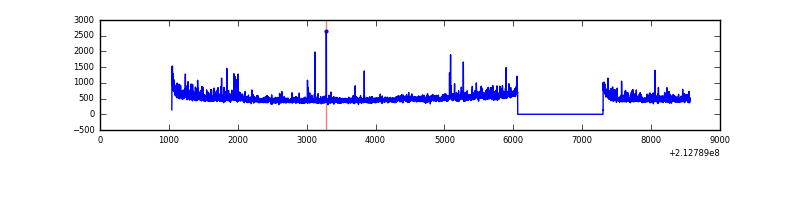 |
| C | 7524 | 6285 | 0 | 0 | 0.00% | 0.00% | 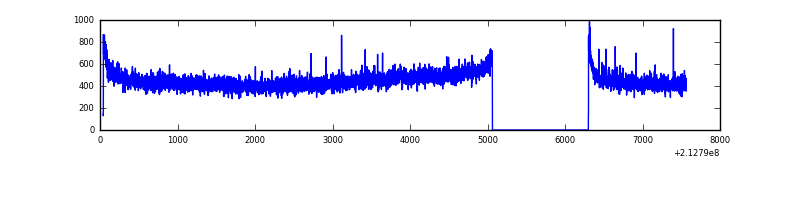 |
| D | 7524 | 6285 | 185 | 185 | 2.46% | 2.94% | 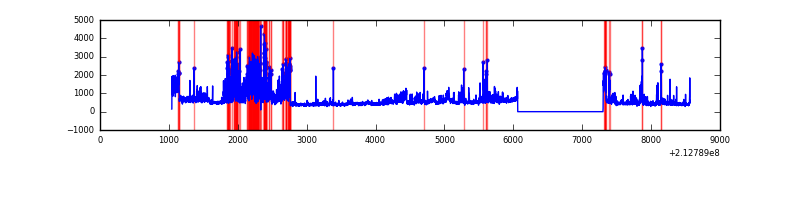 |
Top three noisy pixels from each quadrant. If the there are fewer than three noisy pixels in the level2.evt file, extra rows are filled as -1
| Pixel properties | Quadrant properties | ||||||
|---|---|---|---|---|---|---|---|
| Quadrant | DetID | PixID | Counts | Sigma | Mean | Median | Sigma |
| A | 0 | 50 | 30522 | 198.34 | 734 | 720 | 150.3 |
| A | 0 | 226 | 7271 | 43.6 | 734 | 720 | 150.3 |
| A | 12 | 194 | 7148 | 42.78 | 734 | 720 | 150.3 |
| B | 15 | 204 | 233933 | 1657.45 | 746 | 731 | 140.7 |
| B | 0 | 219 | 30877 | 214.26 | 746 | 731 | 140.7 |
| B | 15 | 54 | 26408 | 182.5 | 746 | 731 | 140.7 |
| C | 14 | 67 | 17340 | 101.65 | 712 | 717 | 163.5 |
| C | 12 | 4 | 6575 | 35.82 | 712 | 717 | 163.5 |
| C | 13 | 61 | 5833 | 31.29 | 712 | 717 | 163.5 |
| D | 2 | 152 | 930442 | 5412.65 | 695 | 673 | 171.8 |
| D | 2 | 33 | 387024 | 2249.14 | 695 | 673 | 171.8 |
| D | 7 | 203 | 102250 | 591.33 | 695 | 673 | 171.8 |
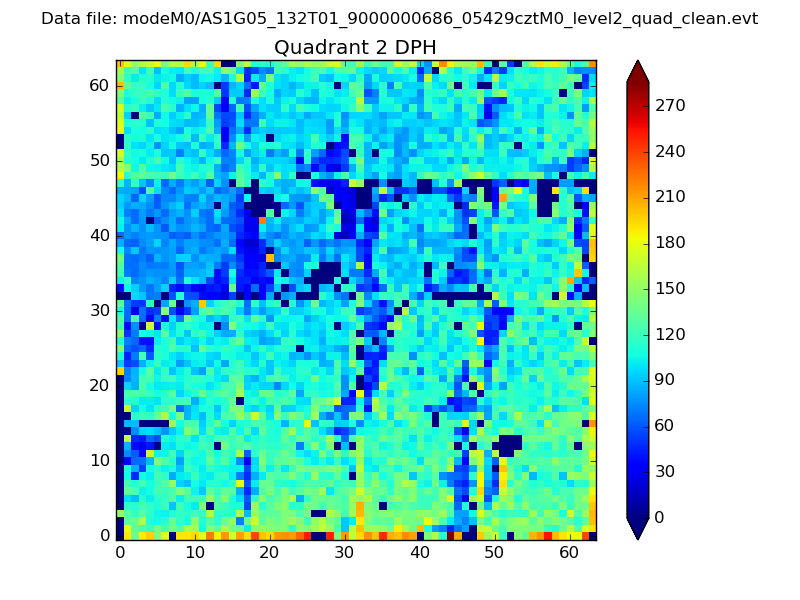
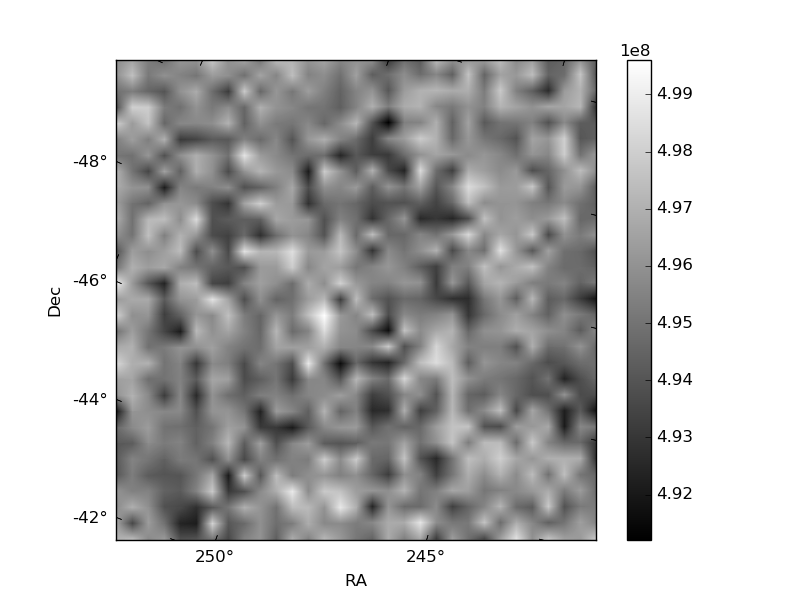
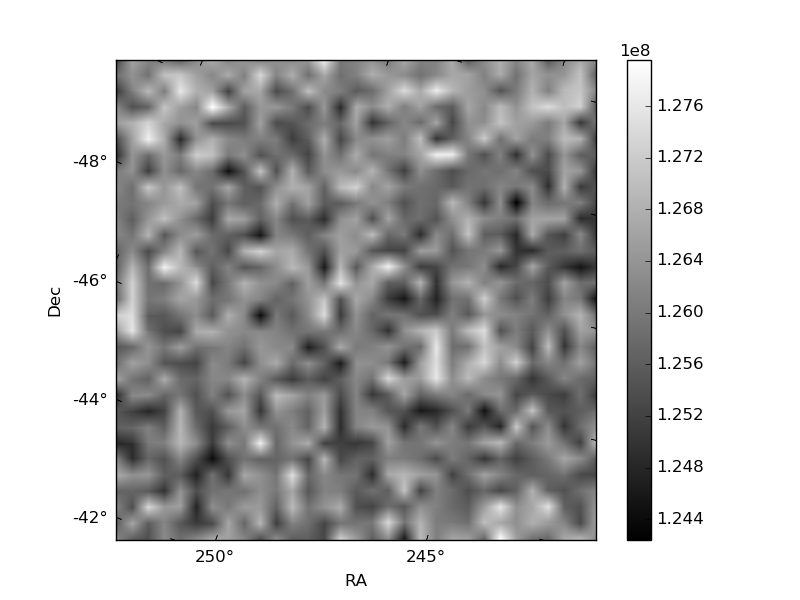
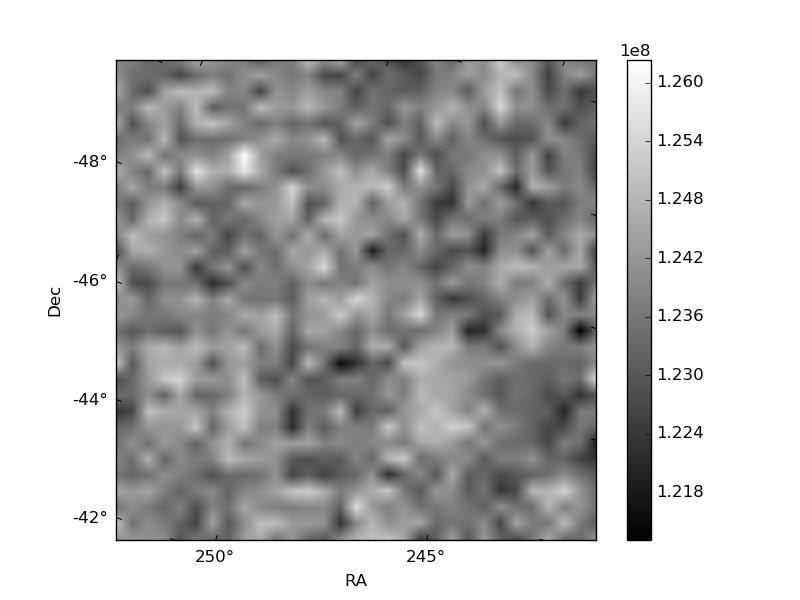
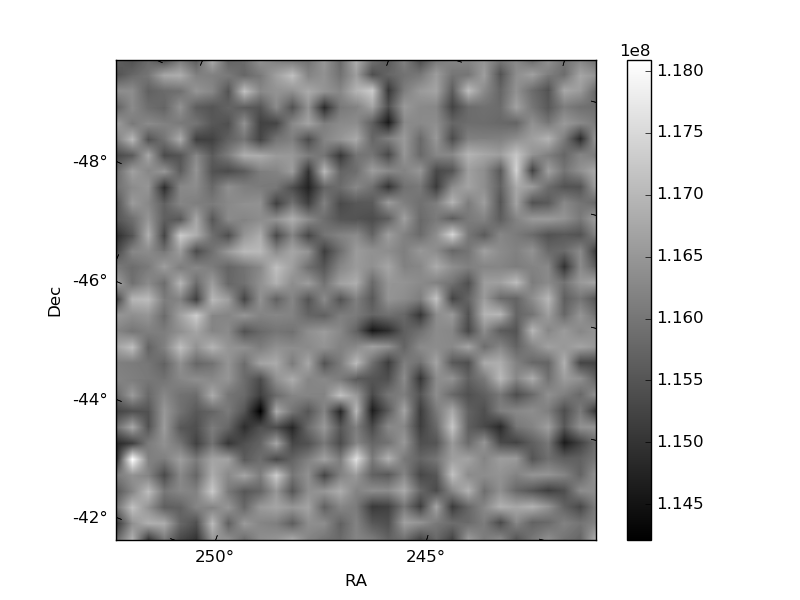
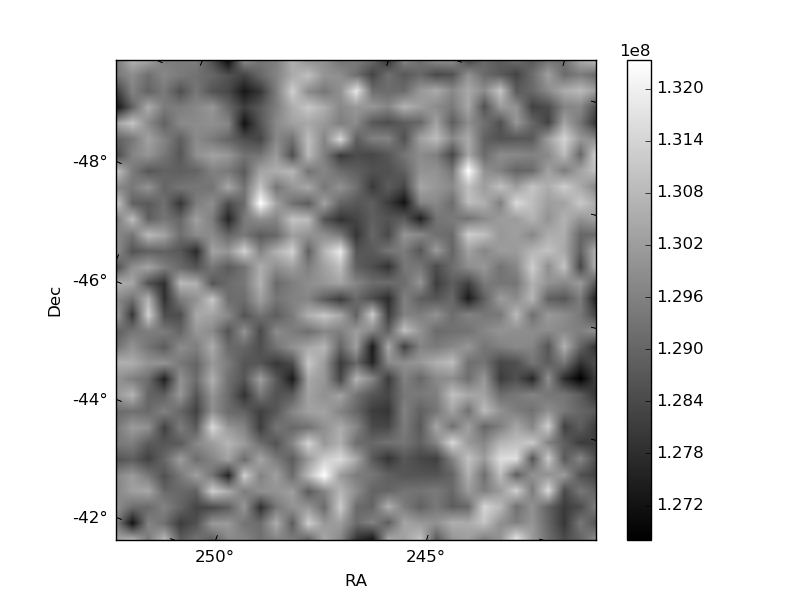
Histogram calculated using DETX and DETY for each event in the final _common_clean file
| Quadrant A | 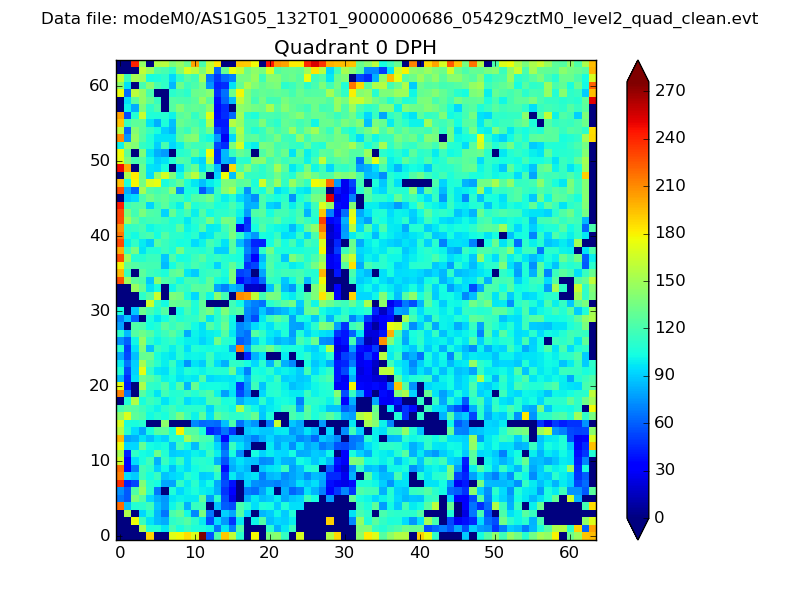 |
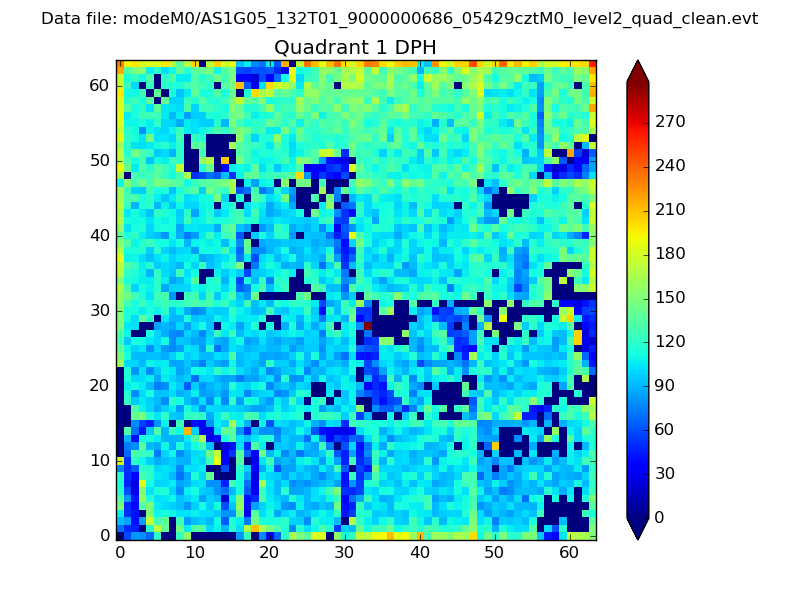 |
Quadrant B |
|---|---|---|---|
| Quadrant D | 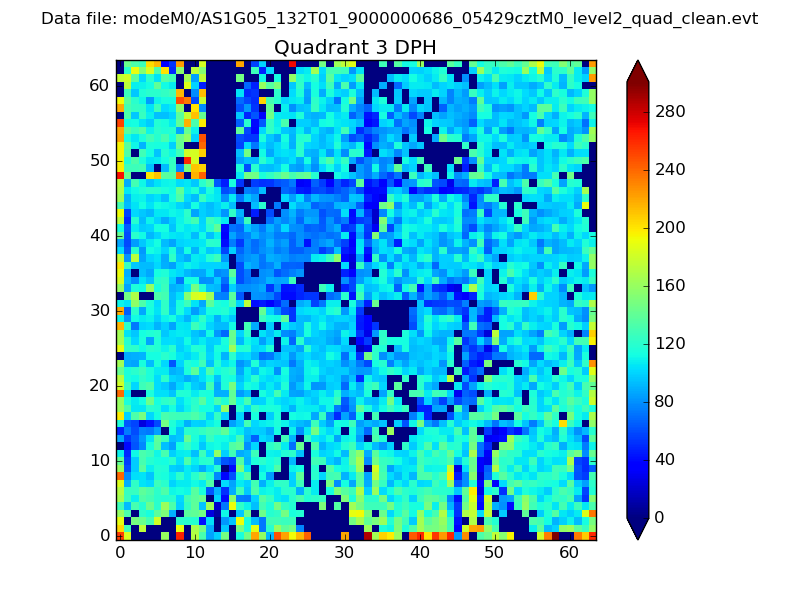 |
 |
Quadrant C |
| Plot type | Count rate plots | Images |
|---|---|---|
| Comparison with Poisson distribution Blue bars denote a histogram of data divided into 1 sec bins. Red curve is a Poisson curve with rate = median count rate of data. |
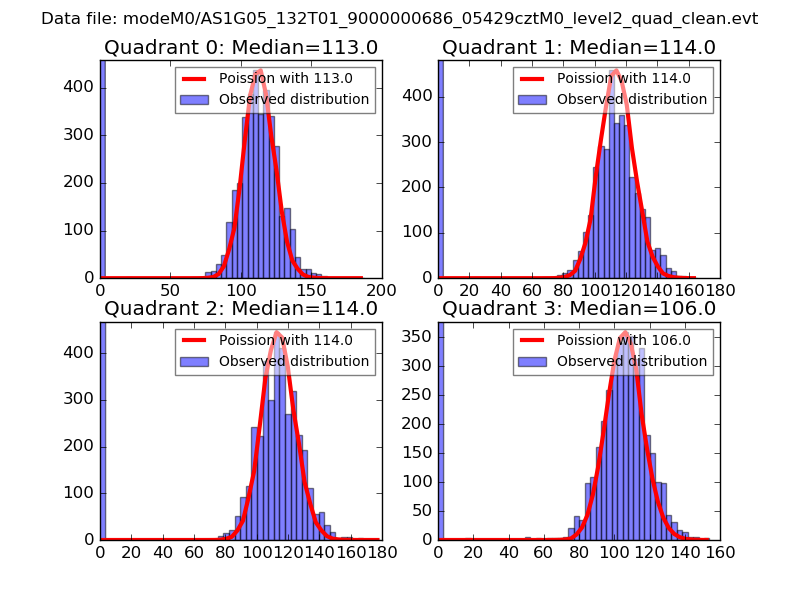 |
 |
| Quadrant-wise count rates Data is divided into 100 sec bins |
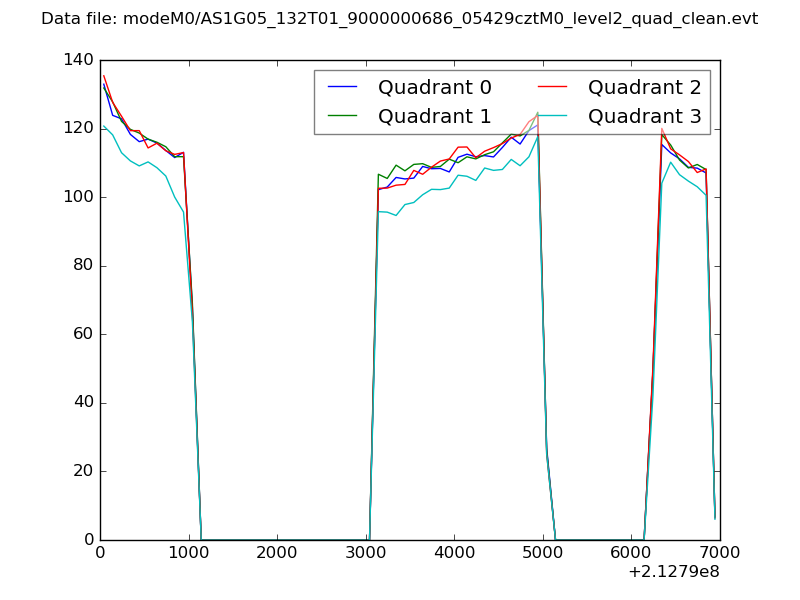 |
|
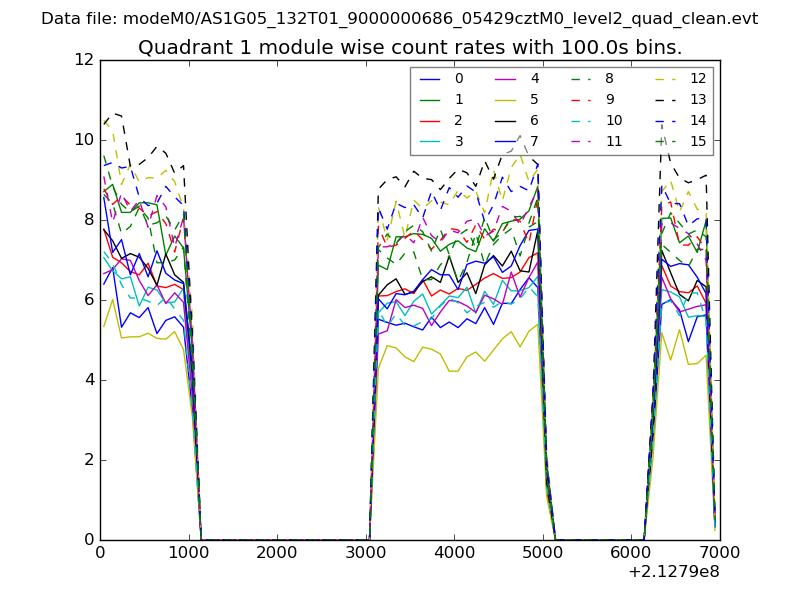
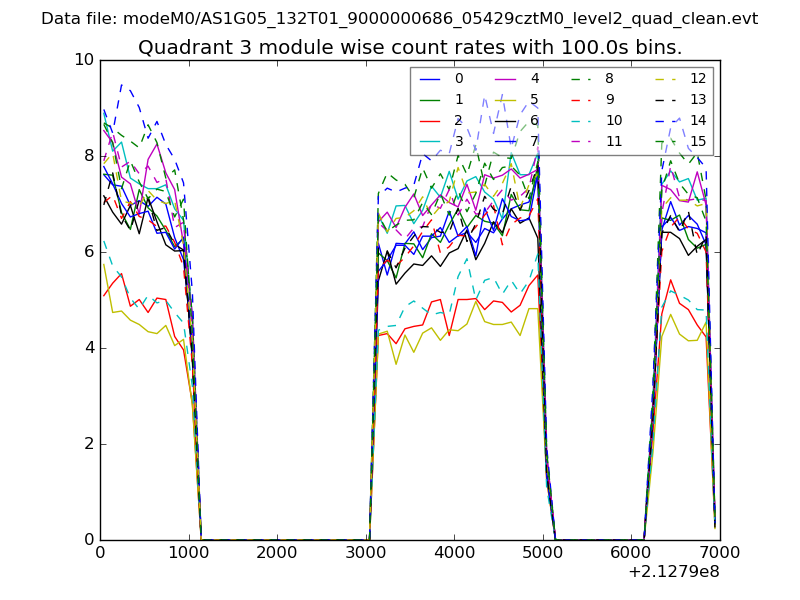
| Module-wise count rates for Quadrant A Data is divided into 100 sec bins |
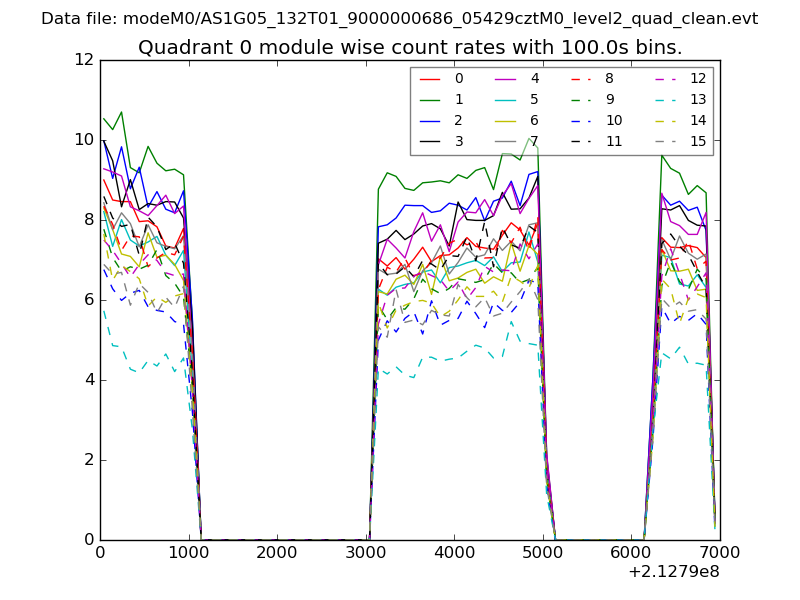 |
 |
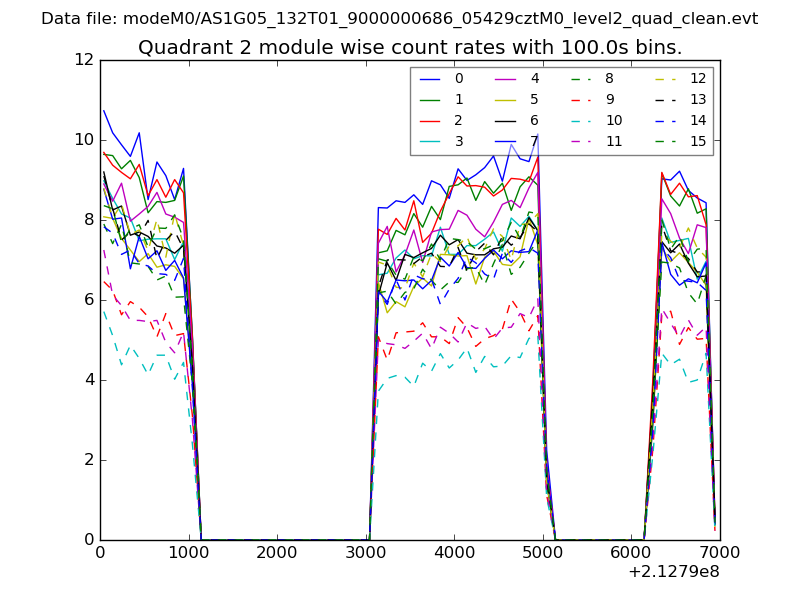
| Module-wise count rates for Quadrant B Data is divided into 100 sec bins |
 |
 |
| Module-wise count rates for Quadrant C Data is divided into 100 sec bins |
 |
 |
| Module-wise count rates for Quadrant D Data is divided into 100 sec bins |
 |
 |
| Parameter | Plot |
|---|---|
| CZT HV Monitor | 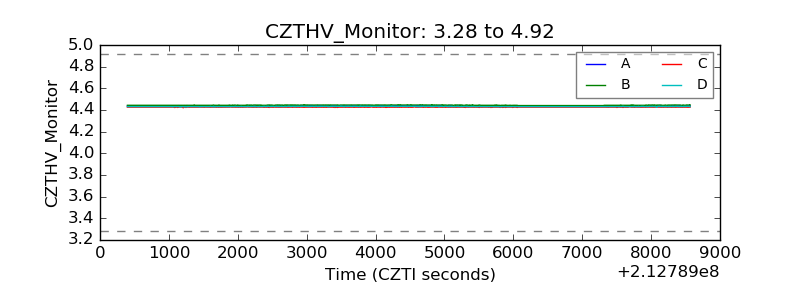 |
| D_VDD | 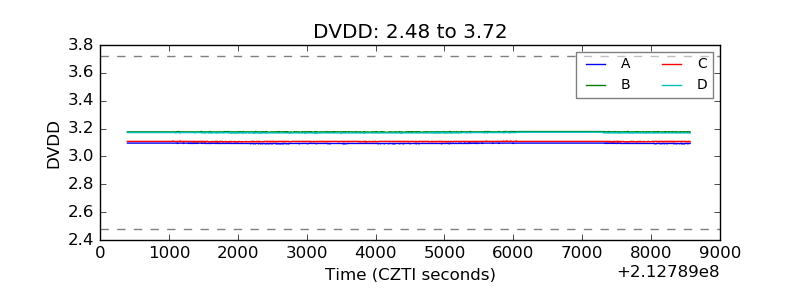 |
| Temperature 1 | 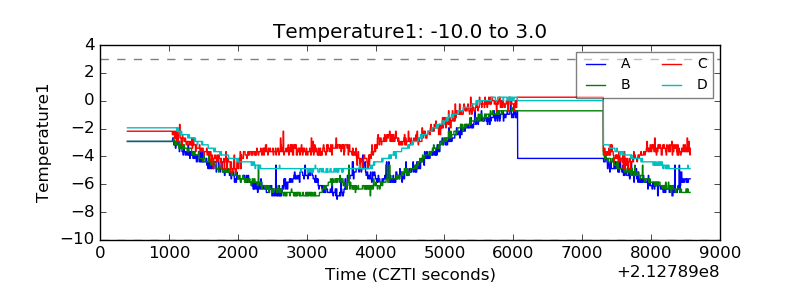 |
| Veto HV Monitor | 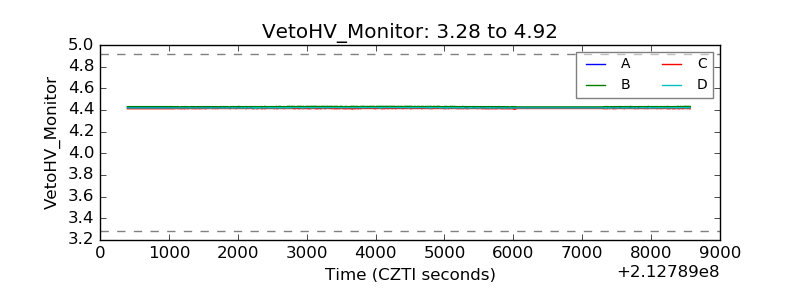 |
| Veto LLD | 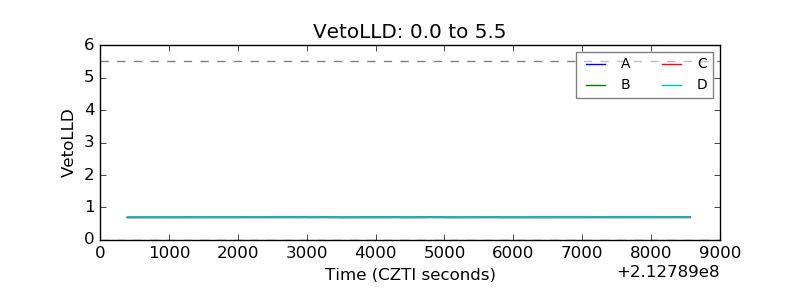 |
| Alpha Counter | 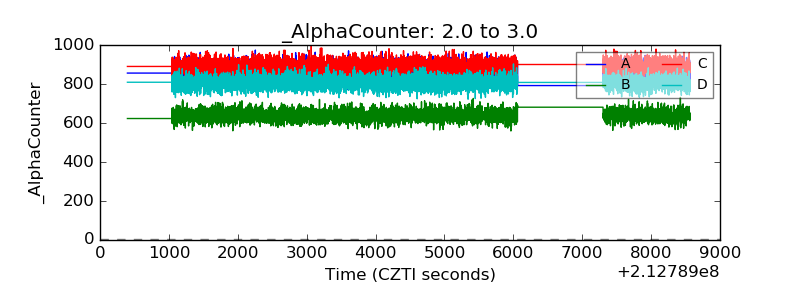 |
| _CPM_Rate | 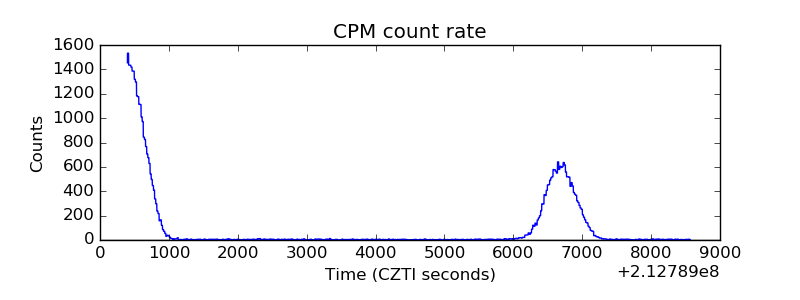 |
| CZT Counter | 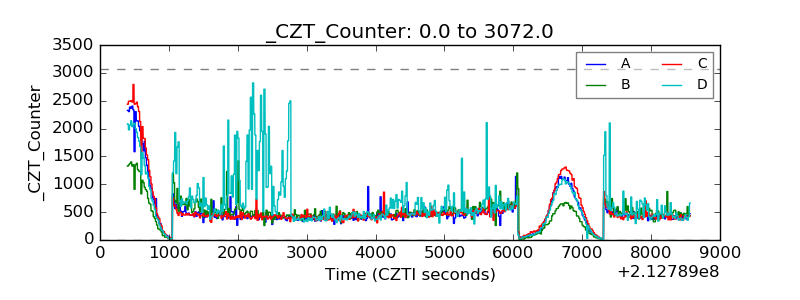 |
| +2.5 Volts monitor |  |
| +5 Volts monitor |  |
| _ROLL_ROT | 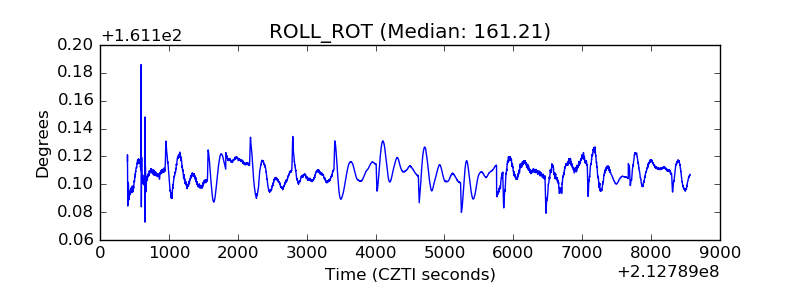 |
| _Roll_DEC | 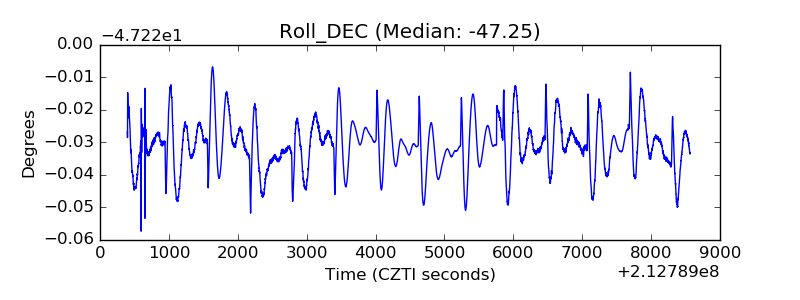 |
| _Roll_RA | 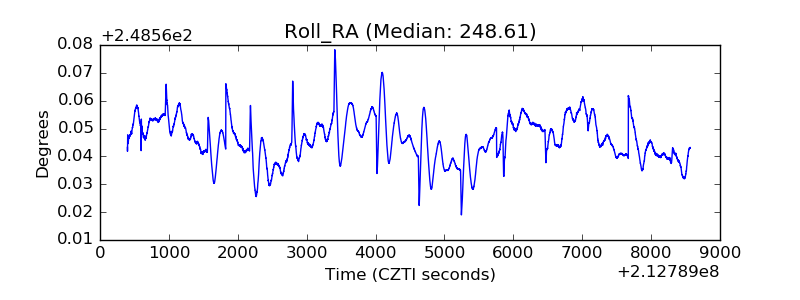 |
| Veto Counter | 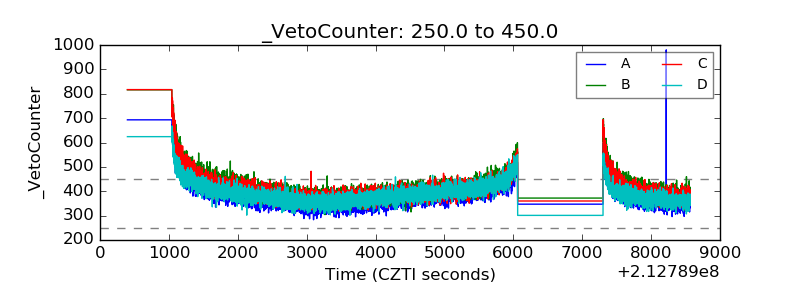 |