| Param | Original file | Final file |
|---|---|---|
| Filename | modeM0/AS1G05_132T01_9000000686_05430cztM0_level2.evt | modeM0/AS1G05_132T01_9000000686_05430cztM0_level2_quad_clean.evt |
| Size (bytes) | 441,872,640 | 66,715,200 |
| Size | 421.4 MB | 63.6 MB |
| Events in quadrant A | 3,040,482 | 389,505 |
| Events in quadrant B | 3,294,014 | 390,996 |
| Events in quadrant C | 2,973,693 | 394,878 |
| Events in quadrant D | 3,615,072 | 374,063 |
| Mode M9 | |||
|---|---|---|---|
| Quadrant | BADHDUFLAG | Total packets | Discarded packets |
| A | 0 | 19 | 0 |
| B | 0 | 19 | 0 |
| C | 0 | 19 | 0 |
| D | 0 | 20 | 0 |
| Mode SS | |||
|---|---|---|---|
| Quadrant | BADHDUFLAG | Total packets | Discarded packets |
| A | 0 | 136 | 0 |
| B | 0 | 136 | 0 |
| C | 0 | 136 | 0 |
| D | 0 | 136 | 0 |
| Mode M0 | |||
|---|---|---|---|
| Quadrant | BADHDUFLAG | Total packets | Discarded packets |
| A | 0 | 13869 | 3 |
| B | 0 | 14304 | 2 |
| C | 0 | 13807 | 2 |
| D | 0 | 15527 | 2 |
| Quadrant | Total seconds | Saturated seconds | Saturation percentage |
|---|---|---|---|
| A | 6751 | 38 | 0.562880% |
| B | 6751 | 56 | 0.829507% |
| C | 6751 | 23 | 0.340690% |
| D | 6751 | 119 | 1.762702% |
Noise dominated data is calculated using 1-second bins in cleaned event files. If a bin has >2000 counts, and if more than 50% of those come from <1% of pixels, then it is considered to be noise-dominated and hence unusable.
| Quadrant | # 1 sec bins | Bins with >0 counts | Bins with >2000 counts | High rate bins dominated by noise | Noise dominated (total time) | Noise dominated (detector-on time) | Marked lightcurve |
|---|---|---|---|---|---|---|---|
| A | 7641 | 6752 | 8 | 8 | 0.10% | 0.12% | 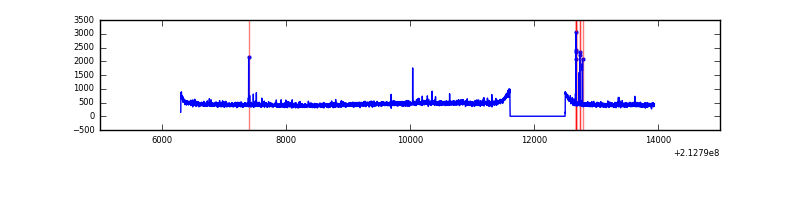 |
| B | 7641 | 6752 | 14 | 14 | 0.18% | 0.21% | 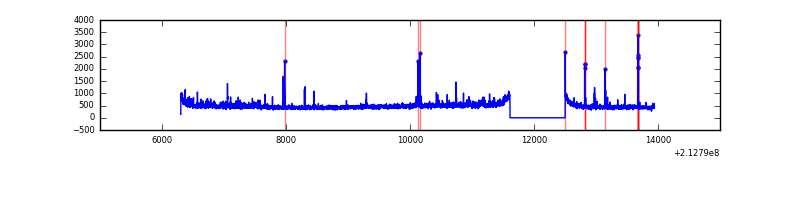 |
| C | 7641 | 6752 | 0 | 0 | 0.00% | 0.00% | 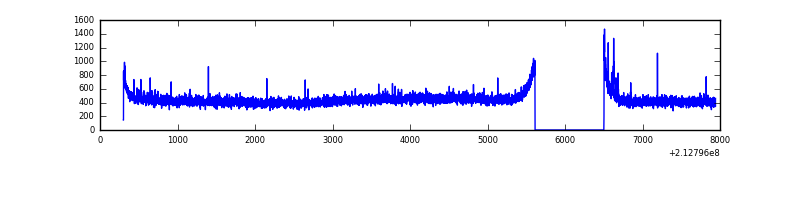 |
| D | 7641 | 6752 | 57 | 57 | 0.75% | 0.84% | 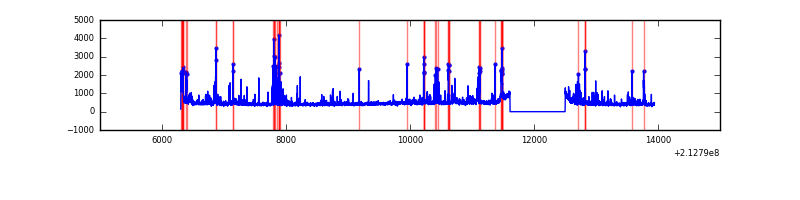 |
Top three noisy pixels from each quadrant. If the there are fewer than three noisy pixels in the level2.evt file, extra rows are filled as -1
| Pixel properties | Quadrant properties | ||||||
|---|---|---|---|---|---|---|---|
| Quadrant | DetID | PixID | Counts | Sigma | Mean | Median | Sigma |
| A | 15 | 174 | 34905 | 216.38 | 775 | 758 | 157.8 |
| A | 0 | 50 | 18953 | 115.3 | 775 | 758 | 157.8 |
| A | 12 | 194 | 7711 | 44.06 | 775 | 758 | 157.8 |
| B | 15 | 204 | 115178 | 764.01 | 786 | 766 | 149.8 |
| B | 4 | 48 | 64313 | 424.34 | 786 | 766 | 149.8 |
| B | 15 | 54 | 19313 | 123.85 | 786 | 766 | 149.8 |
| C | 9 | 247 | 14530 | 78.88 | 753 | 756 | 174.6 |
| C | 14 | 67 | 10535 | 56.0 | 753 | 756 | 174.6 |
| C | 12 | 4 | 9011 | 47.27 | 753 | 756 | 174.6 |
| D | 2 | 33 | 265751 | 1438.29 | 745 | 723 | 184.3 |
| D | 11 | 192 | 112259 | 605.3 | 745 | 723 | 184.3 |
| D | 2 | 152 | 98177 | 528.88 | 745 | 723 | 184.3 |
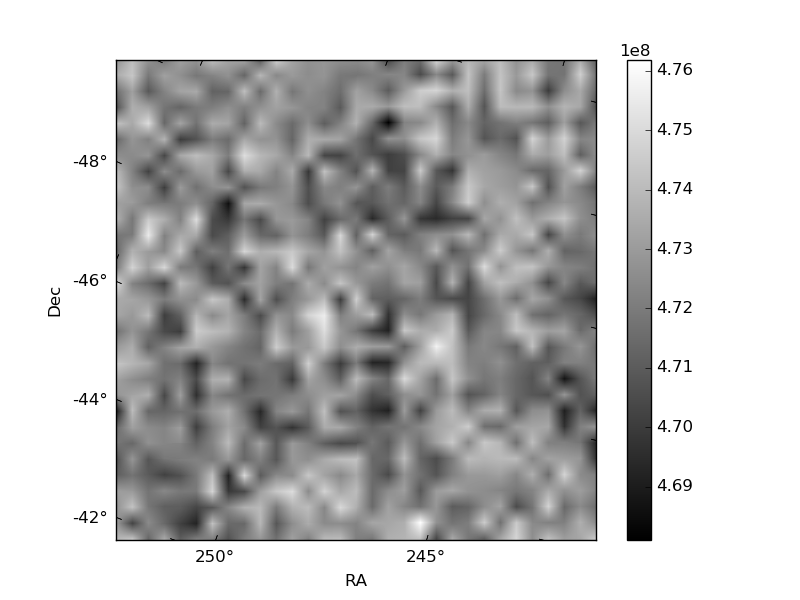
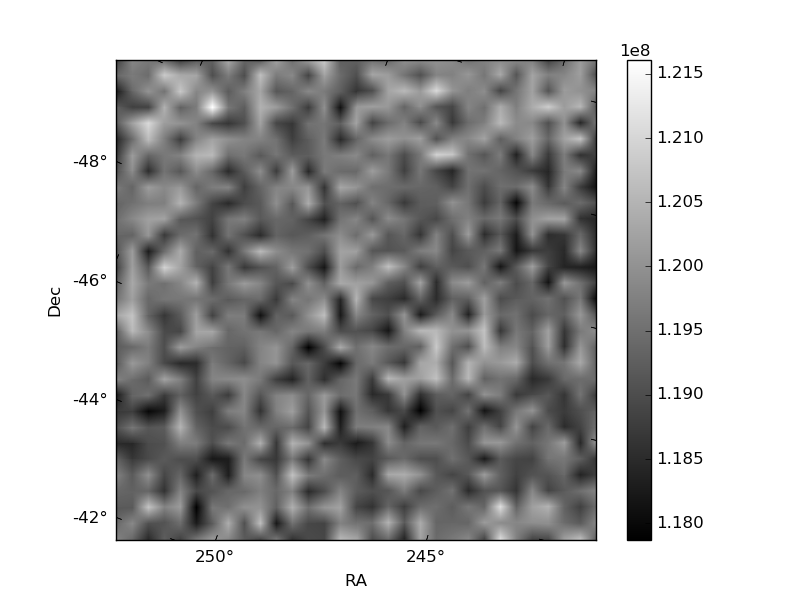
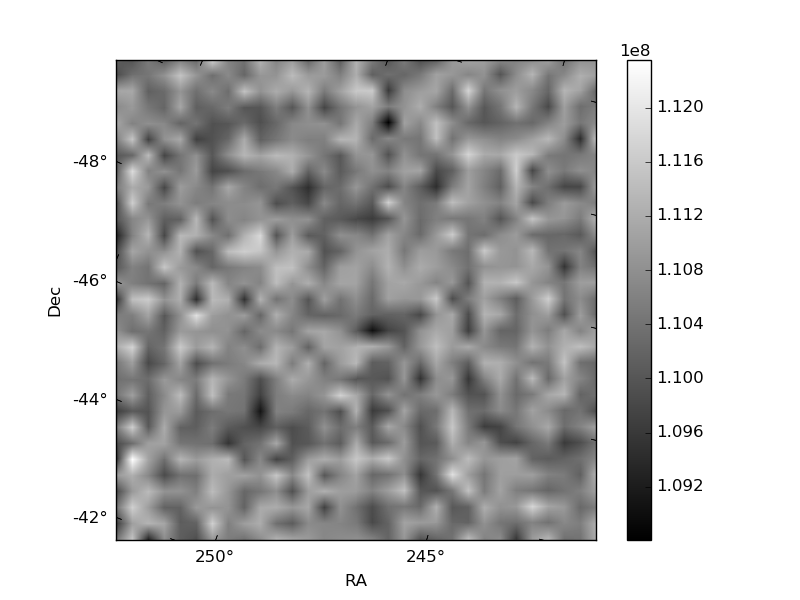
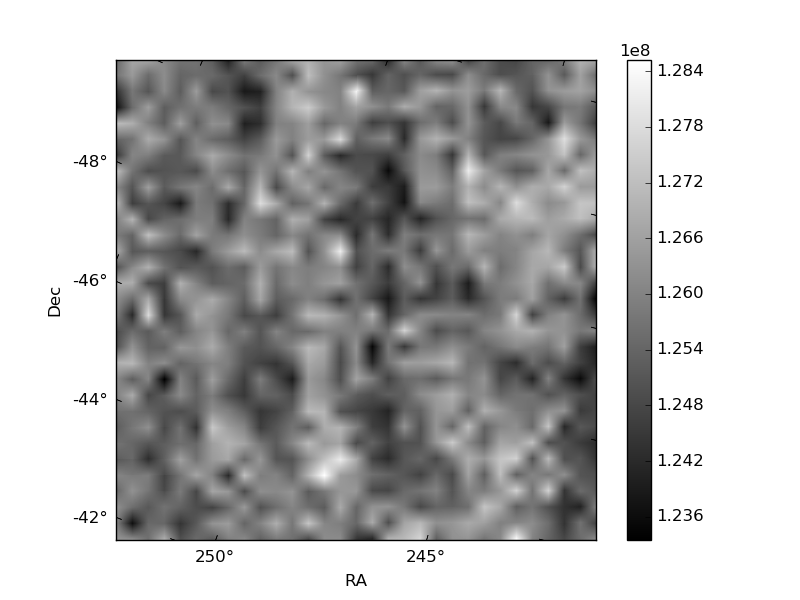
Histogram calculated using DETX and DETY for each event in the final _common_clean file
| Quadrant A | 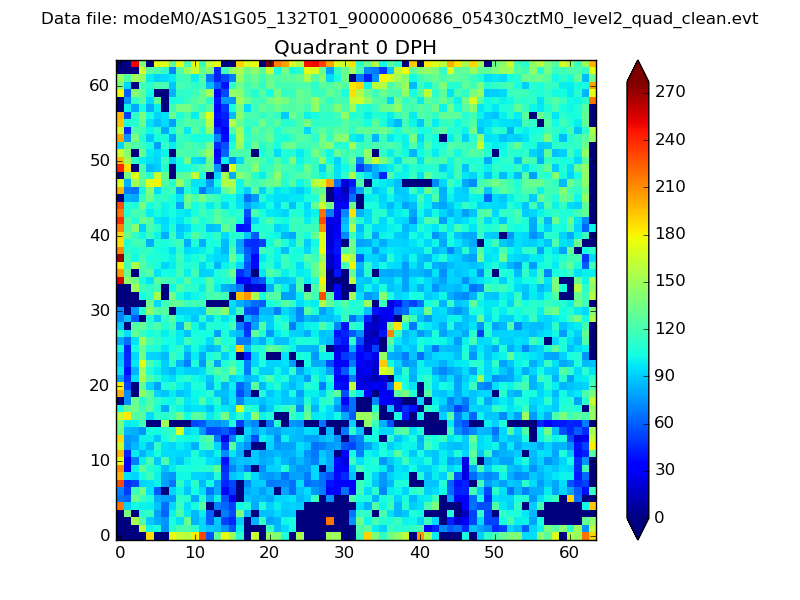 |
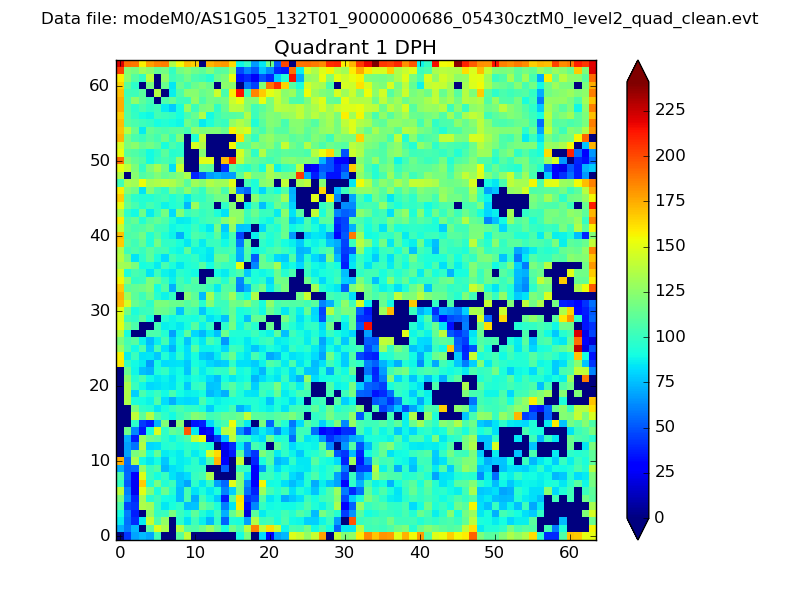 |
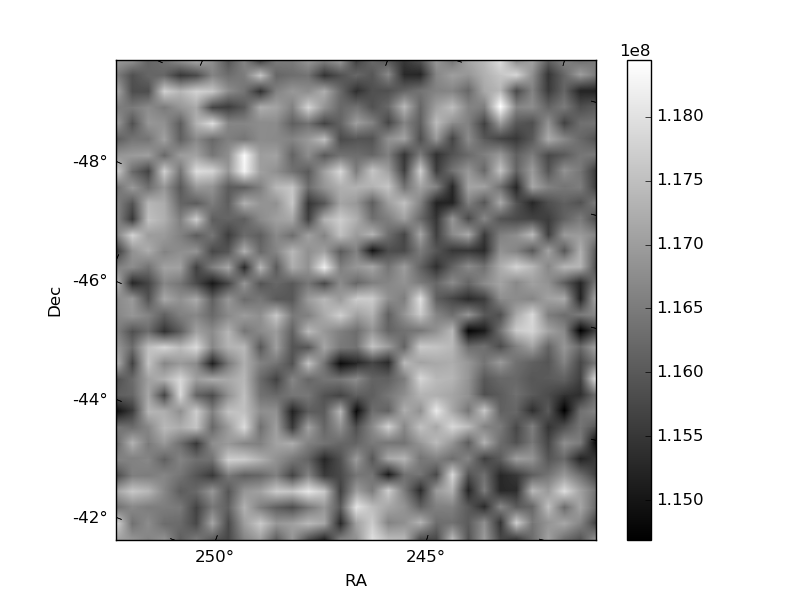
Quadrant B |
|---|---|---|---|
| Quadrant D | 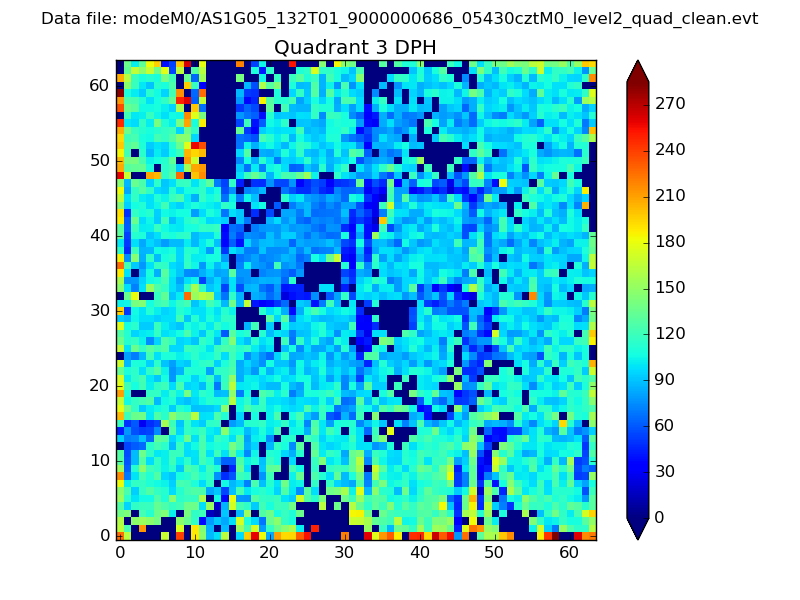 |
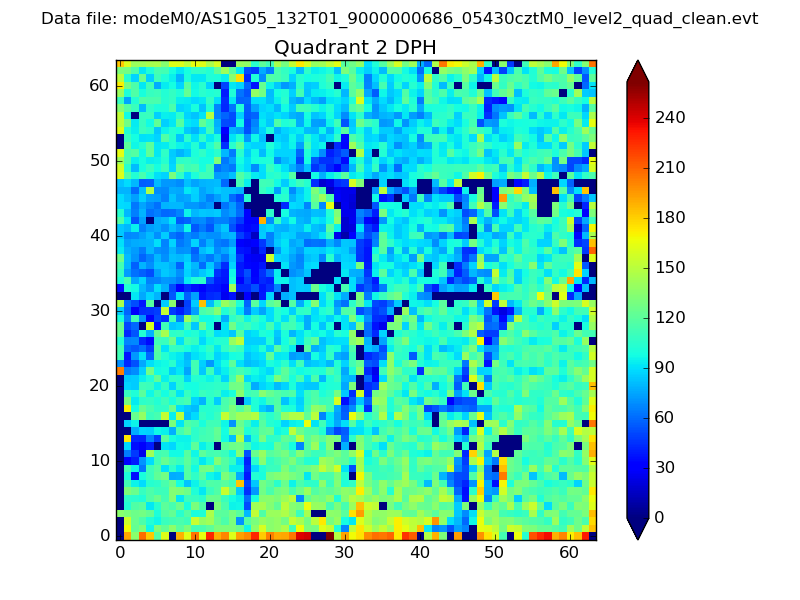 |
Quadrant C |
| Plot type | Count rate plots | Images |
|---|---|---|
| Comparison with Poisson distribution Blue bars denote a histogram of data divided into 1 sec bins. Red curve is a Poisson curve with rate = median count rate of data. |
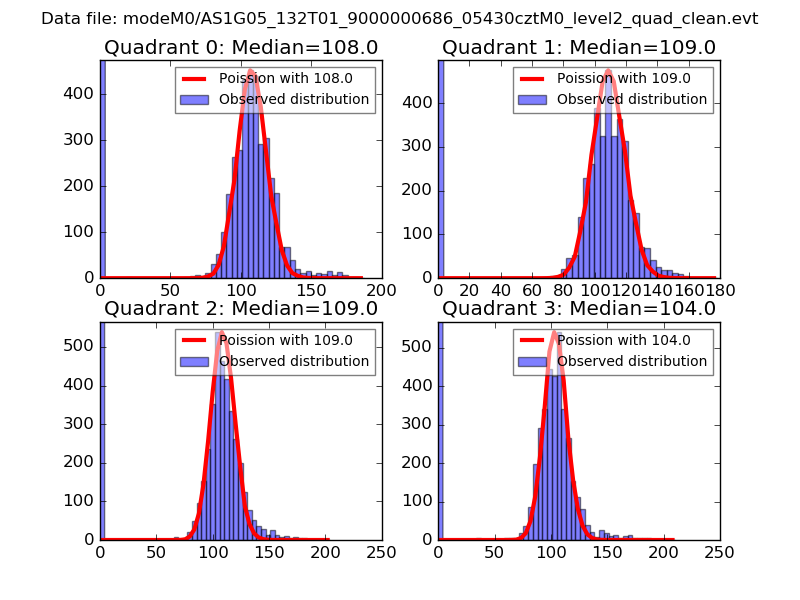 |
 |
| Quadrant-wise count rates Data is divided into 100 sec bins |
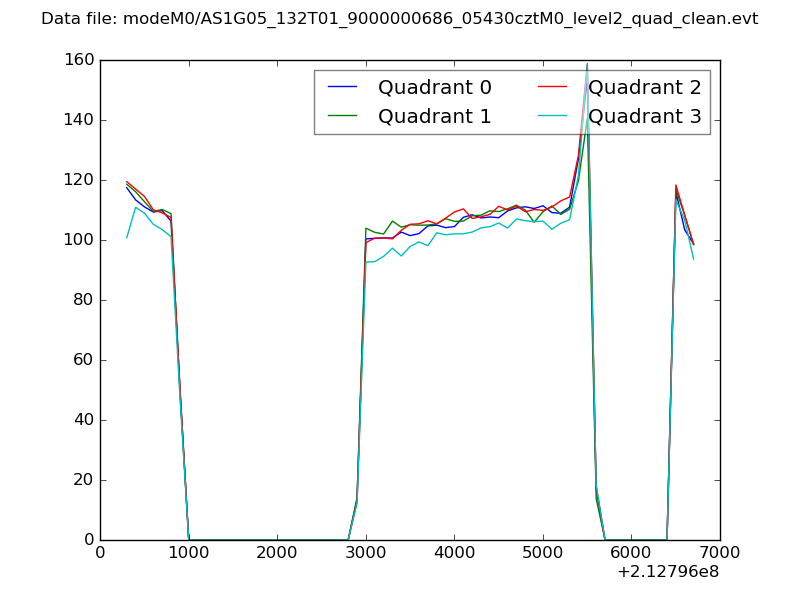 |
|
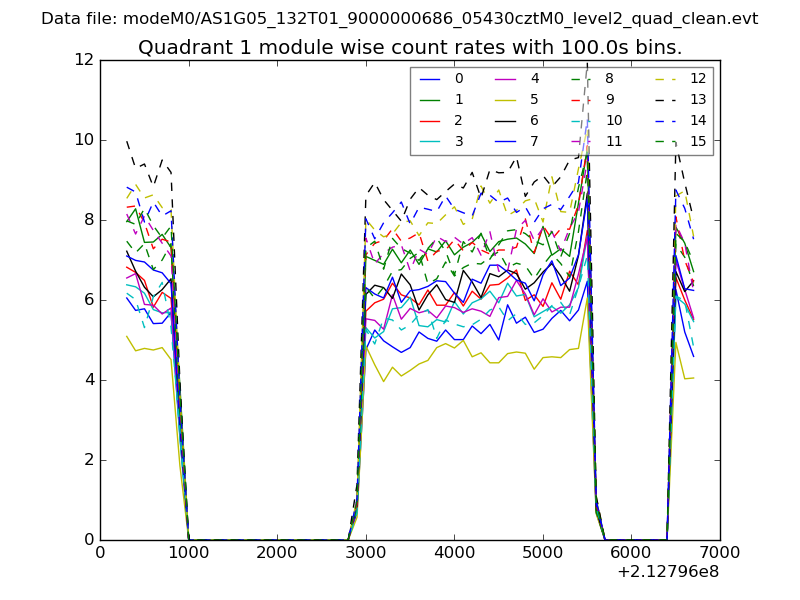
| Module-wise count rates for Quadrant A Data is divided into 100 sec bins |
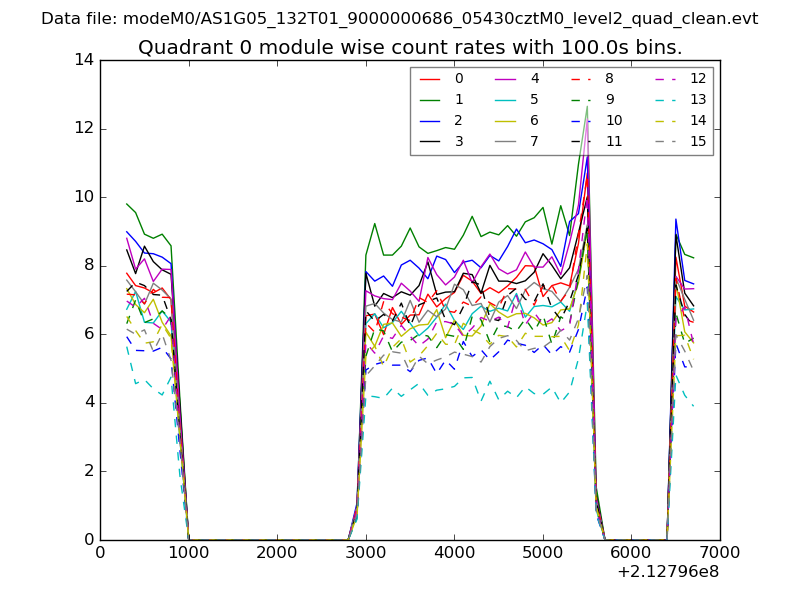 |
 |
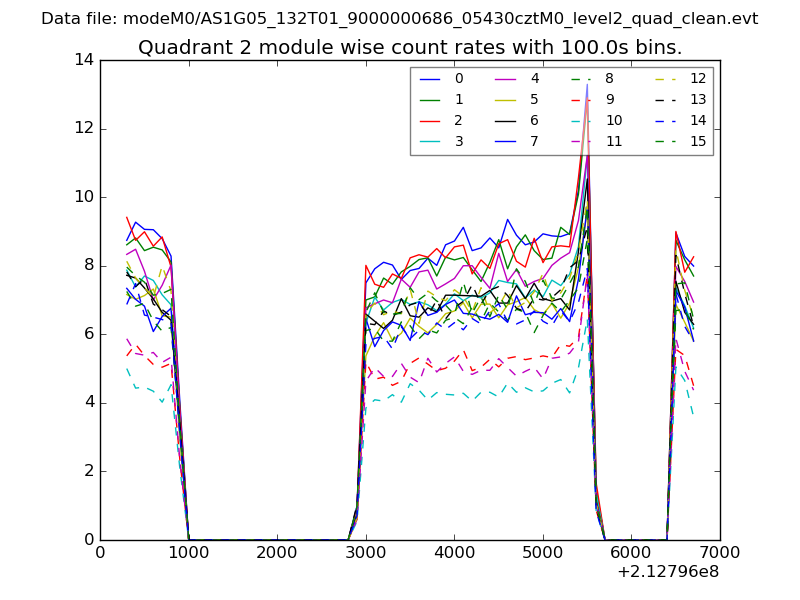
| Module-wise count rates for Quadrant B Data is divided into 100 sec bins |
 |
 |
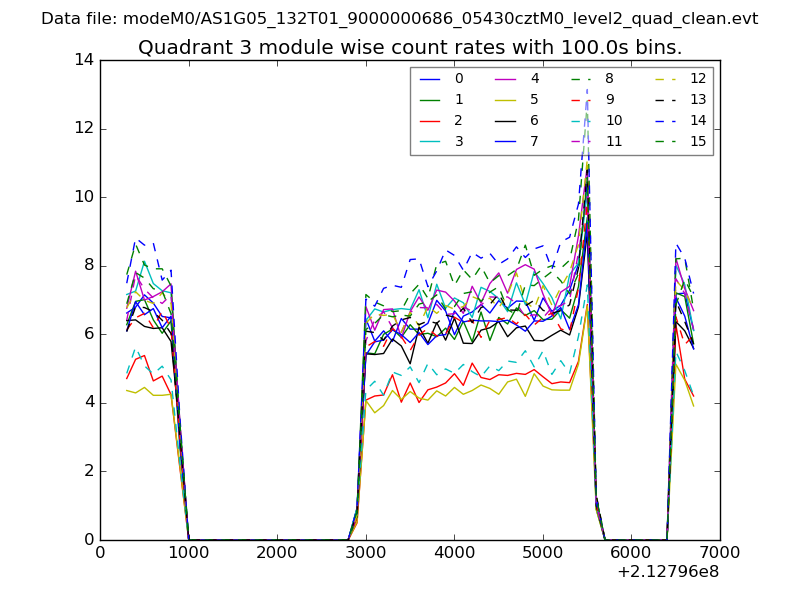
| Module-wise count rates for Quadrant C Data is divided into 100 sec bins |
 |
 |
| Module-wise count rates for Quadrant D Data is divided into 100 sec bins |
 |
 |
| Parameter | Plot |
|---|---|
| CZT HV Monitor | 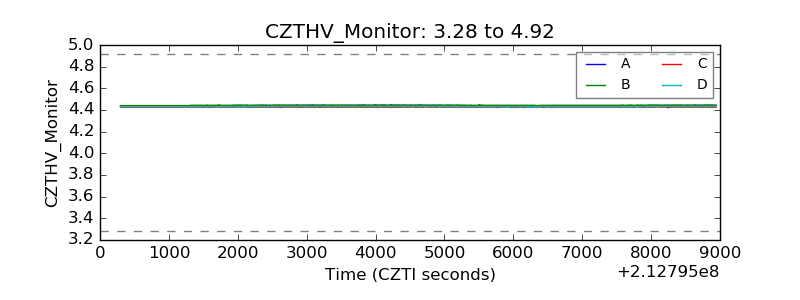 |
| D_VDD | 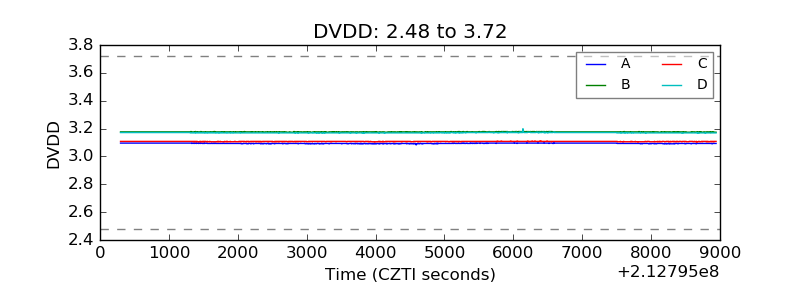 |
| Temperature 1 | 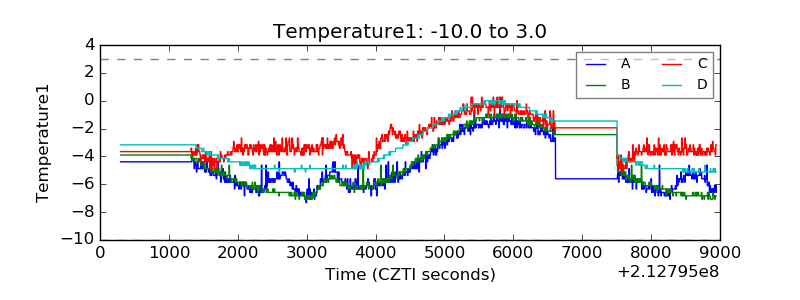 |
| Veto HV Monitor | 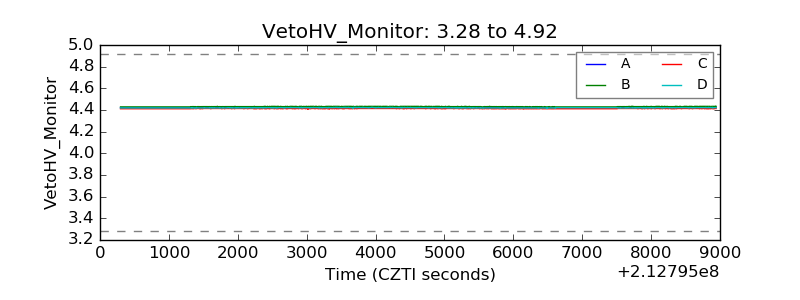 |
| Veto LLD | 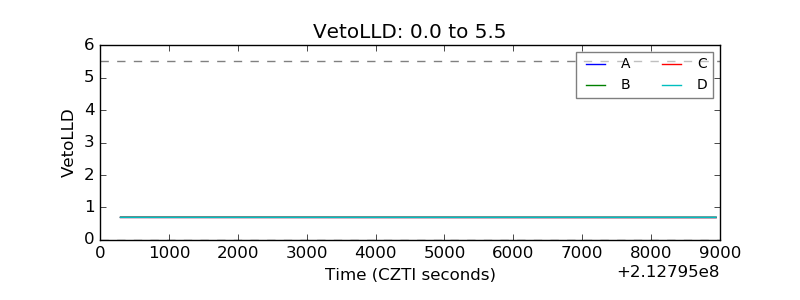 |
| Alpha Counter | 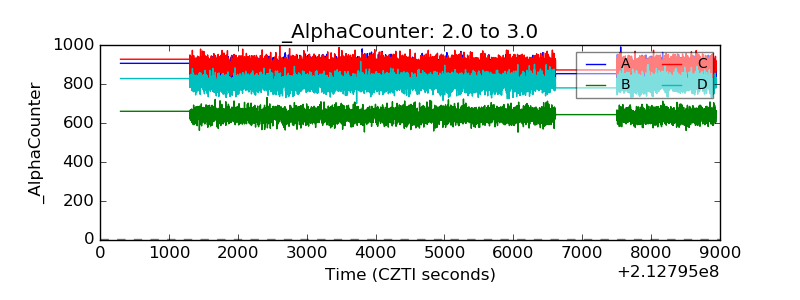 |
| _CPM_Rate | 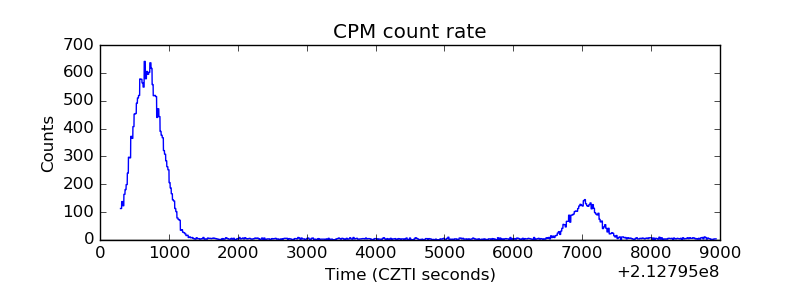 |
| CZT Counter | 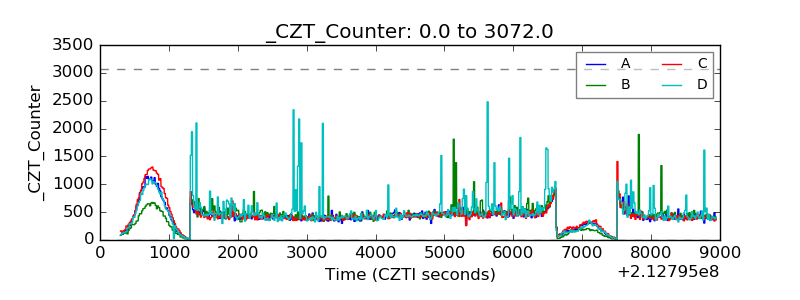 |
| +2.5 Volts monitor | 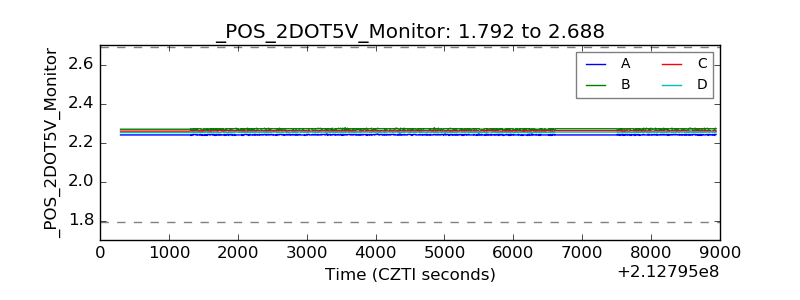 |
| +5 Volts monitor |  |
| _ROLL_ROT | 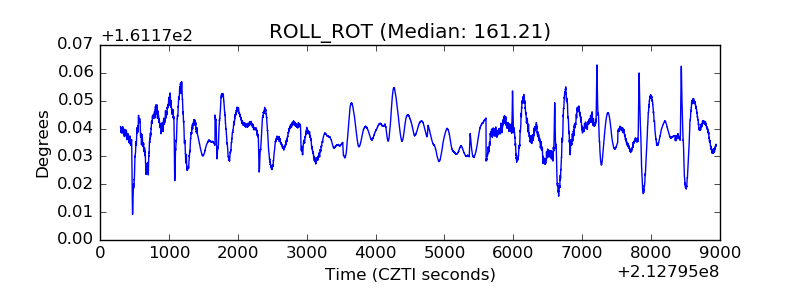 |
| _Roll_DEC | 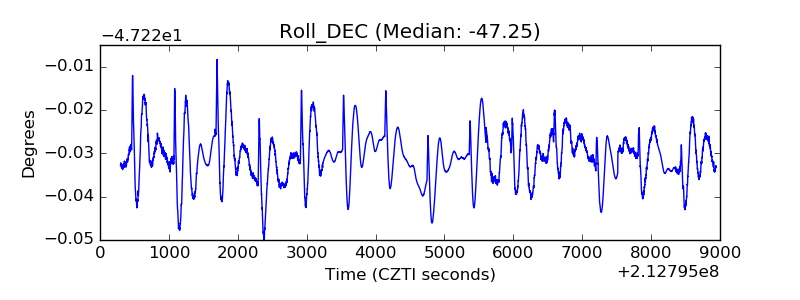 |
| _Roll_RA | 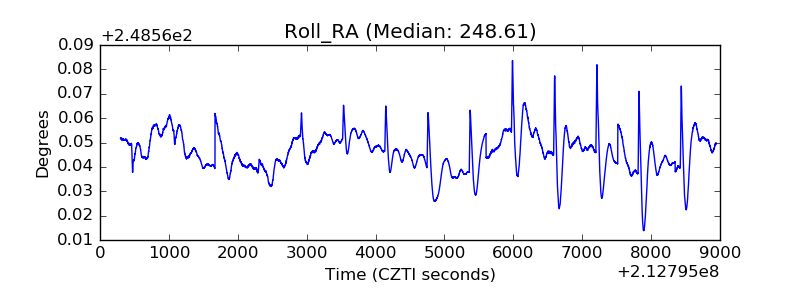 |
| Veto Counter | 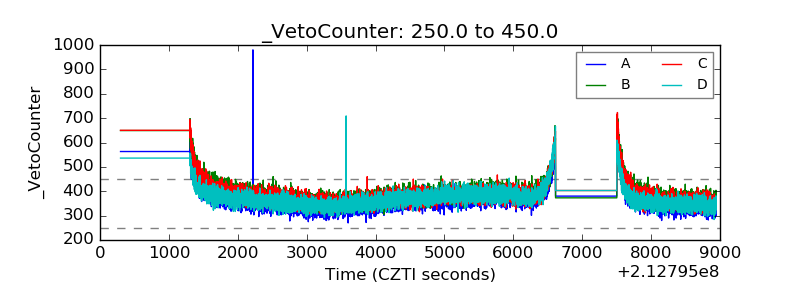 |