| Param | Original file | Final file |
|---|---|---|
| Filename | modeM0/AS1G05_132T01_9000000686_05431cztM0_level2.evt | modeM0/AS1G05_132T01_9000000686_05431cztM0_level2_quad_clean.evt |
| Size (bytes) | 518,158,080 | 74,537,280 |
| Size | 494.2 MB | 71.1 MB |
| Events in quadrant A | 3,501,406 | 436,689 |
| Events in quadrant B | 3,885,236 | 433,170 |
| Events in quadrant C | 3,435,566 | 442,778 |
| Events in quadrant D | 4,354,357 | 415,906 |
| Mode M9 | |||
|---|---|---|---|
| Quadrant | BADHDUFLAG | Total packets | Discarded packets |
| A | 0 | 13 | 0 |
| B | 0 | 13 | 0 |
| C | 0 | 13 | 0 |
| D | 0 | 13 | 0 |
| Mode SS | |||
|---|---|---|---|
| Quadrant | BADHDUFLAG | Total packets | Discarded packets |
| A | 0 | 156 | 0 |
| B | 0 | 156 | 0 |
| C | 0 | 156 | 0 |
| D | 0 | 156 | 0 |
| Mode M0 | |||
|---|---|---|---|
| Quadrant | BADHDUFLAG | Total packets | Discarded packets |
| A | 0 | 15865 | 3 |
| B | 0 | 16733 | 2 |
| C | 0 | 15854 | 2 |
| D | 0 | 18462 | 2 |
| Quadrant | Total seconds | Saturated seconds | Saturation percentage |
|---|---|---|---|
| A | 7593 | 113 | 1.488213% |
| B | 7593 | 167 | 2.199394% |
| C | 7593 | 115 | 1.514553% |
| D | 7593 | 287 | 3.779797% |
Noise dominated data is calculated using 1-second bins in cleaned event files. If a bin has >2000 counts, and if more than 50% of those come from <1% of pixels, then it is considered to be noise-dominated and hence unusable.
| Quadrant | # 1 sec bins | Bins with >0 counts | Bins with >2000 counts | High rate bins dominated by noise | Noise dominated (total time) | Noise dominated (detector-on time) | Marked lightcurve |
|---|---|---|---|---|---|---|---|
| A | 8868 | 7595 | 7 | 7 | 0.08% | 0.09% |  |
| B | 8868 | 7595 | 14 | 14 | 0.16% | 0.18% | 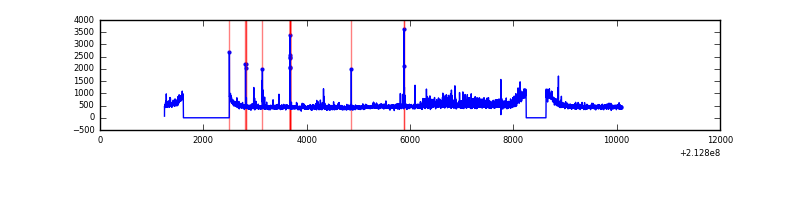 |
| C | 8868 | 7595 | 0 | 0 | 0.00% | 0.00% | 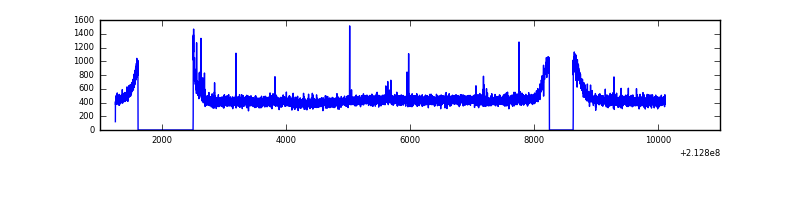 |
| D | 8868 | 7595 | 110 | 110 | 1.24% | 1.45% | 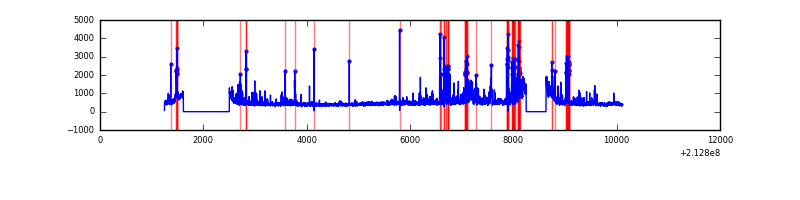 |
Top three noisy pixels from each quadrant. If the there are fewer than three noisy pixels in the level2.evt file, extra rows are filled as -1
| Pixel properties | Quadrant properties | ||||||
|---|---|---|---|---|---|---|---|
| Quadrant | DetID | PixID | Counts | Sigma | Mean | Median | Sigma |
| A | 15 | 174 | 41255 | 218.64 | 894 | 873 | 184.7 |
| A | 0 | 226 | 9192 | 45.04 | 894 | 873 | 184.7 |
| A | 0 | 50 | 9021 | 44.12 | 894 | 873 | 184.7 |
| B | 15 | 204 | 234985 | 1346.96 | 903 | 880 | 173.8 |
| B | 4 | 48 | 71966 | 409.0 | 903 | 880 | 173.8 |
| B | 0 | 219 | 29415 | 164.18 | 903 | 880 | 173.8 |
| C | 9 | 247 | 21799 | 103.04 | 869 | 872 | 203.1 |
| C | 13 | 61 | 7122 | 30.77 | 869 | 872 | 203.1 |
| C | 12 | 4 | 5733 | 23.93 | 869 | 872 | 203.1 |
| D | 2 | 33 | 355661 | 1690.99 | 855 | 830 | 209.8 |
| D | 2 | 152 | 300041 | 1425.93 | 855 | 830 | 209.8 |
| D | 7 | 203 | 162709 | 771.45 | 855 | 830 | 209.8 |
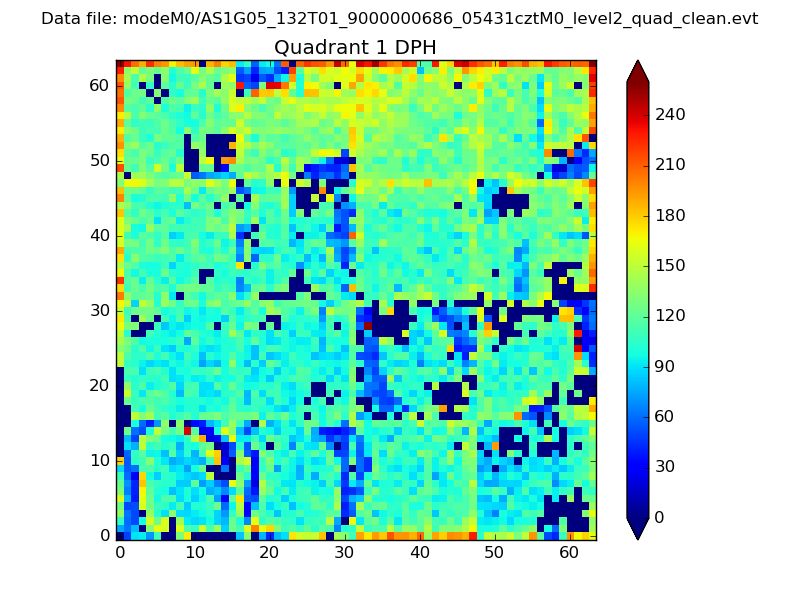
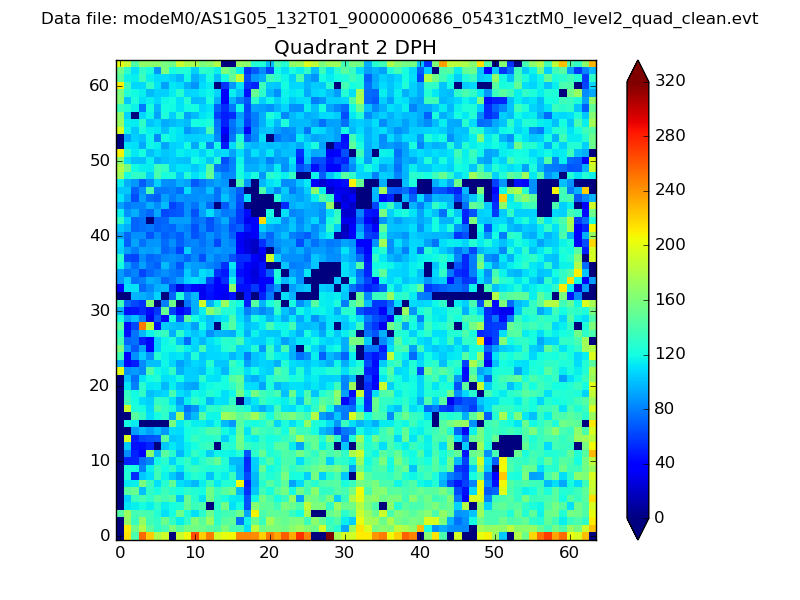
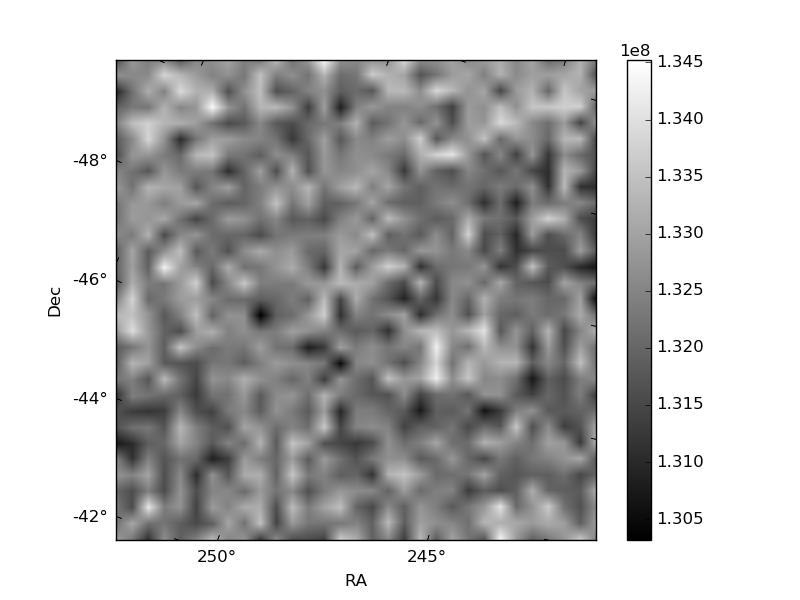
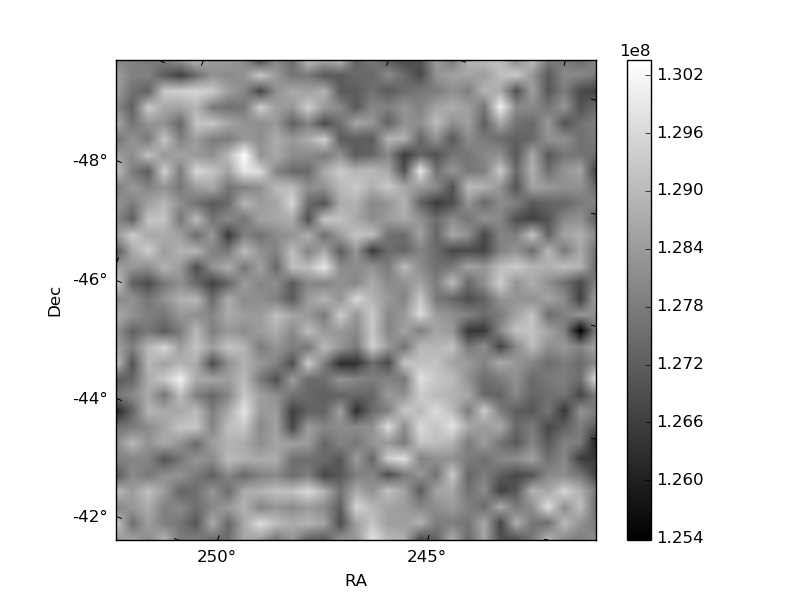
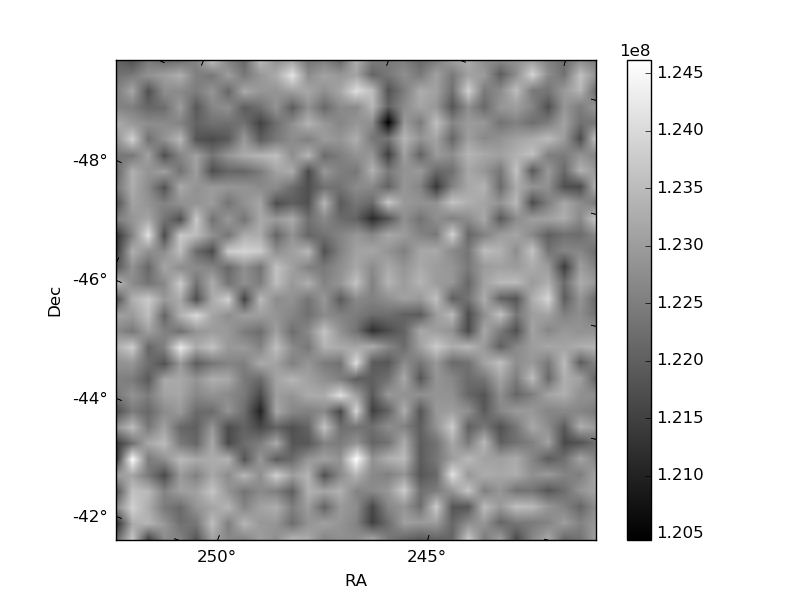
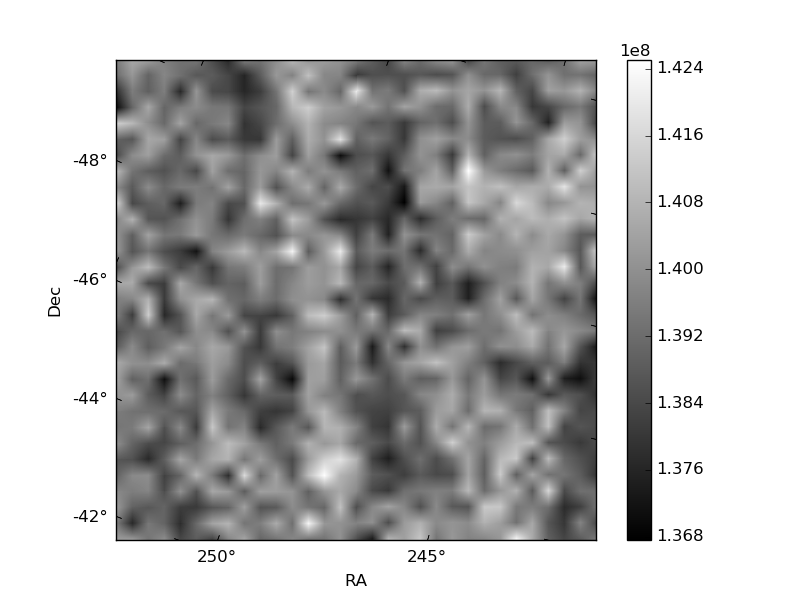
Histogram calculated using DETX and DETY for each event in the final _common_clean file
| Quadrant A |  |
 |
Quadrant B |
|---|---|---|---|
| Quadrant D | 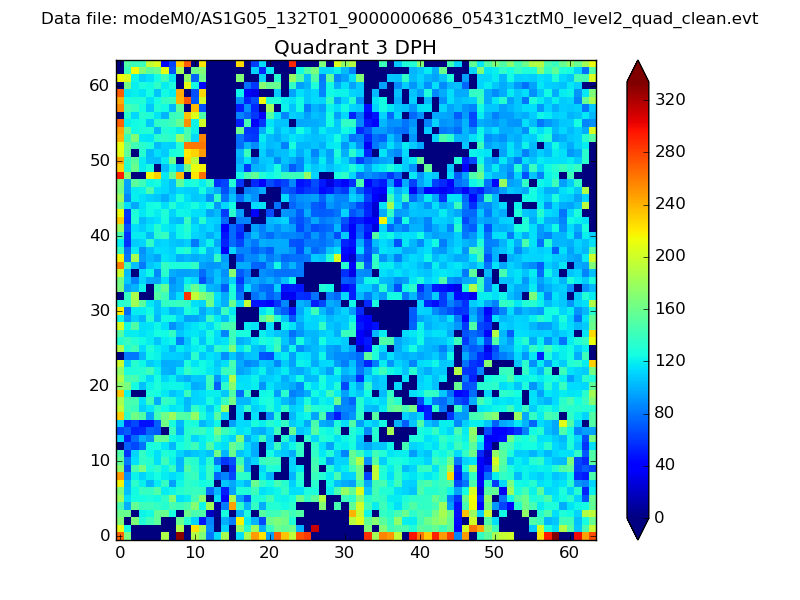 |
 |
Quadrant C |
| Plot type | Count rate plots | Images |
|---|---|---|
| Comparison with Poisson distribution Blue bars denote a histogram of data divided into 1 sec bins. Red curve is a Poisson curve with rate = median count rate of data. |
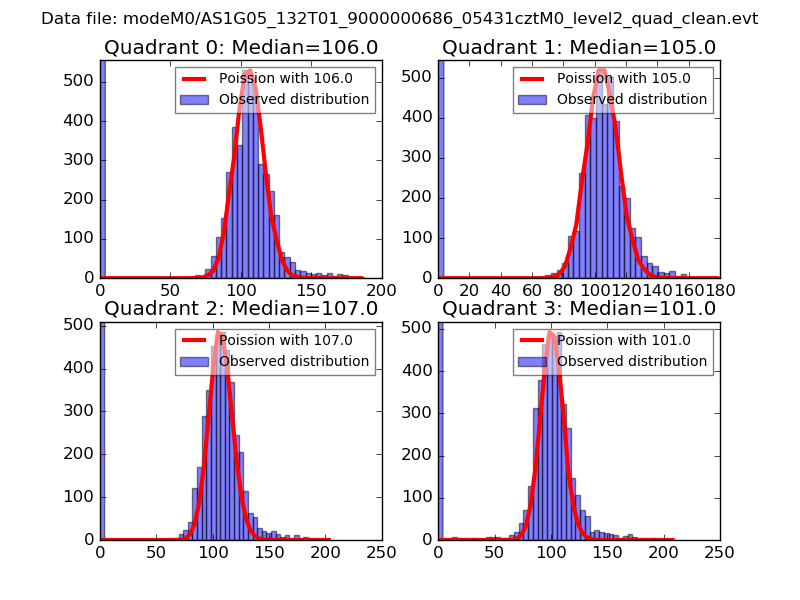 |
 |
| Quadrant-wise count rates Data is divided into 100 sec bins |
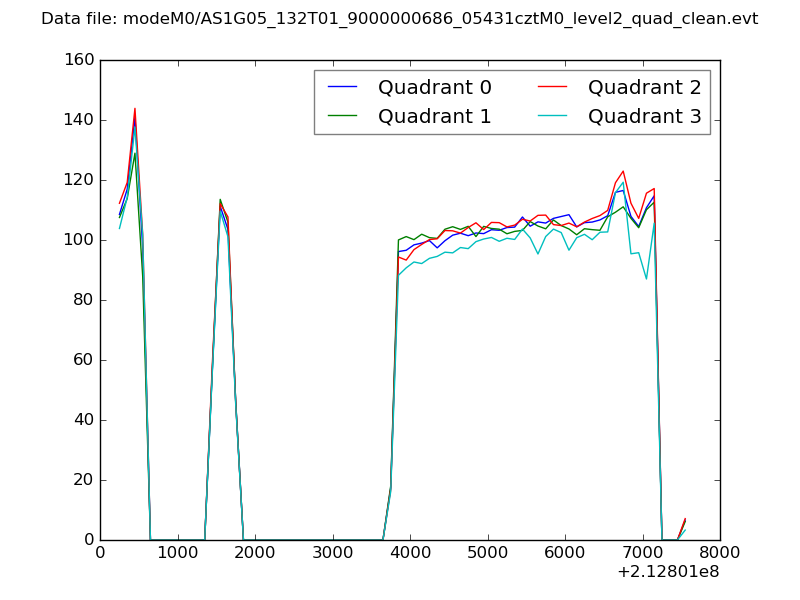 |
|
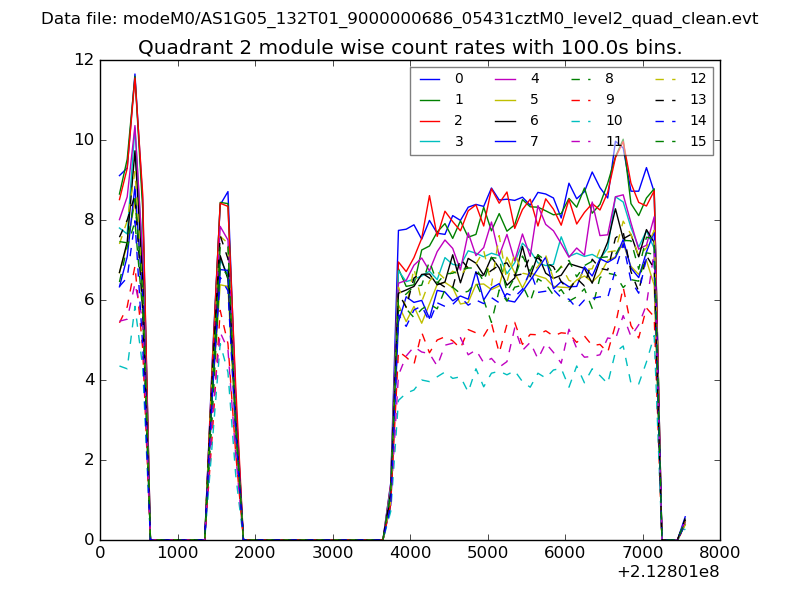
| Module-wise count rates for Quadrant A Data is divided into 100 sec bins |
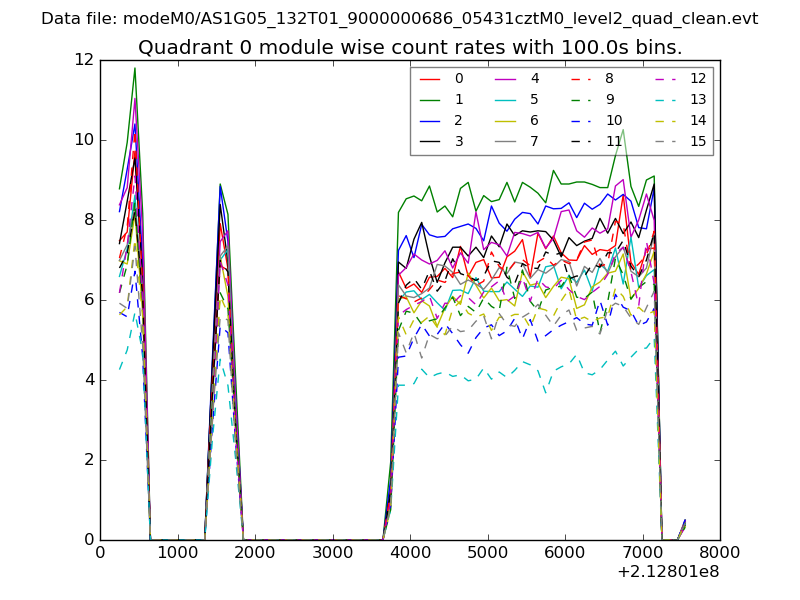 |
 |
| Module-wise count rates for Quadrant B Data is divided into 100 sec bins |
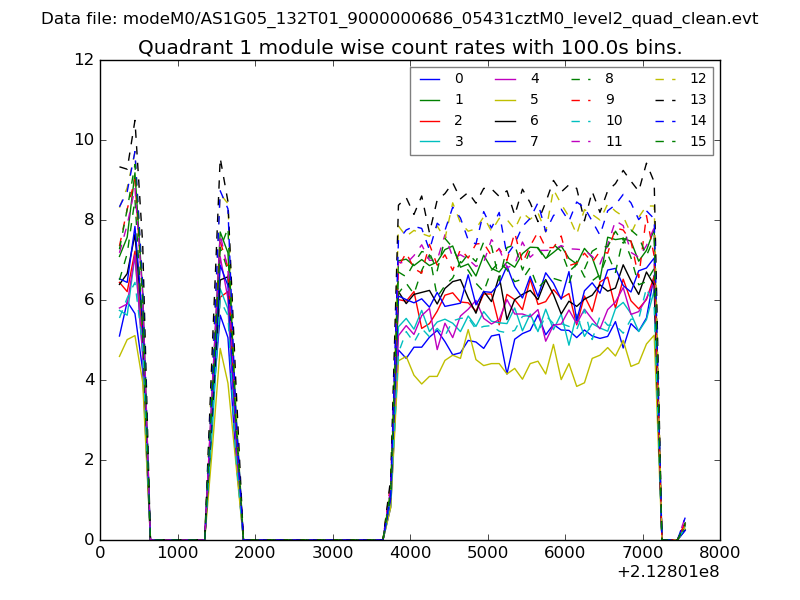 |
 |
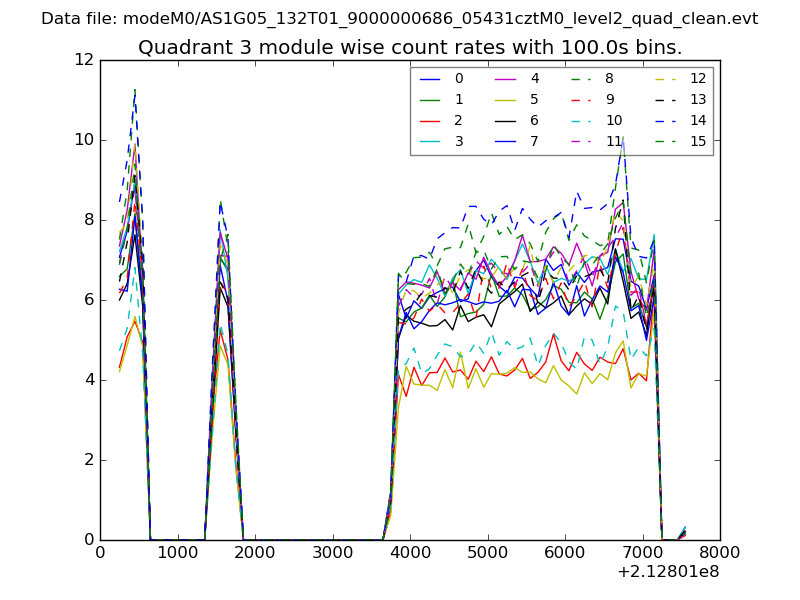
| Module-wise count rates for Quadrant C Data is divided into 100 sec bins |
 |
 |
| Module-wise count rates for Quadrant D Data is divided into 100 sec bins |
 |
 |
| Parameter | Plot |
|---|---|
| CZT HV Monitor | 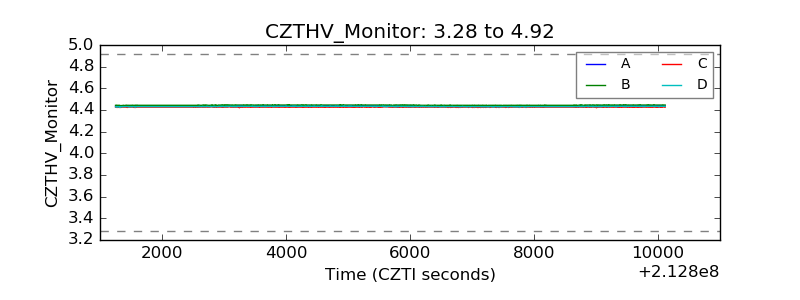 |
| D_VDD | 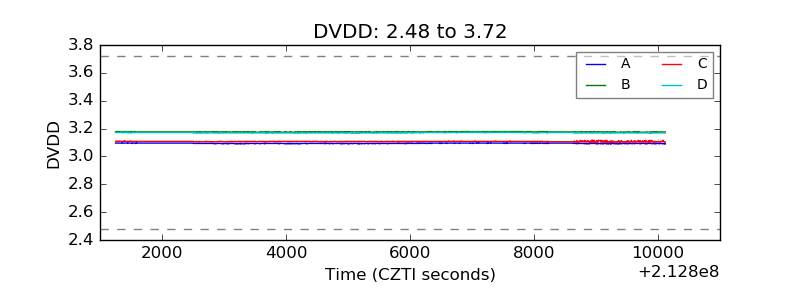 |
| Temperature 1 | 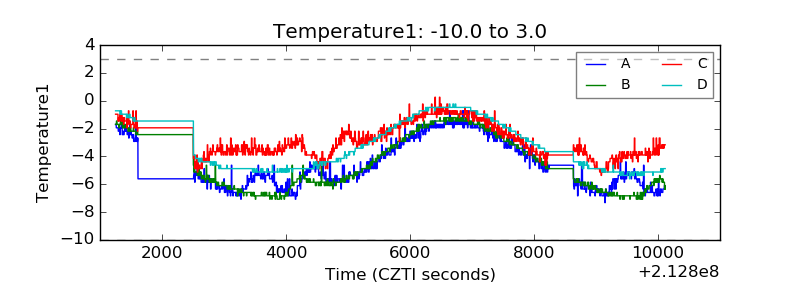 |
| Veto HV Monitor | 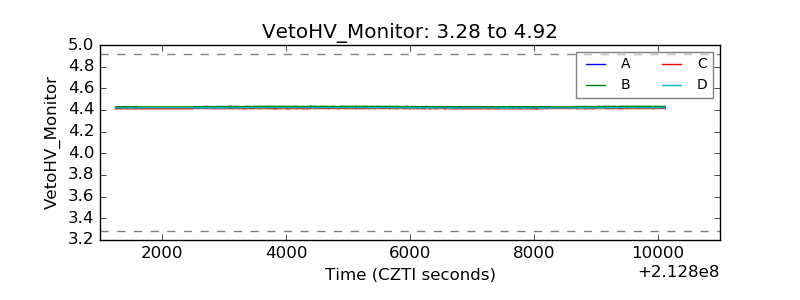 |
| Veto LLD |  |
| Alpha Counter | 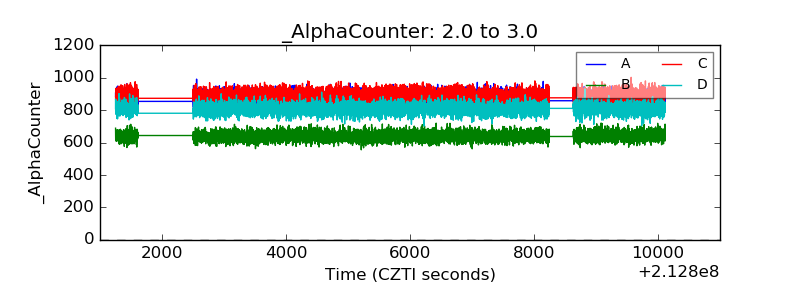 |
| _CPM_Rate | 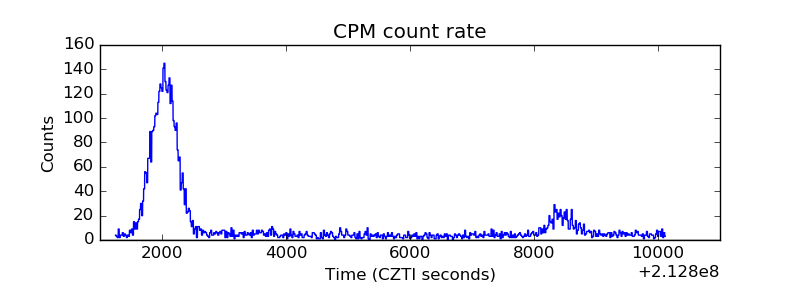 |
| CZT Counter | 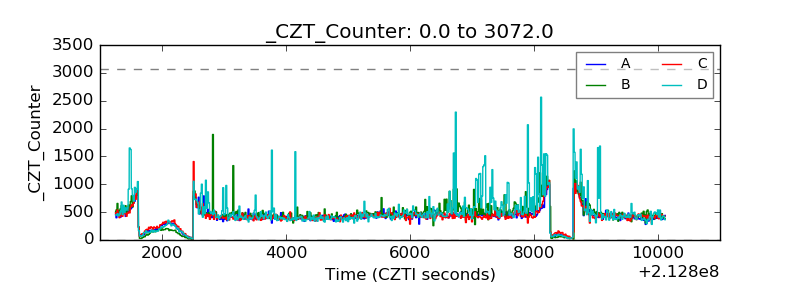 |
| +2.5 Volts monitor |  |
| +5 Volts monitor |  |
| _ROLL_ROT | 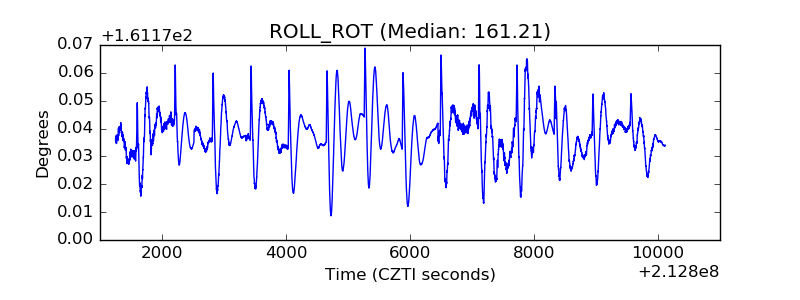 |
| _Roll_DEC | 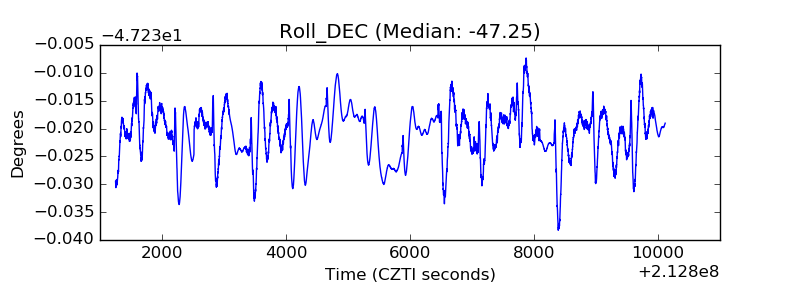 |
| _Roll_RA | 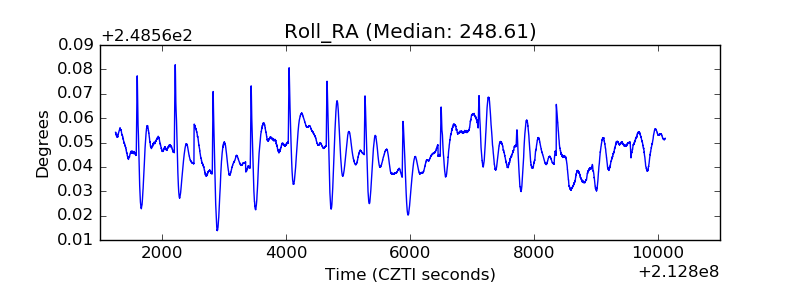 |
| Veto Counter | 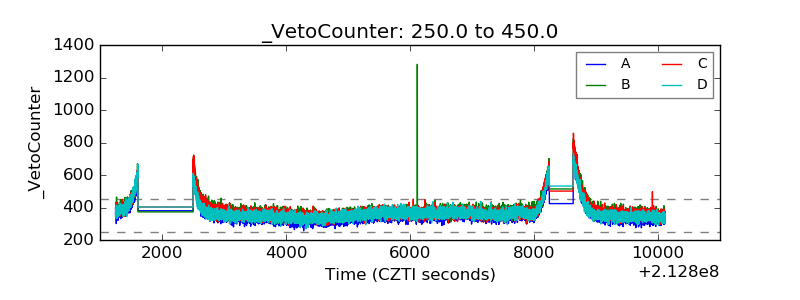 |