| Param | Original file | Final file |
|---|---|---|
| Filename | modeM0/AS1G05_132T01_9000000686_05432cztM0_level2.evt | modeM0/AS1G05_132T01_9000000686_05432cztM0_level2_quad_clean.evt |
| Size (bytes) | 535,348,800 | 71,153,280 |
| Size | 510.5 MB | 67.9 MB |
| Events in quadrant A | 3,675,956 | 402,226 |
| Events in quadrant B | 3,995,539 | 403,238 |
| Events in quadrant C | 3,659,924 | 405,770 |
| Events in quadrant D | 4,335,738 | 384,554 |
| Mode M9 | |||
|---|---|---|---|
| Quadrant | BADHDUFLAG | Total packets | Discarded packets |
| A | 0 | 3 | 0 |
| B | 0 | 3 | 0 |
| C | 0 | 3 | 0 |
| D | 0 | 3 | 0 |
| Mode SS | |||
|---|---|---|---|
| Quadrant | BADHDUFLAG | Total packets | Discarded packets |
| A | 0 | 160 | 0 |
| B | 0 | 160 | 0 |
| C | 0 | 160 | 0 |
| D | 0 | 160 | 0 |
| Mode M0 | |||
|---|---|---|---|
| Quadrant | BADHDUFLAG | Total packets | Discarded packets |
| A | 0 | 16724 | 2 |
| B | 0 | 17300 | 1 |
| C | 0 | 16771 | 1 |
| D | 0 | 18693 | 1 |
| Quadrant | Total seconds | Saturated seconds | Saturation percentage |
|---|---|---|---|
| A | 8038 | 139 | 1.729286% |
| B | 8038 | 222 | 2.761881% |
| C | 8038 | 132 | 1.642200% |
| D | 8038 | 239 | 2.973376% |
Noise dominated data is calculated using 1-second bins in cleaned event files. If a bin has >2000 counts, and if more than 50% of those come from <1% of pixels, then it is considered to be noise-dominated and hence unusable.
| Quadrant | # 1 sec bins | Bins with >0 counts | Bins with >2000 counts | High rate bins dominated by noise | Noise dominated (total time) | Noise dominated (detector-on time) | Marked lightcurve |
|---|---|---|---|---|---|---|---|
| A | 8038 | 8038 | 0 | 0 | 0.00% | 0.00% | 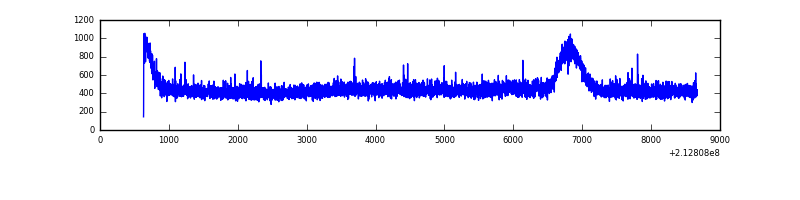 |
| B | 8038 | 8038 | 20 | 20 | 0.25% | 0.25% | 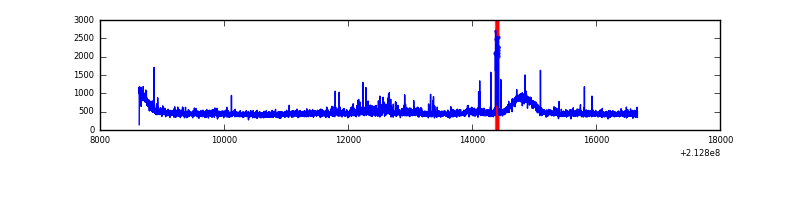 |
| C | 8038 | 8038 | 0 | 0 | 0.00% | 0.00% |  |
| D | 8038 | 8038 | 59 | 59 | 0.73% | 0.73% | 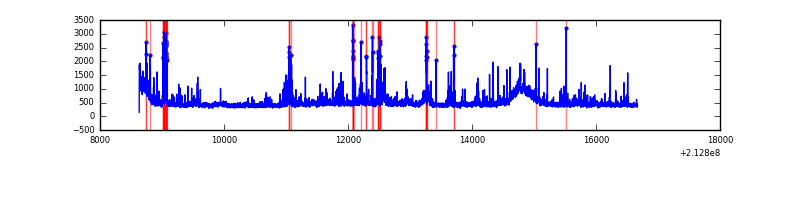 |
Top three noisy pixels from each quadrant. If the there are fewer than three noisy pixels in the level2.evt file, extra rows are filled as -1
| Pixel properties | Quadrant properties | ||||||
|---|---|---|---|---|---|---|---|
| Quadrant | DetID | PixID | Counts | Sigma | Mean | Median | Sigma |
| A | 13 | 251 | 12360 | 58.25 | 947 | 925 | 196.3 |
| A | 0 | 50 | 11193 | 52.31 | 947 | 925 | 196.3 |
| A | 0 | 226 | 9546 | 43.92 | 947 | 925 | 196.3 |
| B | 15 | 204 | 119206 | 637.47 | 959 | 934 | 185.5 |
| B | 4 | 48 | 101920 | 544.3 | 959 | 934 | 185.5 |
| B | 0 | 219 | 28148 | 146.68 | 959 | 934 | 185.5 |
| C | 8 | 128 | 18968 | 83.48 | 926 | 928 | 216.1 |
| C | 8 | 112 | 9943 | 41.72 | 926 | 928 | 216.1 |
| C | 13 | 61 | 7515 | 30.48 | 926 | 928 | 216.1 |
| D | 2 | 33 | 347795 | 1516.48 | 916 | 883 | 228.8 |
| D | 2 | 152 | 163507 | 710.89 | 916 | 883 | 228.8 |
| D | 7 | 203 | 125540 | 544.92 | 916 | 883 | 228.8 |
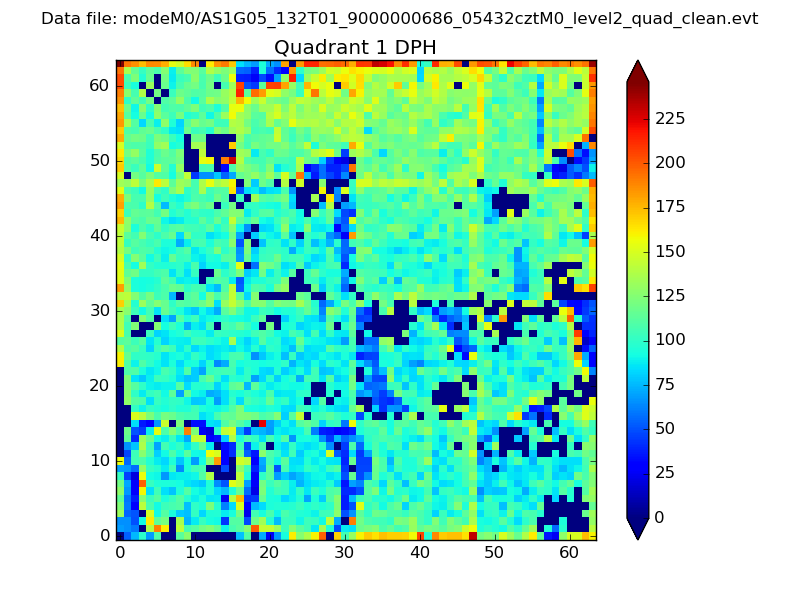
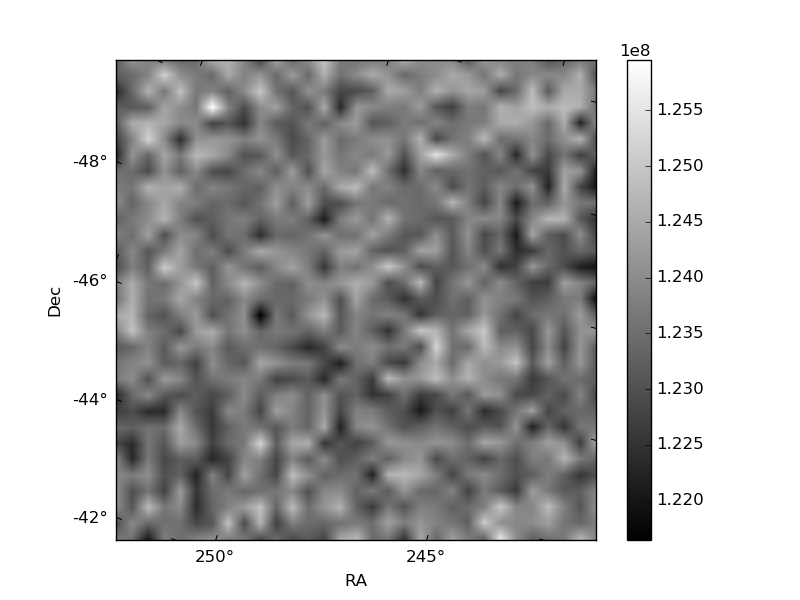
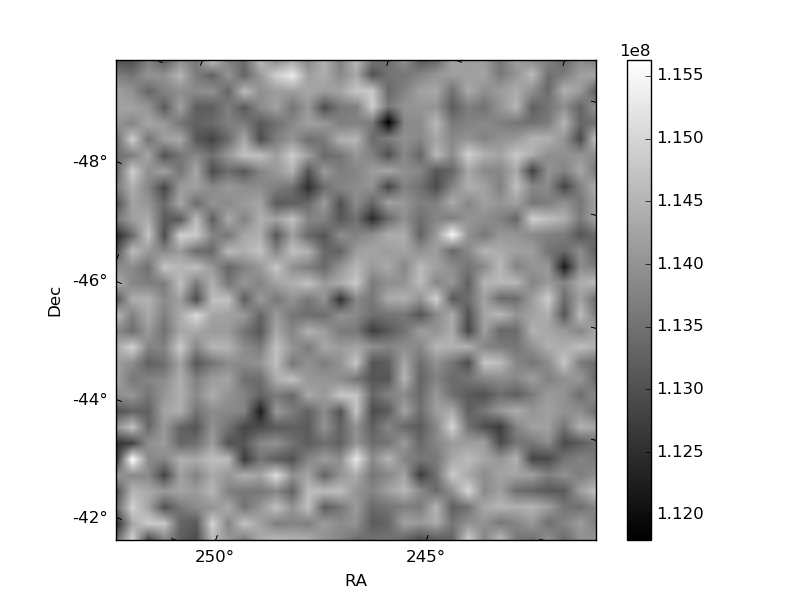
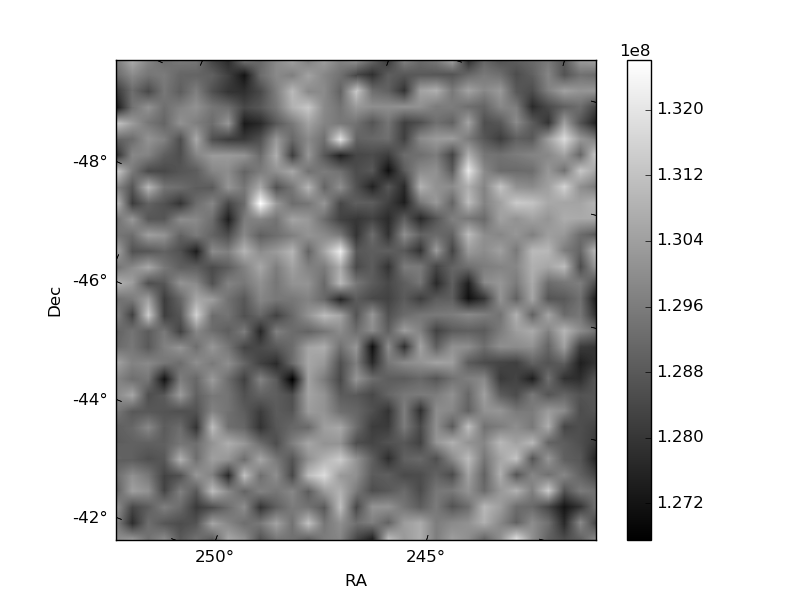
Histogram calculated using DETX and DETY for each event in the final _common_clean file
| Quadrant A |  |
 |
Quadrant B |
|---|---|---|---|
| Quadrant D | 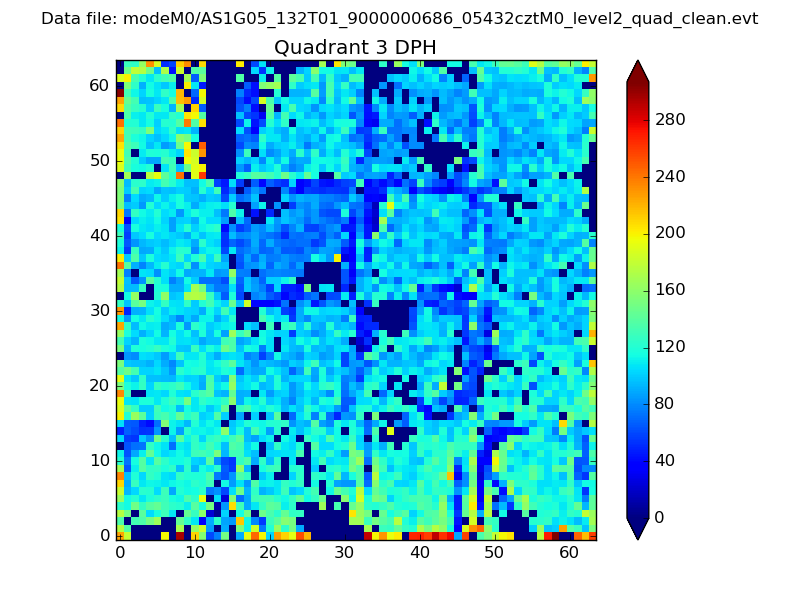 |
 |
Quadrant C |
| Plot type | Count rate plots | Images |
|---|---|---|
| Comparison with Poisson distribution Blue bars denote a histogram of data divided into 1 sec bins. Red curve is a Poisson curve with rate = median count rate of data. |
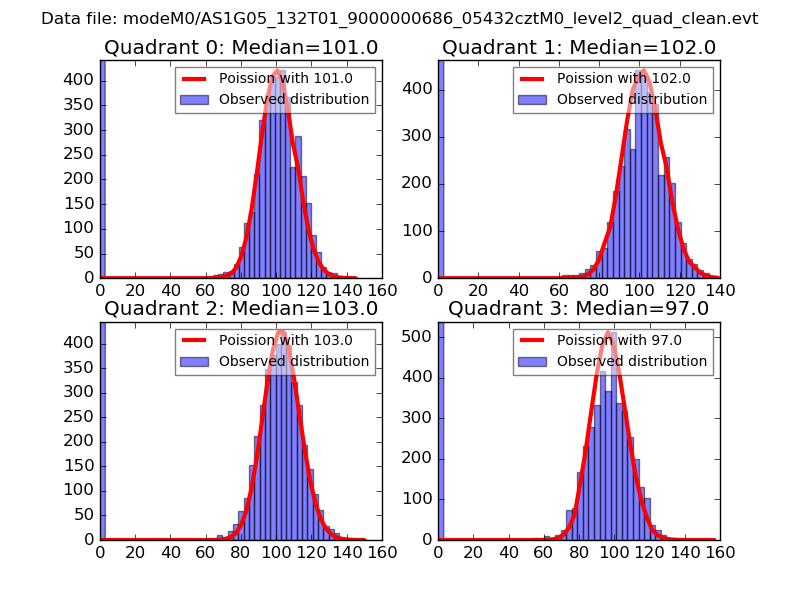 |
 |
| Quadrant-wise count rates Data is divided into 100 sec bins |
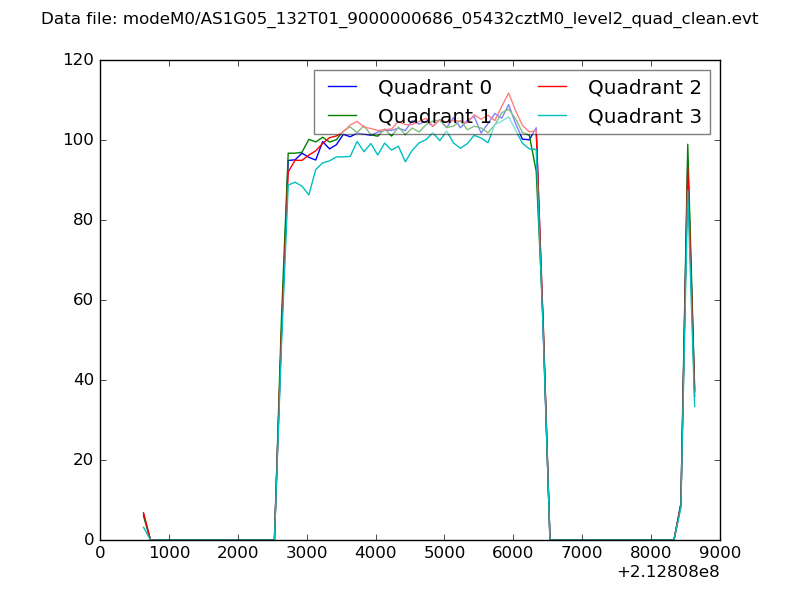 |
|
| Module-wise count rates for Quadrant A Data is divided into 100 sec bins |
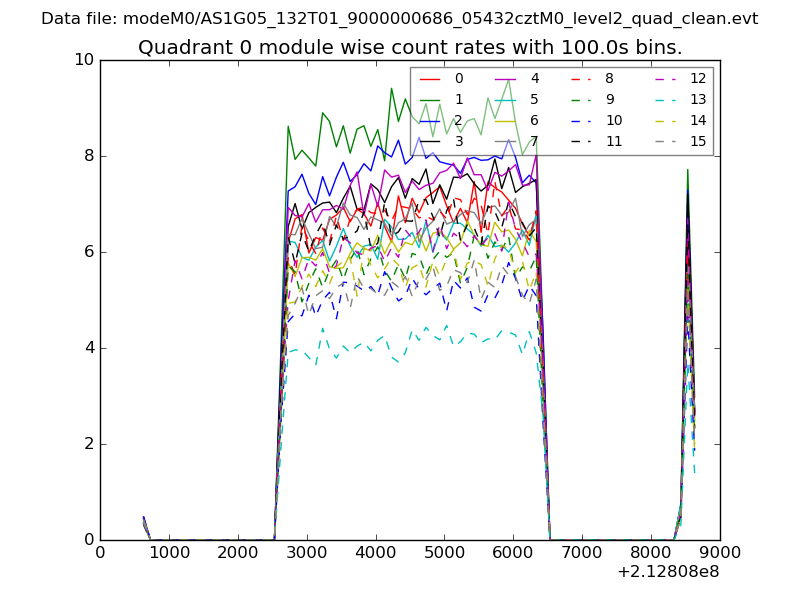 |
 |
| Module-wise count rates for Quadrant B Data is divided into 100 sec bins |
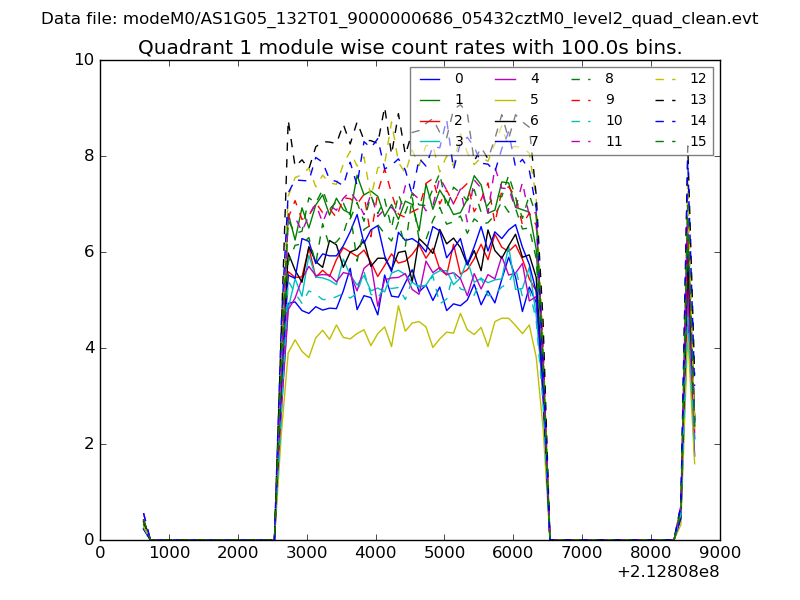 |
 |
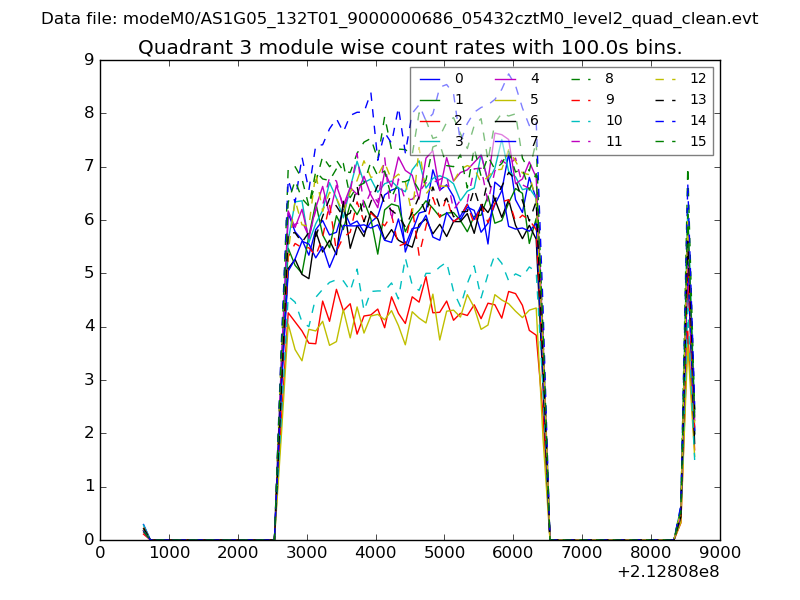
| Module-wise count rates for Quadrant C Data is divided into 100 sec bins |
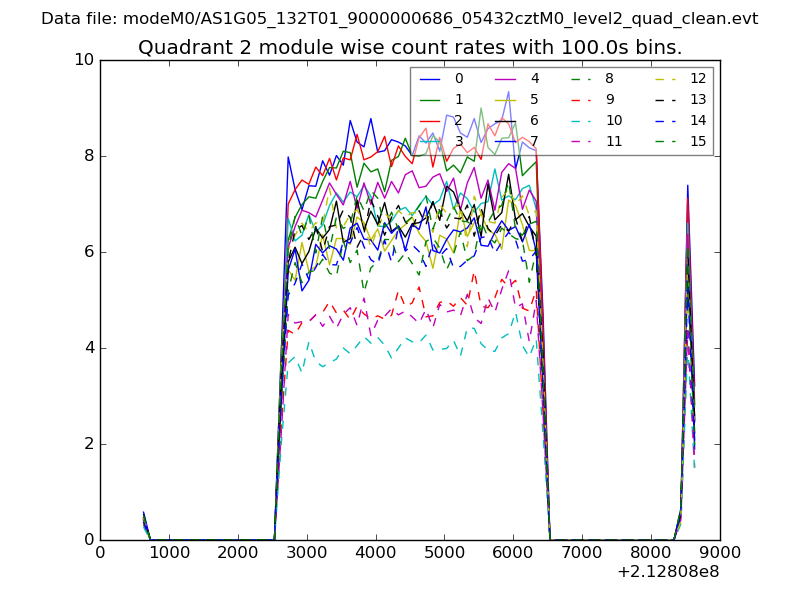 |
 |
| Module-wise count rates for Quadrant D Data is divided into 100 sec bins |
 |
 |
| Parameter | Plot |
|---|---|
| CZT HV Monitor | 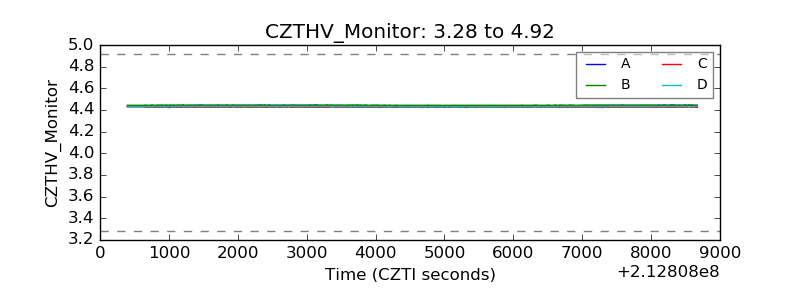 |
| D_VDD | 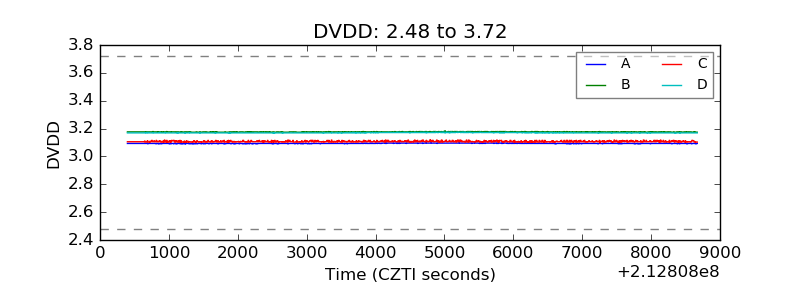 |
| Temperature 1 | 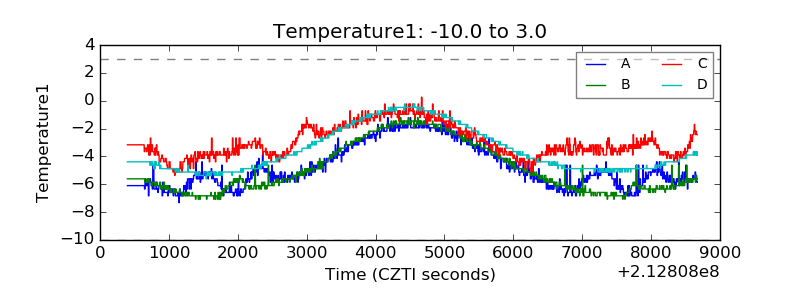 |
| Veto HV Monitor | 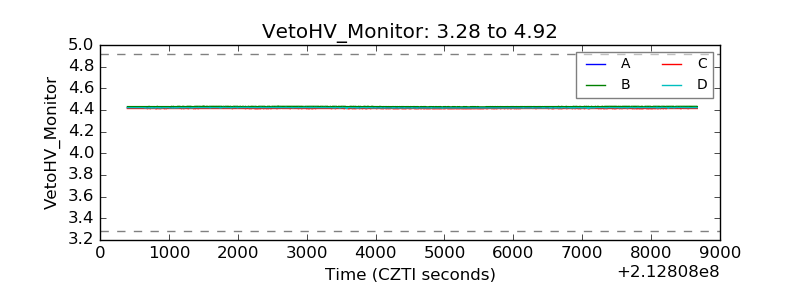 |
| Veto LLD | 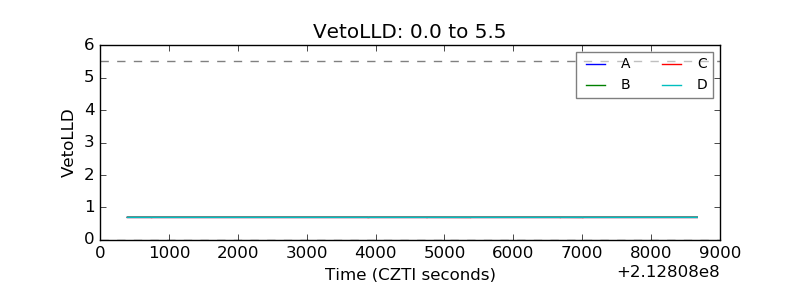 |
| Alpha Counter | 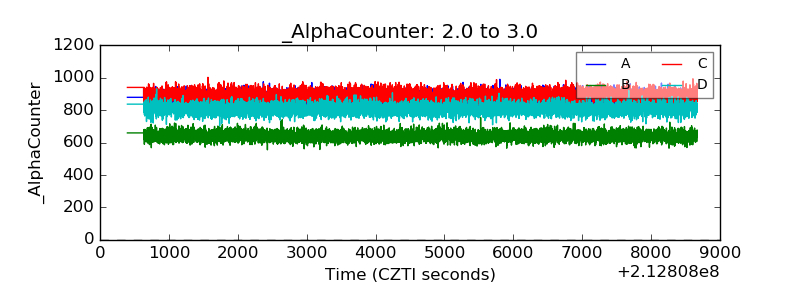 |
| _CPM_Rate | 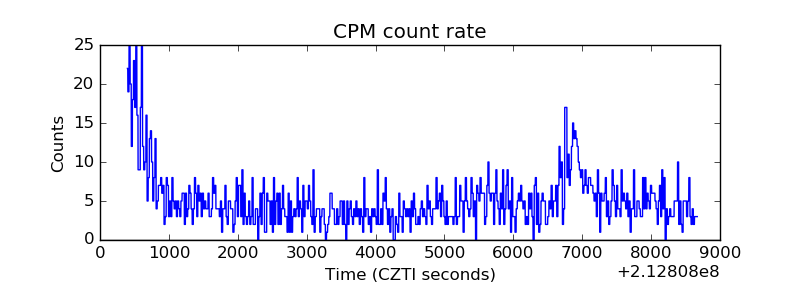 |
| CZT Counter | 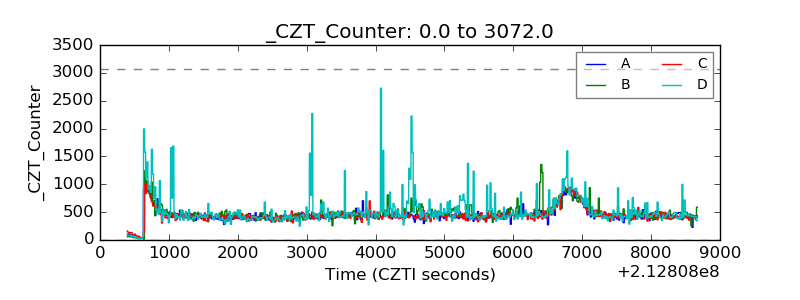 |
| +2.5 Volts monitor |  |
| +5 Volts monitor |  |
| _ROLL_ROT | 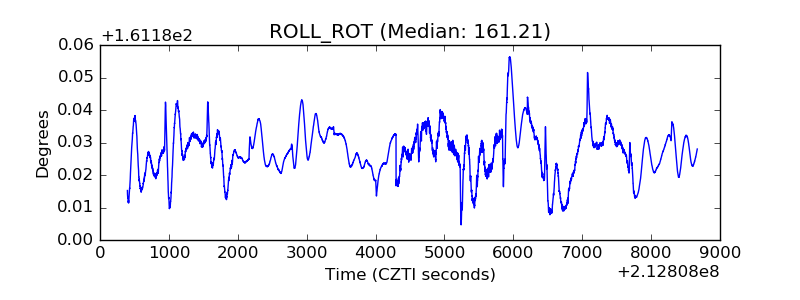 |
| _Roll_DEC | 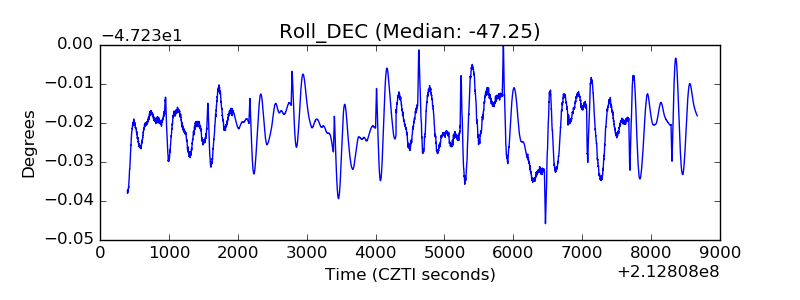 |
| _Roll_RA | 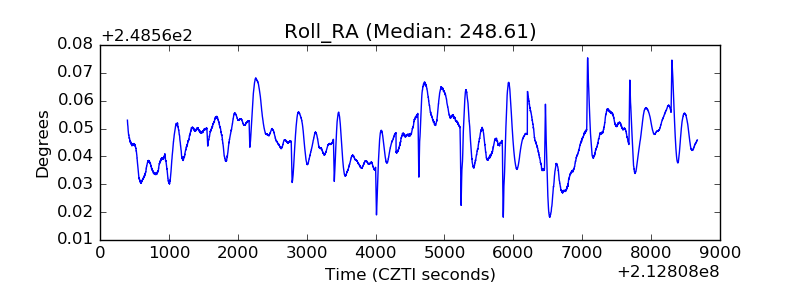 |
| Veto Counter | 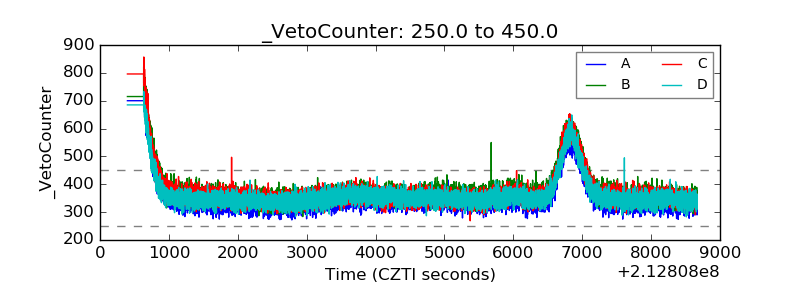 |