| Param | Original file | Final file |
|---|---|---|
| Filename | modeM0/AS1G05_204T01_9000000688_05441cztM0_level2.evt | modeM0/AS1G05_204T01_9000000688_05441cztM0_level2_quad_clean.evt |
| Size (bytes) | 444,885,120 | 109,526,400 |
| Size | 424.3 MB | 104.5 MB |
| Events in quadrant A | 2,992,254 | 724,050 |
| Events in quadrant B | 3,516,771 | 730,652 |
| Events in quadrant C | 2,962,126 | 732,915 |
| Events in quadrant D | 3,579,388 | 695,282 |
| Mode M0 | |||
|---|---|---|---|
| Quadrant | BADHDUFLAG | Total packets | Discarded packets |
| A | 0 | 13137 | 2 |
| B | 0 | 14758 | 1 |
| C | 0 | 12986 | 1 |
| D | 0 | 14814 | 1 |
| Mode SS | |||
|---|---|---|---|
| Quadrant | BADHDUFLAG | Total packets | Discarded packets |
| A | 0 | 126 | 0 |
| B | 0 | 126 | 0 |
| C | 0 | 126 | 0 |
| D | 0 | 126 | 0 |
| Mode M9 | |||
|---|---|---|---|
| Quadrant | BADHDUFLAG | Total packets | Discarded packets |
| A | 0 | 13 | 0 |
| B | 0 | 13 | 0 |
| C | 0 | 13 | 0 |
| D | 0 | 13 | 0 |
| Quadrant | Total seconds | Saturated seconds | Saturation percentage |
|---|---|---|---|
| A | 6223 | 68 | 1.092721% |
| B | 6223 | 79 | 1.269484% |
| C | 6223 | 50 | 0.803471% |
| D | 6223 | 121 | 1.944400% |
Noise dominated data is calculated using 1-second bins in cleaned event files. If a bin has >2000 counts, and if more than 50% of those come from <1% of pixels, then it is considered to be noise-dominated and hence unusable.
| Quadrant | # 1 sec bins | Bins with >0 counts | Bins with >2000 counts | High rate bins dominated by noise | Noise dominated (total time) | Noise dominated (detector-on time) | Marked lightcurve |
|---|---|---|---|---|---|---|---|
| A | 7508 | 6224 | 3 | 3 | 0.04% | 0.05% |  |
| B | 7508 | 6224 | 13 | 13 | 0.17% | 0.21% |  |
| C | 7508 | 6224 | 0 | 0 | 0.00% | 0.00% |  |
| D | 7508 | 6224 | 58 | 58 | 0.77% | 0.93% | 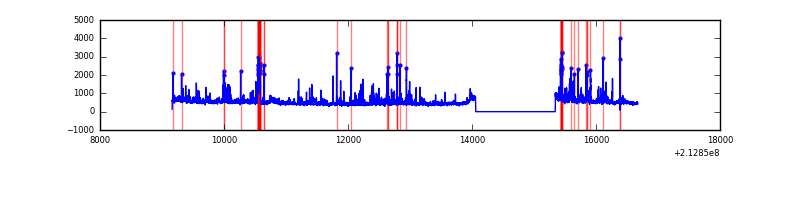 |
Top three noisy pixels from each quadrant. If the there are fewer than three noisy pixels in the level2.evt file, extra rows are filled as -1
| Pixel properties | Quadrant properties | ||||||
|---|---|---|---|---|---|---|---|
| Quadrant | DetID | PixID | Counts | Sigma | Mean | Median | Sigma |
| A | 0 | 50 | 49935 | 323.81 | 754 | 738 | 151.9 |
| A | 15 | 174 | 21534 | 136.88 | 754 | 738 | 151.9 |
| A | 13 | 6 | 15092 | 94.47 | 754 | 738 | 151.9 |
| B | 15 | 204 | 372072 | 2607.78 | 761 | 743 | 142.4 |
| B | 0 | 228 | 66399 | 461.09 | 761 | 743 | 142.4 |
| B | 11 | 51 | 59137 | 410.09 | 761 | 743 | 142.4 |
| C | 9 | 247 | 29900 | 172.32 | 746 | 750 | 169.2 |
| C | 1 | 16 | 14267 | 79.91 | 746 | 750 | 169.2 |
| C | 13 | 61 | 6064 | 31.41 | 746 | 750 | 169.2 |
| D | 2 | 33 | 304924 | 1698.34 | 741 | 718 | 179.1 |
| D | 8 | 195 | 122934 | 682.31 | 741 | 718 | 179.1 |
| D | 2 | 152 | 112008 | 621.32 | 741 | 718 | 179.1 |
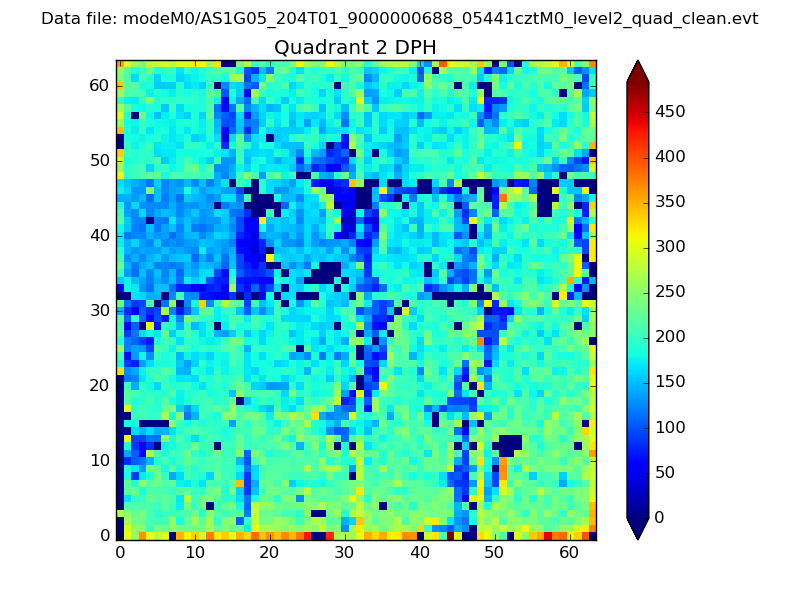
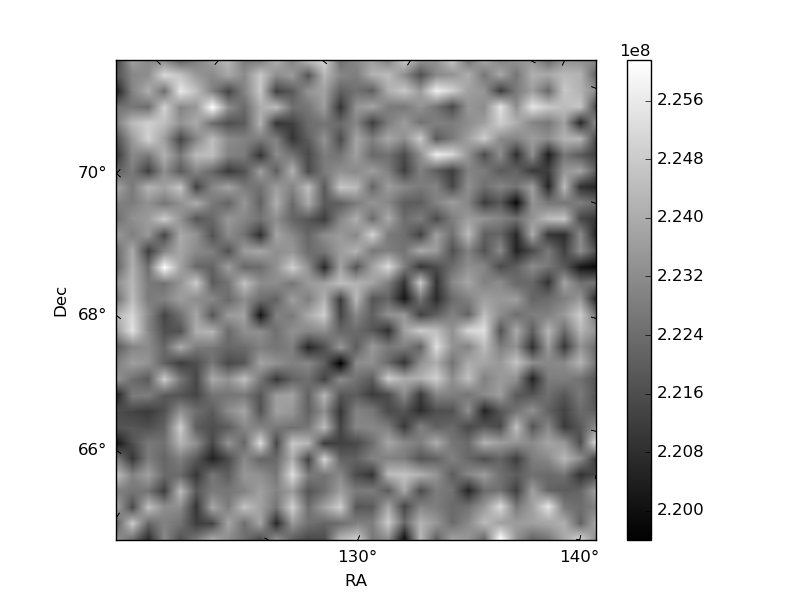
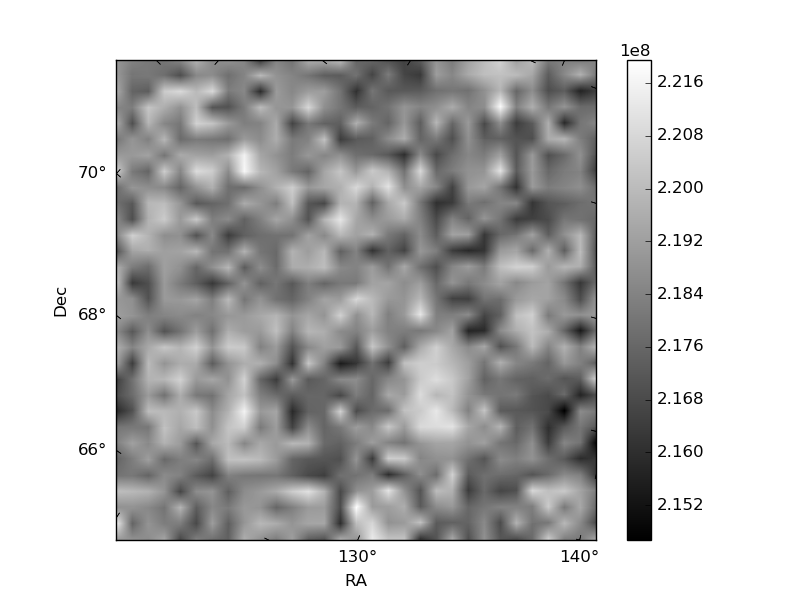
Histogram calculated using DETX and DETY for each event in the final _common_clean file
| Quadrant A | 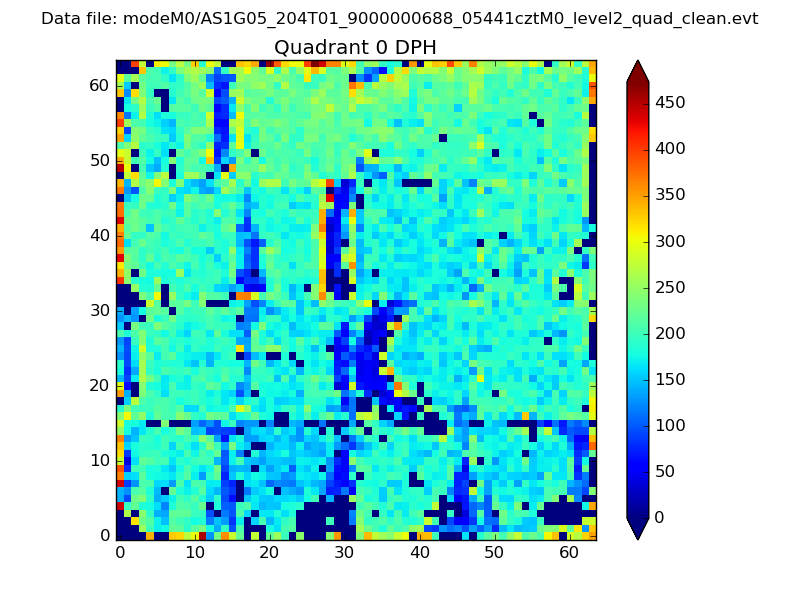 |
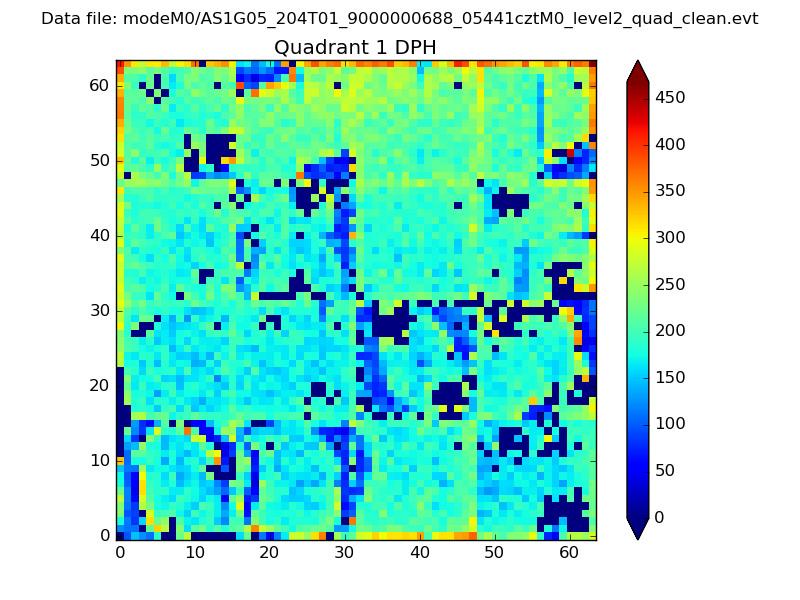 |
Quadrant B |
|---|---|---|---|
| Quadrant D | 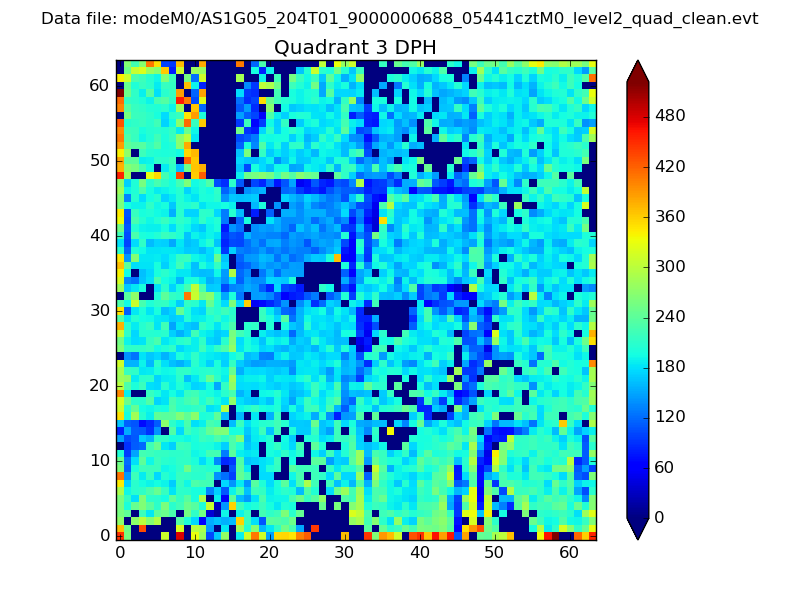 |
 |
Quadrant C |
| Plot type | Count rate plots | Images |
|---|---|---|
| Comparison with Poisson distribution Blue bars denote a histogram of data divided into 1 sec bins. Red curve is a Poisson curve with rate = median count rate of data. |
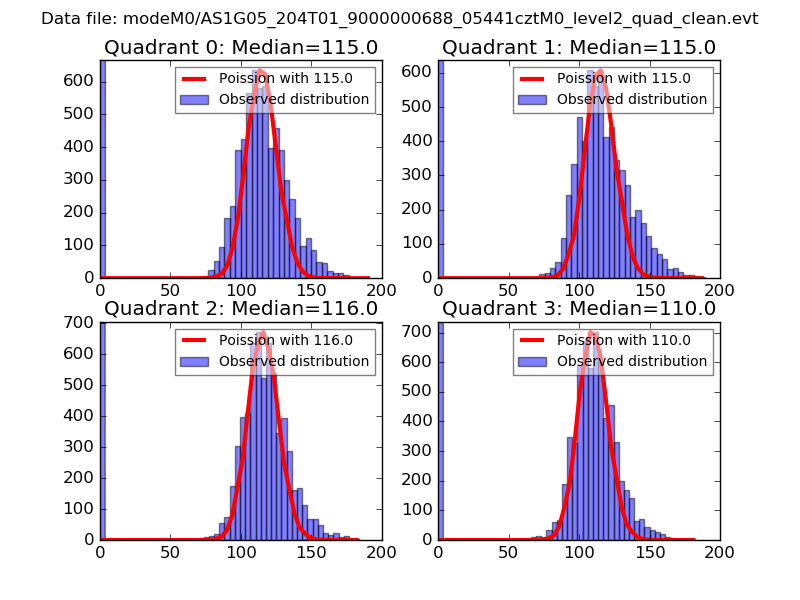 |
 |
| Quadrant-wise count rates Data is divided into 100 sec bins |
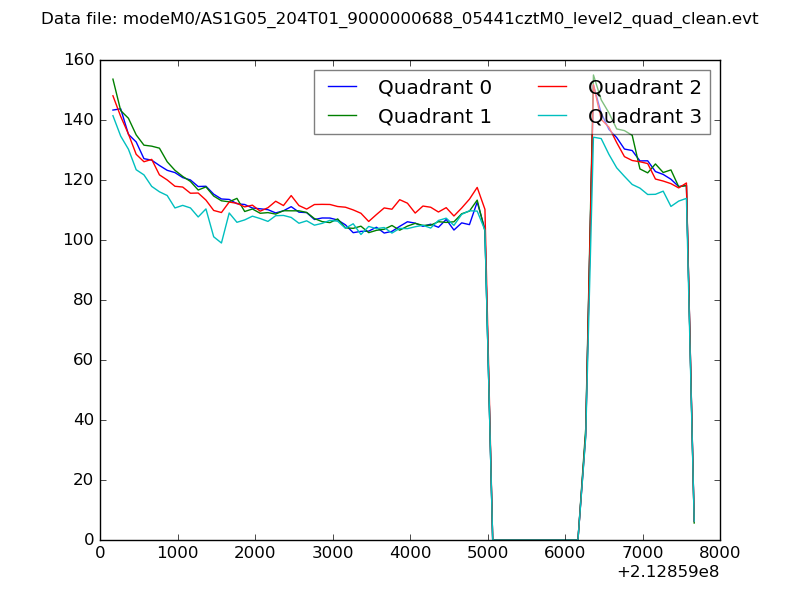 |
|
| Module-wise count rates for Quadrant A Data is divided into 100 sec bins |
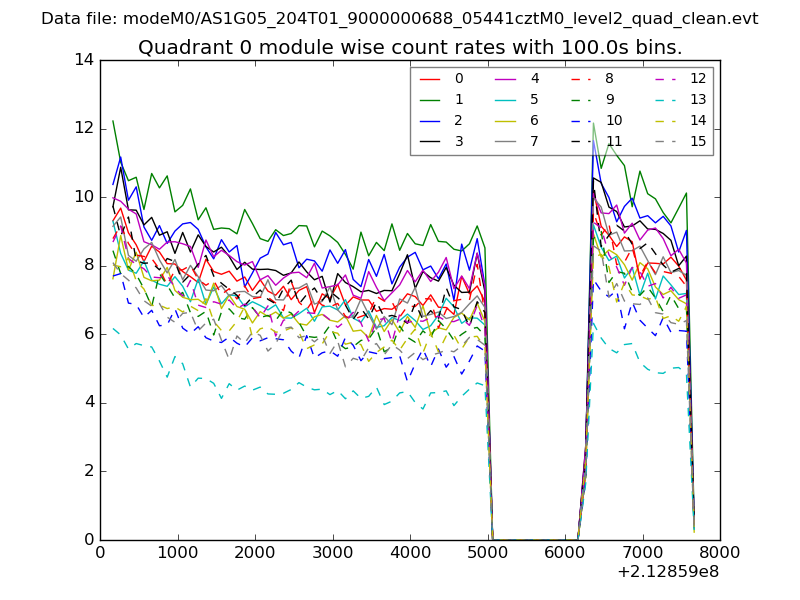 |
 |
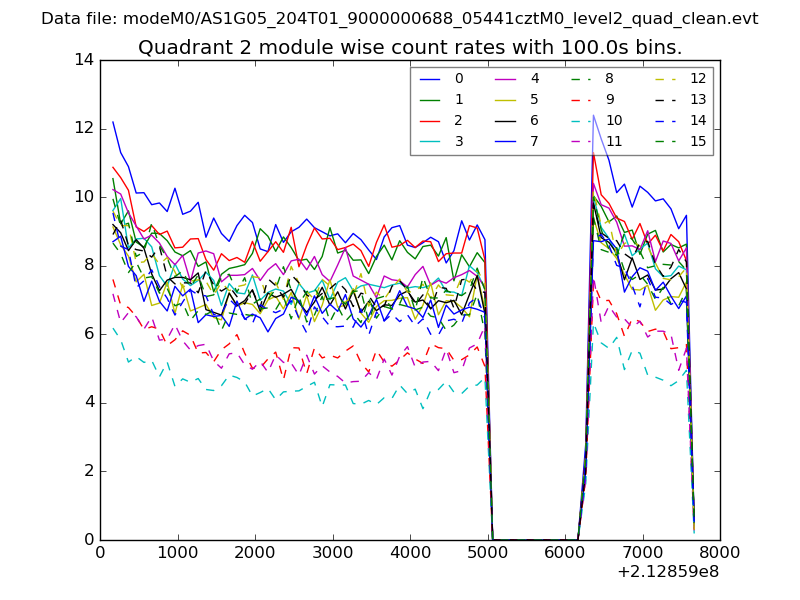
| Module-wise count rates for Quadrant B Data is divided into 100 sec bins |
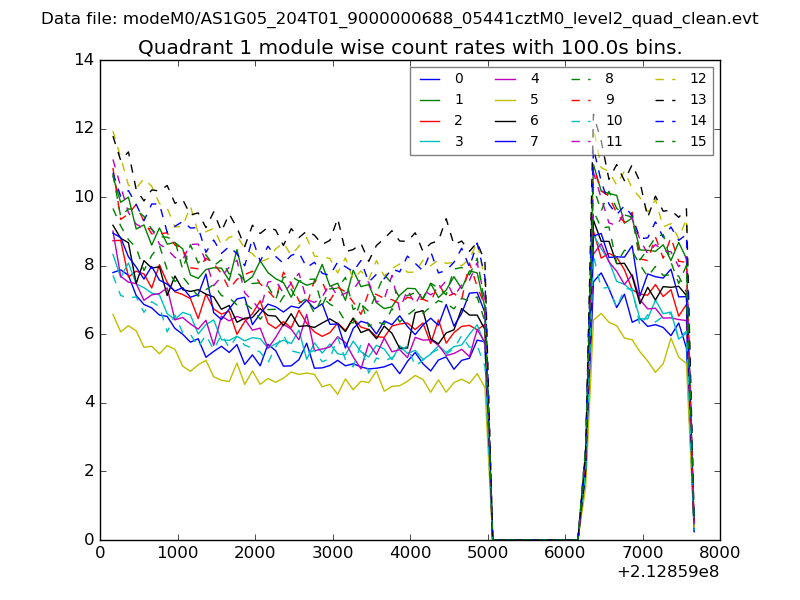 |
 |
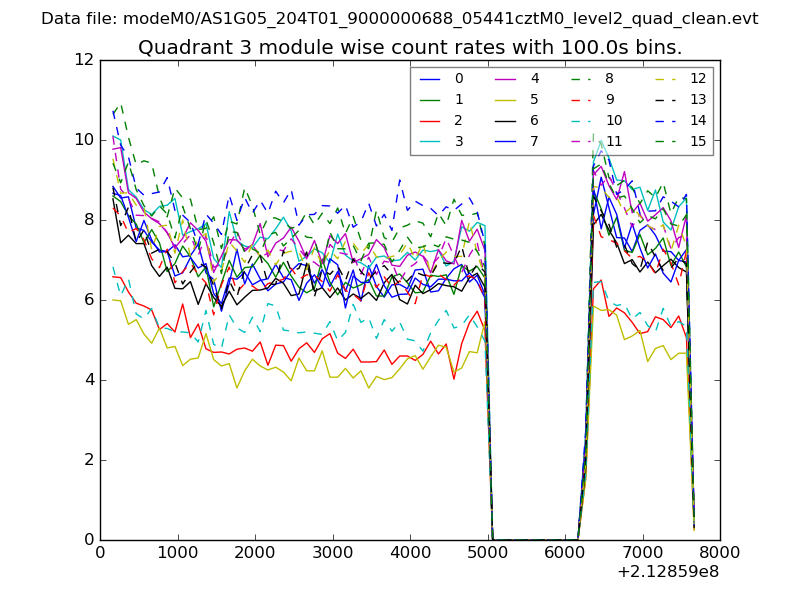
| Module-wise count rates for Quadrant C Data is divided into 100 sec bins |
 |
 |
| Module-wise count rates for Quadrant D Data is divided into 100 sec bins |
 |
 |
| Parameter | Plot |
|---|---|
| CZT HV Monitor | 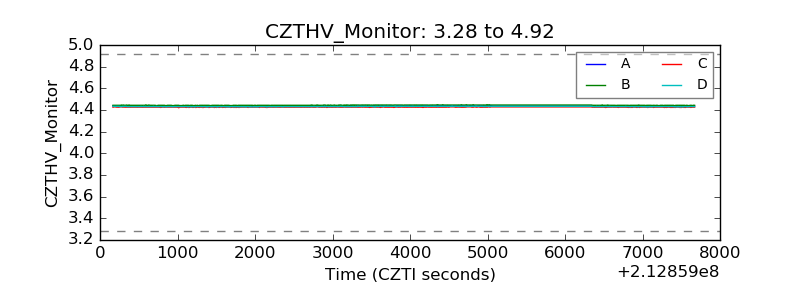 |
| D_VDD | 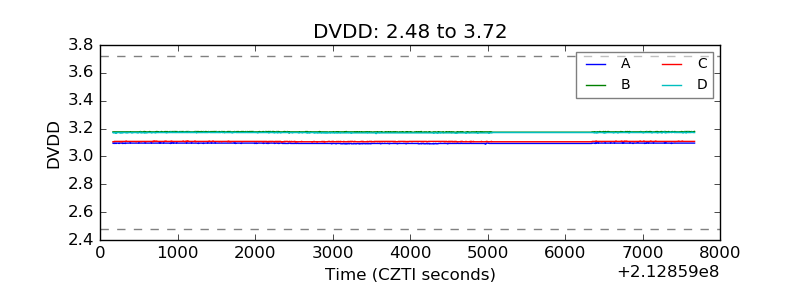 |
| Temperature 1 | 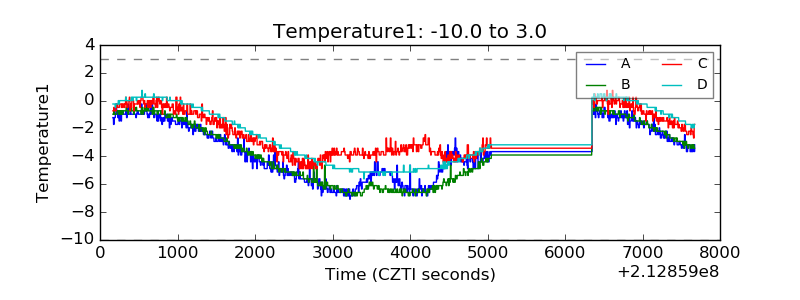 |
| Veto HV Monitor | 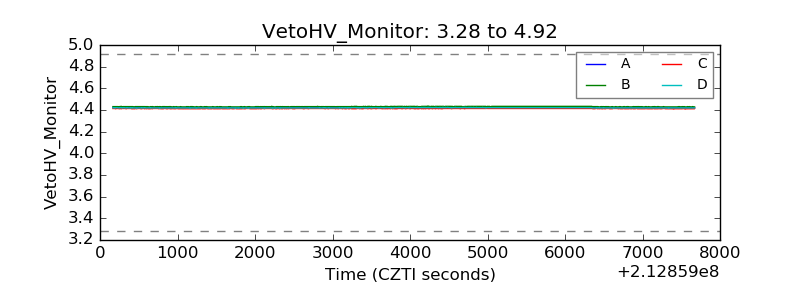 |
| Veto LLD | 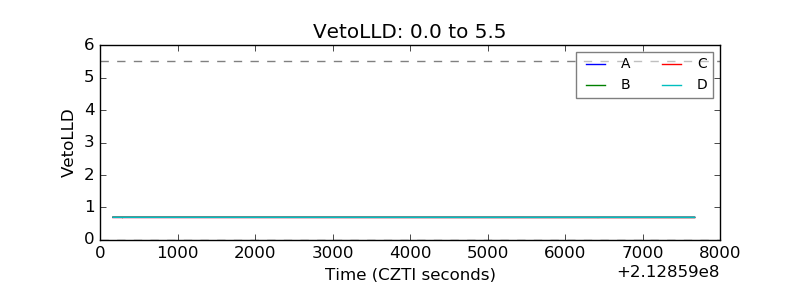 |
| Alpha Counter | 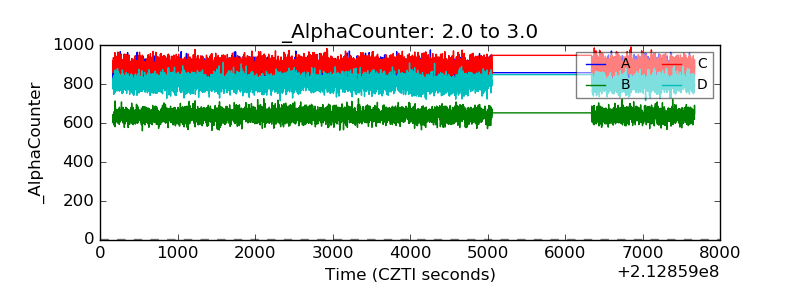 |
| _CPM_Rate | 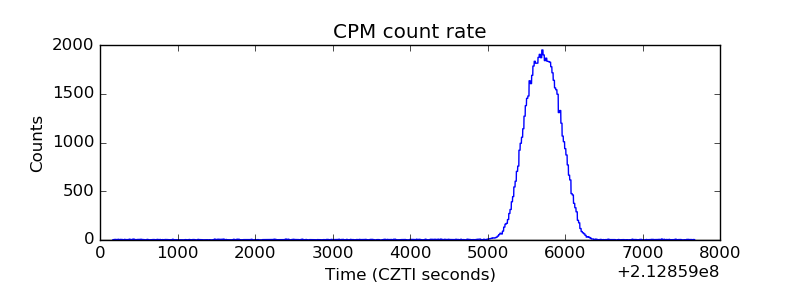 |
| CZT Counter | 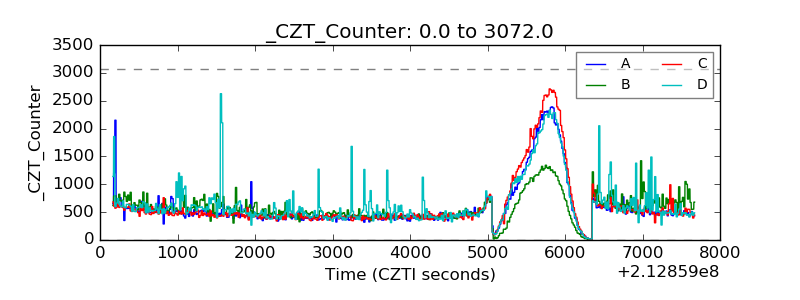 |
| +2.5 Volts monitor |  |
| +5 Volts monitor |  |
| _ROLL_ROT | 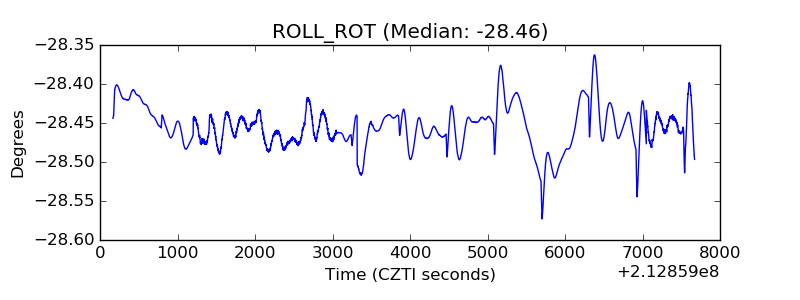 |
| _Roll_DEC | 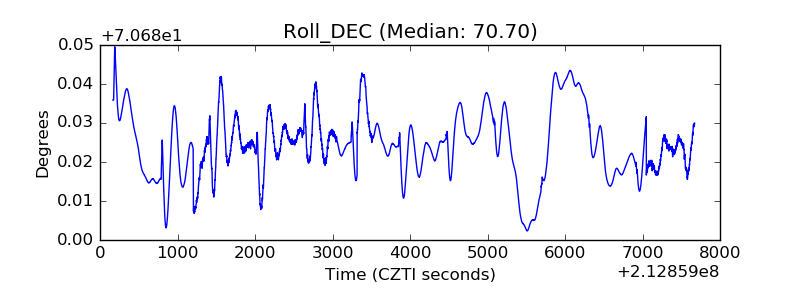 |
| _Roll_RA | 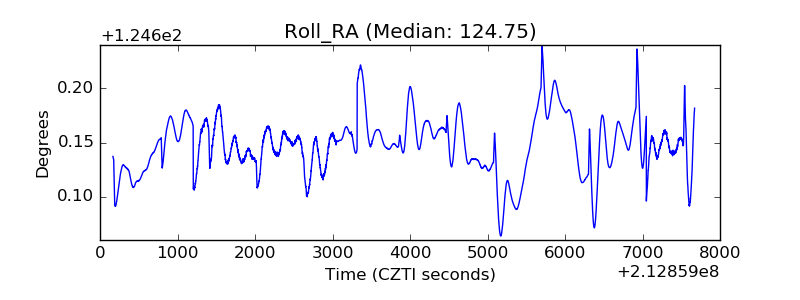 |
| Veto Counter | 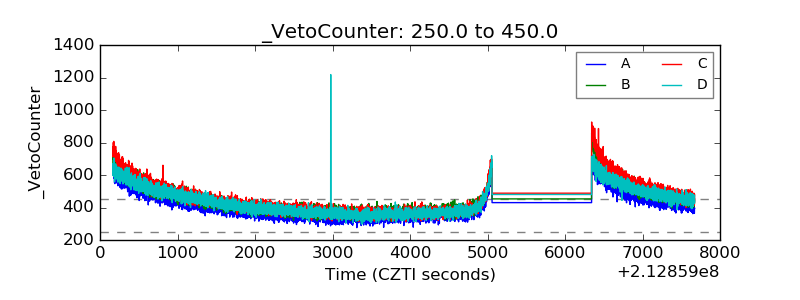 |