| Param | Original file | Final file |
|---|---|---|
| Filename | modeM0/AS1G05_204T01_9000000688_05443cztM0_level2.evt | modeM0/AS1G05_204T01_9000000688_05443cztM0_level2_quad_clean.evt |
| Size (bytes) | 525,049,920 | 107,222,400 |
| Size | 500.7 MB | 102.3 MB |
| Events in quadrant A | 2,967,013 | 710,815 |
| Events in quadrant B | 3,691,120 | 717,882 |
| Events in quadrant C | 3,090,400 | 727,879 |
| Events in quadrant D | 5,721,947 | 647,546 |
| Mode M0 | |||
|---|---|---|---|
| Quadrant | BADHDUFLAG | Total packets | Discarded packets |
| A | 0 | 13335 | 2 |
| B | 0 | 15459 | 1 |
| C | 0 | 13650 | 1 |
| D | 0 | 21461 | 1 |
| Mode SS | |||
|---|---|---|---|
| Quadrant | BADHDUFLAG | Total packets | Discarded packets |
| A | 0 | 128 | 0 |
| B | 0 | 128 | 0 |
| C | 0 | 128 | 2 |
| D | 0 | 128 | 0 |
| Mode M9 | |||
|---|---|---|---|
| Quadrant | BADHDUFLAG | Total packets | Discarded packets |
| A | 0 | 13 | 0 |
| B | 0 | 13 | 0 |
| C | 0 | 13 | 0 |
| D | 0 | 13 | 0 |
| Quadrant | Total seconds | Saturated seconds | Saturation percentage |
|---|---|---|---|
| A | 6352 | 83 | 1.306675% |
| B | 6352 | 132 | 2.078086% |
| C | 6352 | 85 | 1.338161% |
| D | 6352 | 906 | 14.263224% |
Noise dominated data is calculated using 1-second bins in cleaned event files. If a bin has >2000 counts, and if more than 50% of those come from <1% of pixels, then it is considered to be noise-dominated and hence unusable.
| Quadrant | # 1 sec bins | Bins with >0 counts | Bins with >2000 counts | High rate bins dominated by noise | Noise dominated (total time) | Noise dominated (detector-on time) | Marked lightcurve |
|---|---|---|---|---|---|---|---|
| A | 7607 | 6353 | 11 | 11 | 0.14% | 0.17% | 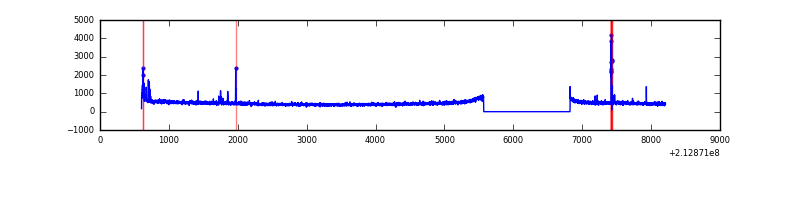 |
| B | 7607 | 6353 | 17 | 17 | 0.22% | 0.27% | 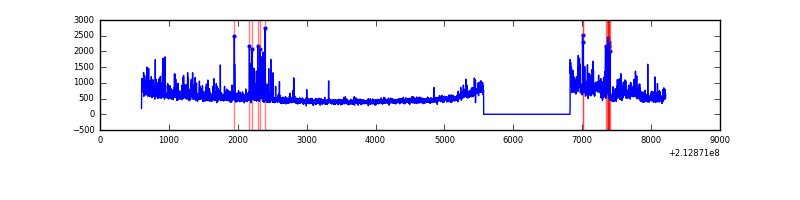 |
| C | 7607 | 6353 | 2 | 2 | 0.03% | 0.03% | 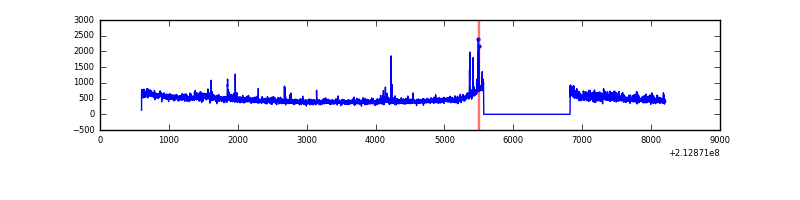 |
| D | 7607 | 6353 | 665 | 665 | 8.74% | 10.47% | 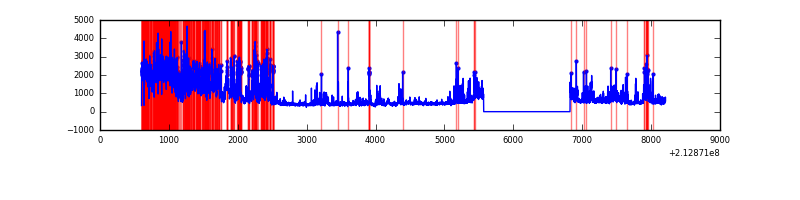 |
Top three noisy pixels from each quadrant. If the there are fewer than three noisy pixels in the level2.evt file, extra rows are filled as -1
| Pixel properties | Quadrant properties | ||||||
|---|---|---|---|---|---|---|---|
| Quadrant | DetID | PixID | Counts | Sigma | Mean | Median | Sigma |
| A | 0 | 50 | 80202 | 524.95 | 744 | 727 | 151.4 |
| A | 13 | 6 | 18158 | 115.14 | 744 | 727 | 151.4 |
| A | 12 | 194 | 7634 | 45.62 | 744 | 727 | 151.4 |
| B | 15 | 204 | 331753 | 2315.79 | 758 | 741 | 142.9 |
| B | 0 | 219 | 203803 | 1420.64 | 758 | 741 | 142.9 |
| B | 4 | 48 | 93625 | 649.83 | 758 | 741 | 142.9 |
| C | 9 | 247 | 78055 | 457.14 | 741 | 745 | 169.1 |
| C | 14 | 67 | 61144 | 357.14 | 741 | 745 | 169.1 |
| C | 1 | 16 | 52681 | 307.1 | 741 | 745 | 169.1 |
| D | 2 | 152 | 1700638 | 10002.1 | 697 | 674 | 170.0 |
| D | 2 | 33 | 1053829 | 6196.46 | 697 | 674 | 170.0 |
| D | 8 | 195 | 180186 | 1056.2 | 697 | 674 | 170.0 |
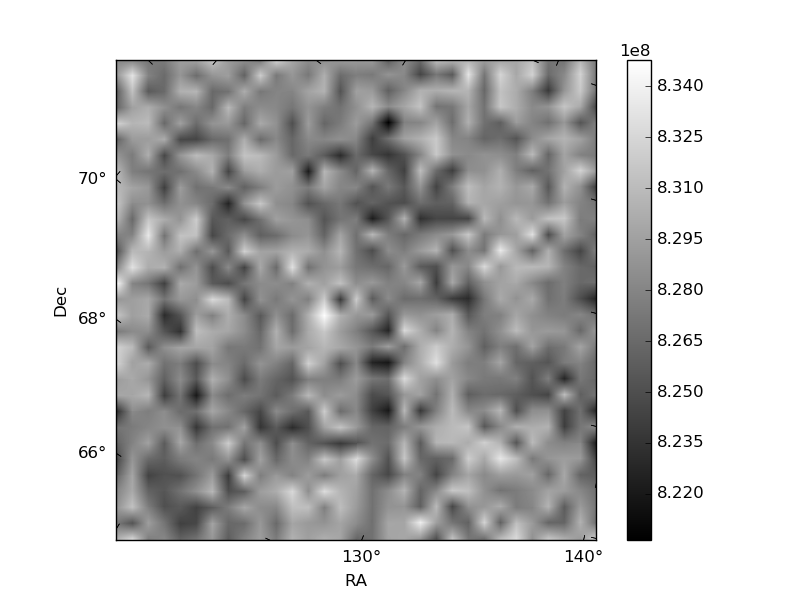
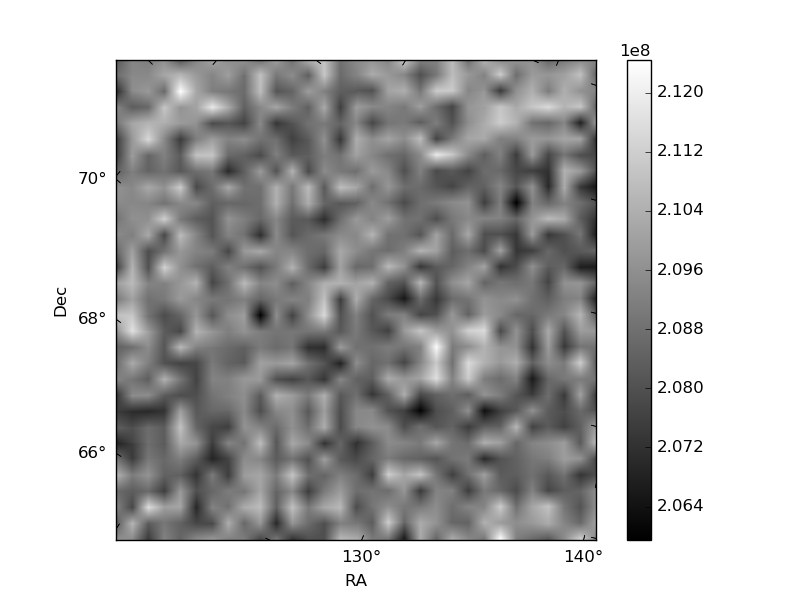
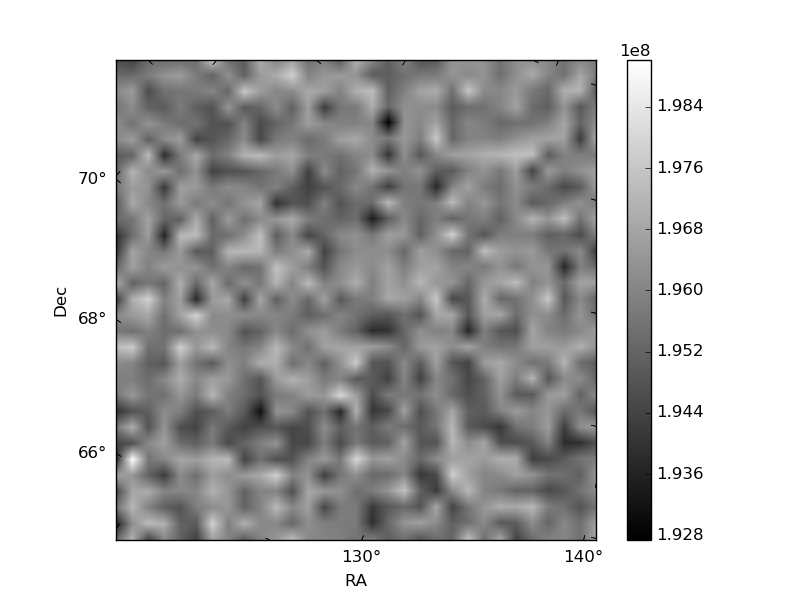
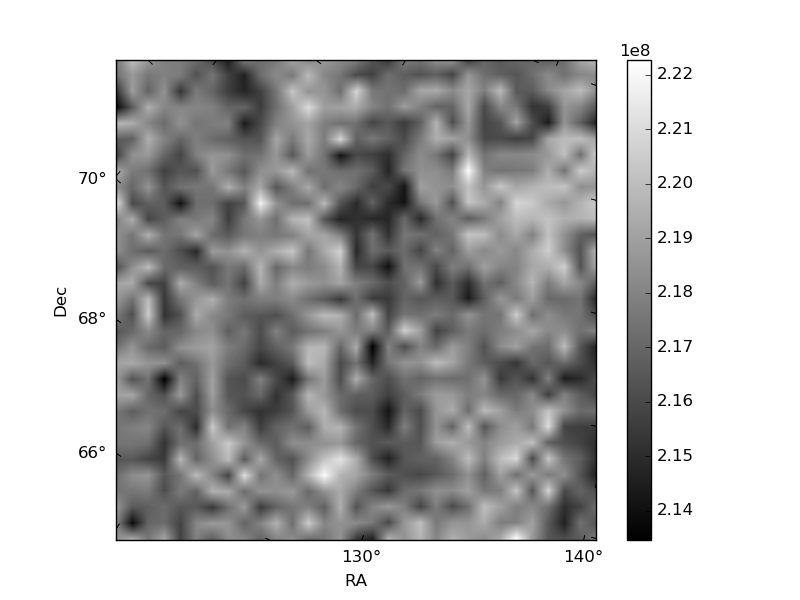
Histogram calculated using DETX and DETY for each event in the final _common_clean file
| Quadrant A | 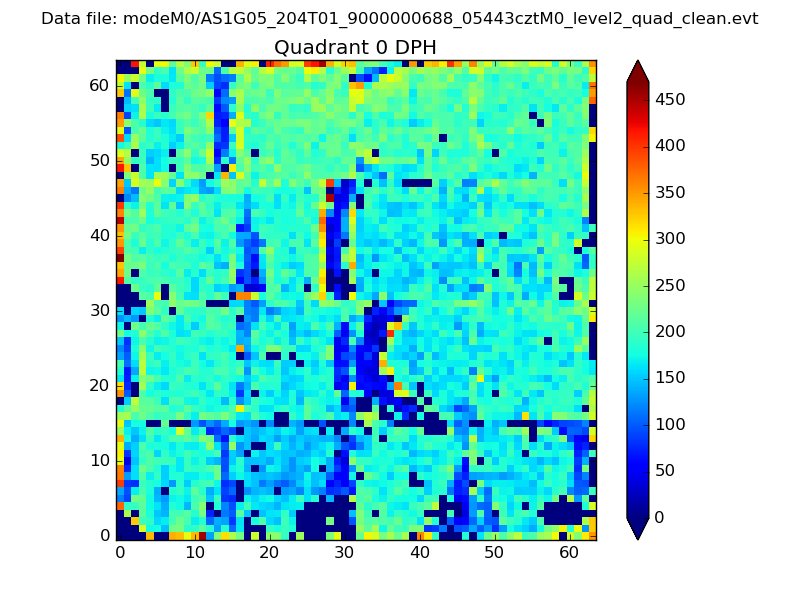 |
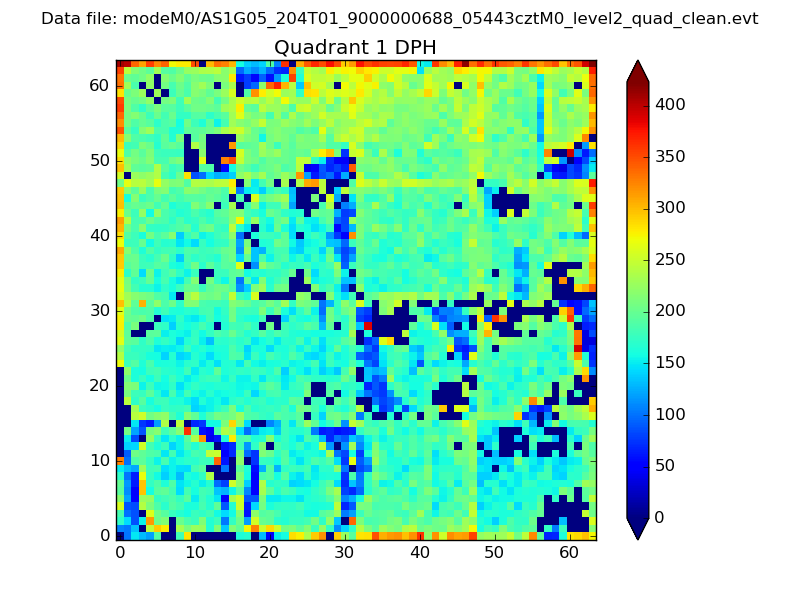 |
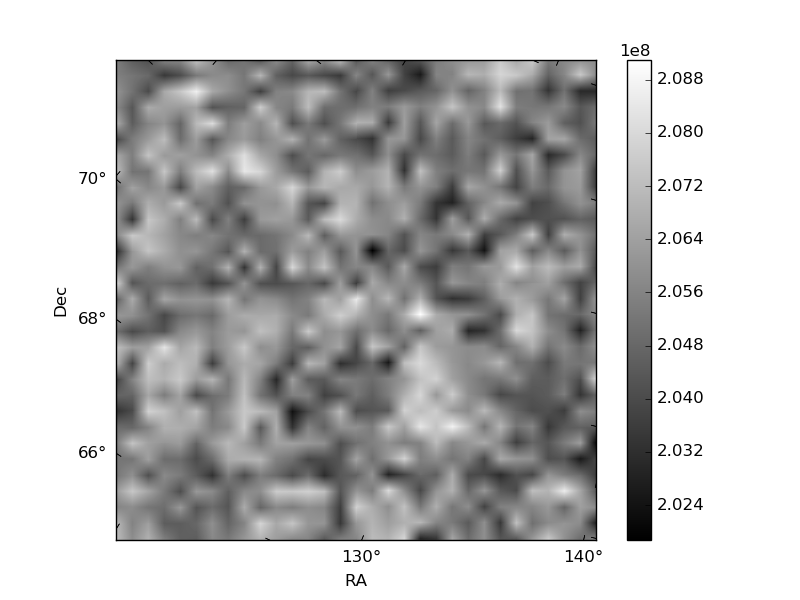
Quadrant B |
|---|---|---|---|
| Quadrant D | 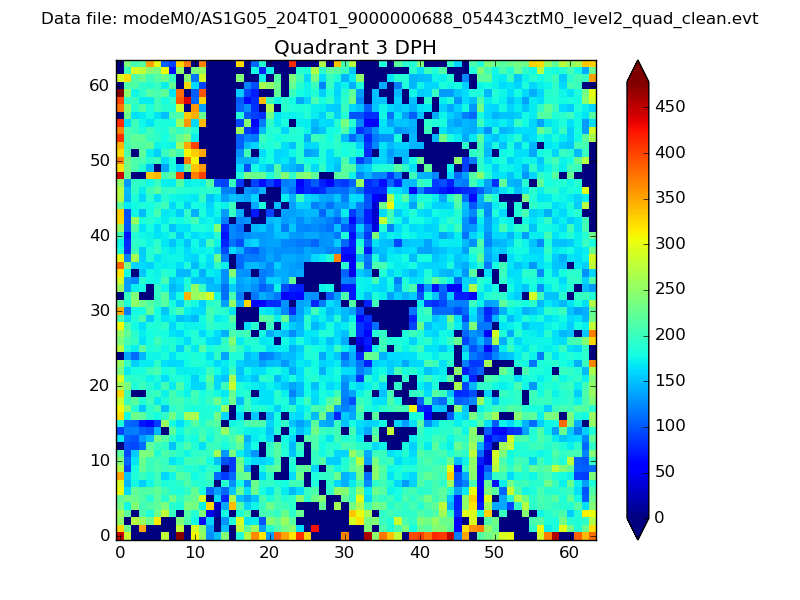 |
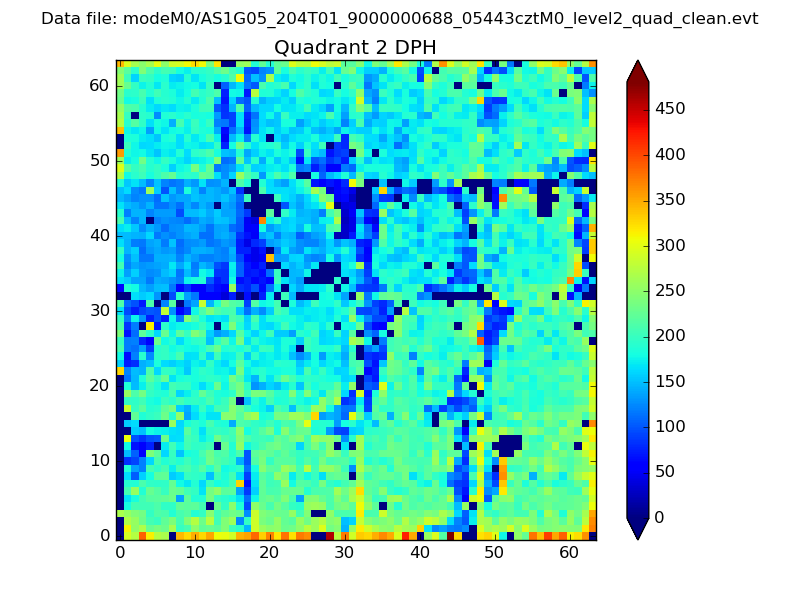 |
Quadrant C |
| Plot type | Count rate plots | Images |
|---|---|---|
| Comparison with Poisson distribution Blue bars denote a histogram of data divided into 1 sec bins. Red curve is a Poisson curve with rate = median count rate of data. |
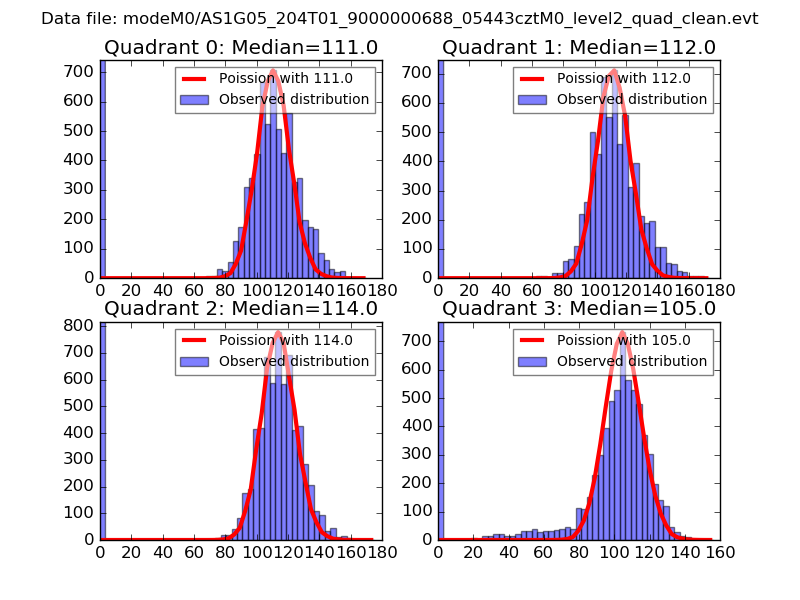 |
 |
| Quadrant-wise count rates Data is divided into 100 sec bins |
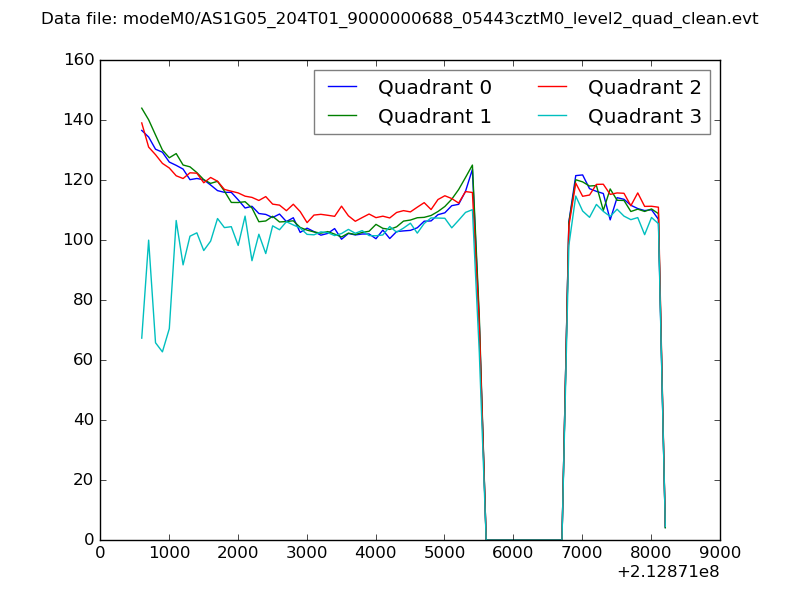 |
|
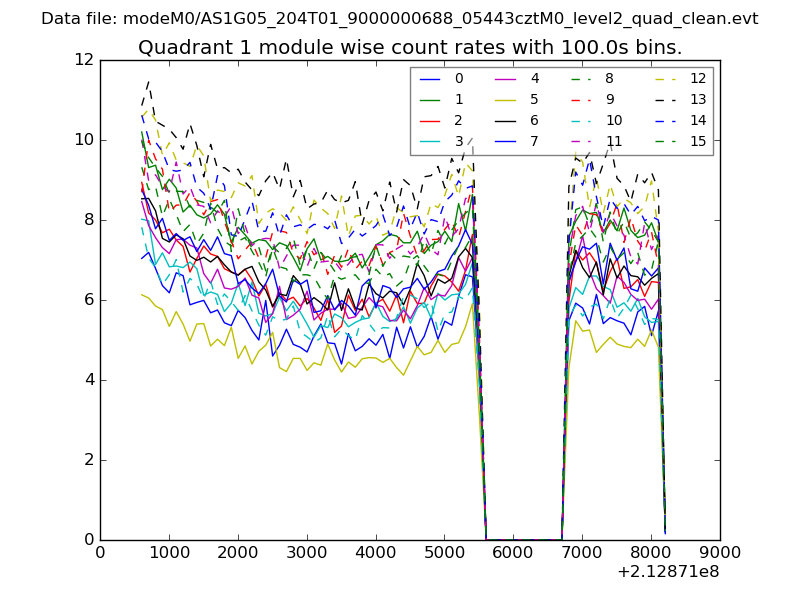
| Module-wise count rates for Quadrant A Data is divided into 100 sec bins |
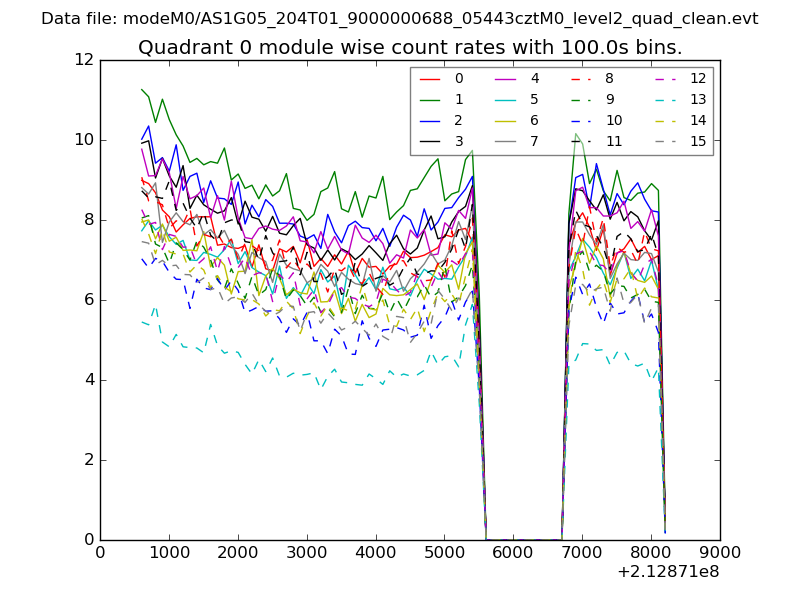 |
 |
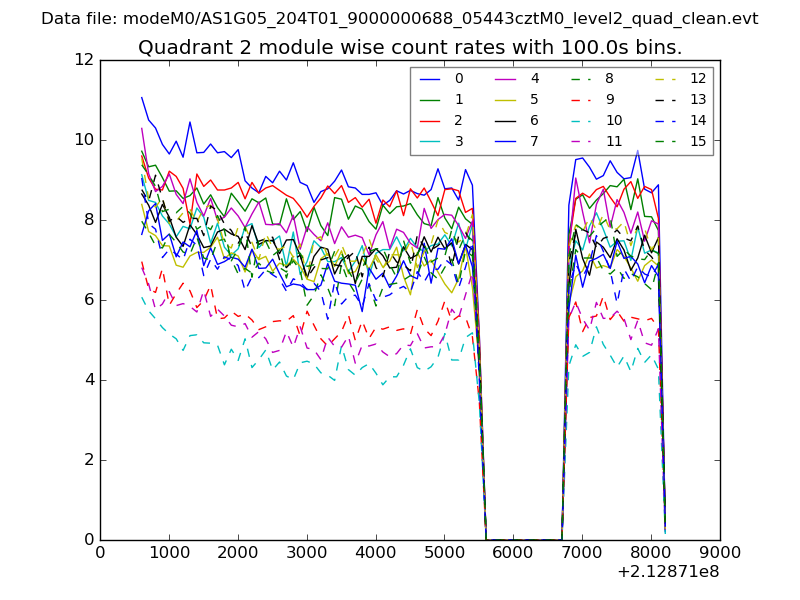
| Module-wise count rates for Quadrant B Data is divided into 100 sec bins |
 |
 |
| Module-wise count rates for Quadrant C Data is divided into 100 sec bins |
 |
 |
| Module-wise count rates for Quadrant D Data is divided into 100 sec bins |
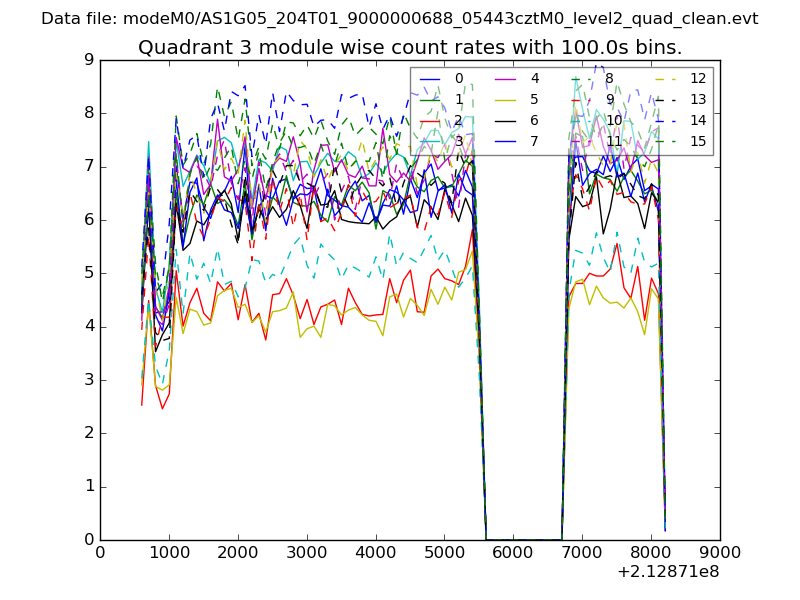 |
 |
| Parameter | Plot |
|---|---|
| CZT HV Monitor | 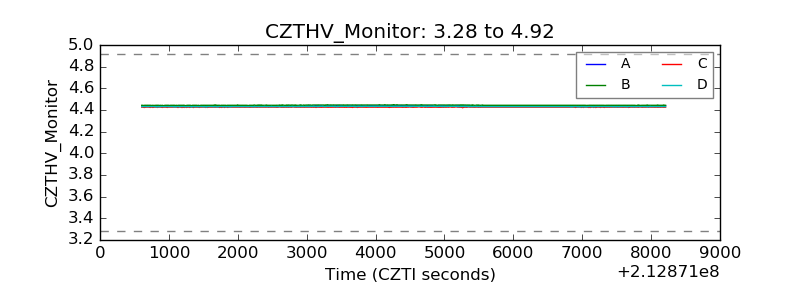 |
| D_VDD |  |
| Temperature 1 | 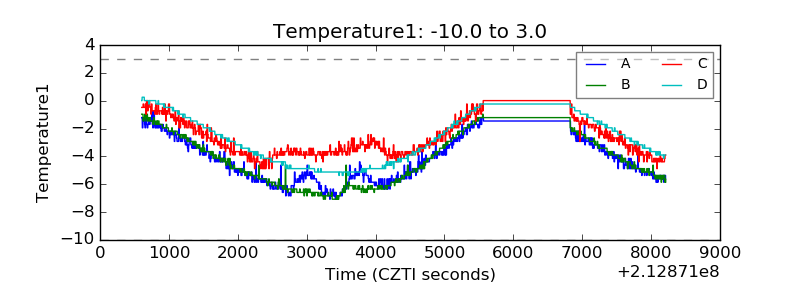 |
| Veto HV Monitor | 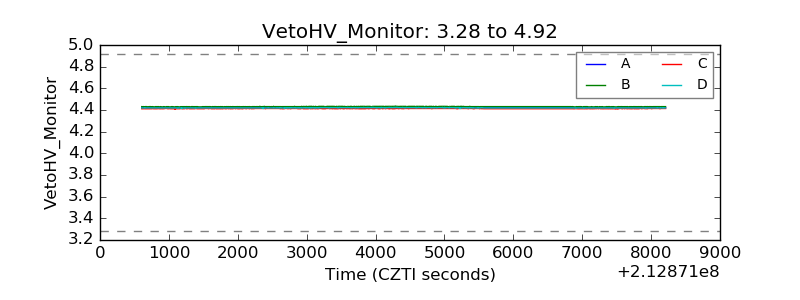 |
| Veto LLD | 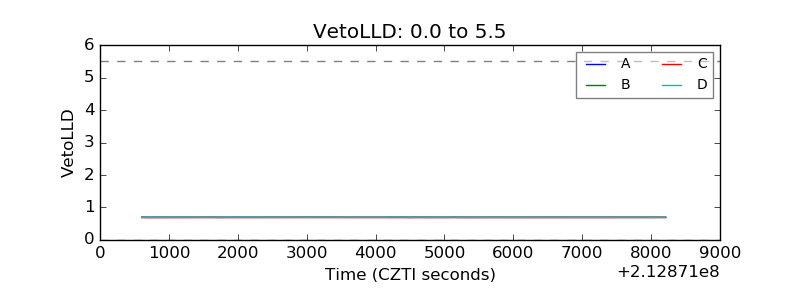 |
| Alpha Counter | 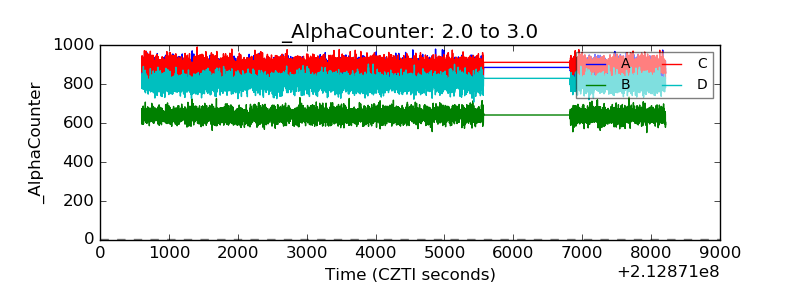 |
| _CPM_Rate | 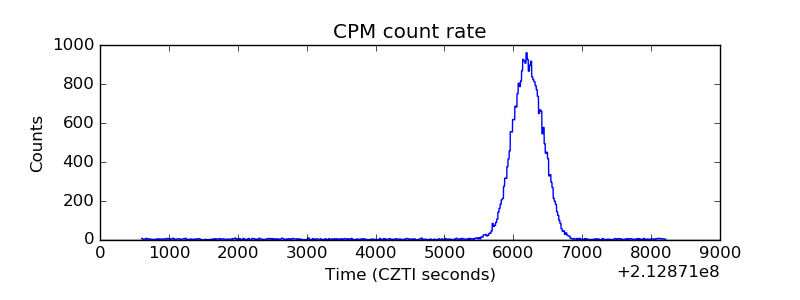 |
| CZT Counter | 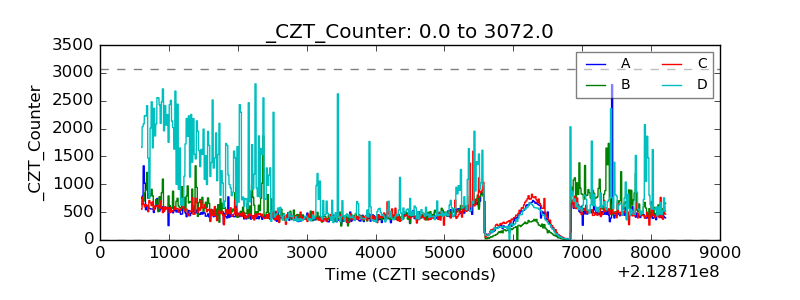 |
| +2.5 Volts monitor |  |
| +5 Volts monitor |  |
| _ROLL_ROT | 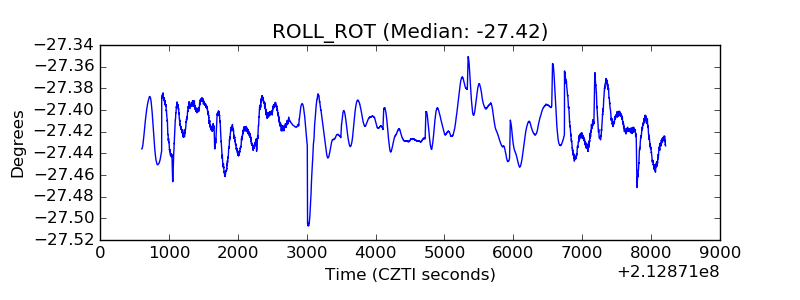 |
| _Roll_DEC | 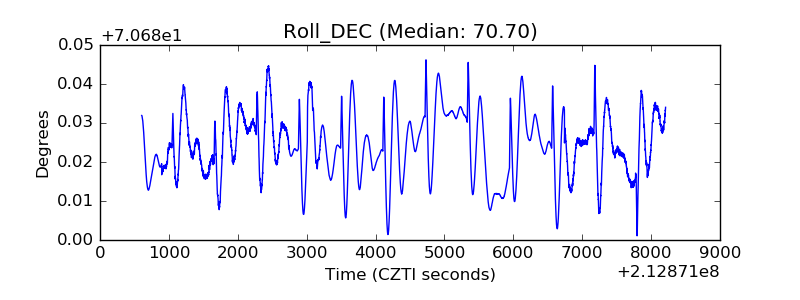 |
| _Roll_RA | 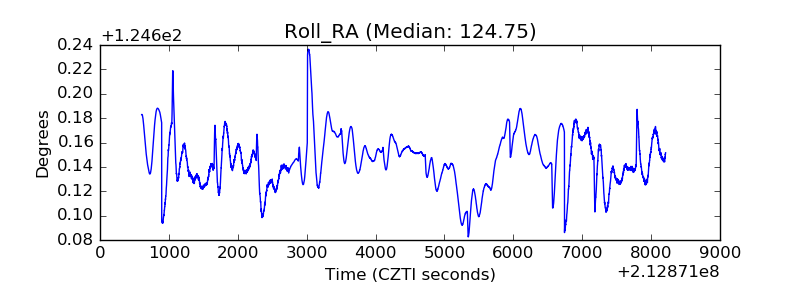 |
| Veto Counter | 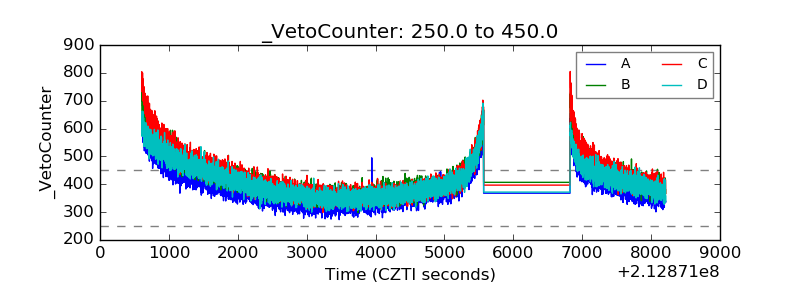 |