| Param | Original file | Final file |
|---|---|---|
| Filename | modeM0/AS1G05_204T01_9000000688_05444cztM0_level2.evt | modeM0/AS1G05_204T01_9000000688_05444cztM0_level2_quad_clean.evt |
| Size (bytes) | 464,333,760 | 106,519,680 |
| Size | 442.8 MB | 101.6 MB |
| Events in quadrant A | 2,920,222 | 696,049 |
| Events in quadrant B | 3,622,073 | 697,097 |
| Events in quadrant C | 2,937,328 | 712,019 |
| Events in quadrant D | 4,140,080 | 666,453 |
| Mode M0 | |||
|---|---|---|---|
| Quadrant | BADHDUFLAG | Total packets | Discarded packets |
| A | 0 | 13647 | 137 |
| B | 0 | 15619 | 220 |
| C | 0 | 13713 | 168 |
| D | 0 | 17213 | 330 |
| Mode SS | |||
|---|---|---|---|
| Quadrant | BADHDUFLAG | Total packets | Discarded packets |
| A | 0 | 134 | 4 |
| B | 0 | 134 | 0 |
| C | 0 | 134 | 2 |
| D | 0 | 134 | 2 |
| Mode M9 | |||
|---|---|---|---|
| Quadrant | BADHDUFLAG | Total packets | Discarded packets |
| A | 0 | 12 | 0 |
| B | 0 | 12 | 0 |
| C | 0 | 12 | 0 |
| D | 0 | 13 | 0 |
| Quadrant | Total seconds | Saturated seconds | Saturation percentage |
|---|---|---|---|
| A | 6536 | 36 | 0.550796% |
| B | 6511 | 95 | 1.459069% |
| C | 6519 | 29 | 0.444854% |
| D | 6492 | 183 | 2.818854% |
Noise dominated data is calculated using 1-second bins in cleaned event files. If a bin has >2000 counts, and if more than 50% of those come from <1% of pixels, then it is considered to be noise-dominated and hence unusable.
| Quadrant | # 1 sec bins | Bins with >0 counts | Bins with >2000 counts | High rate bins dominated by noise | Noise dominated (total time) | Noise dominated (detector-on time) | Marked lightcurve |
|---|---|---|---|---|---|---|---|
| A | 7678 | 6597 | 8 | 8 | 0.10% | 0.12% | 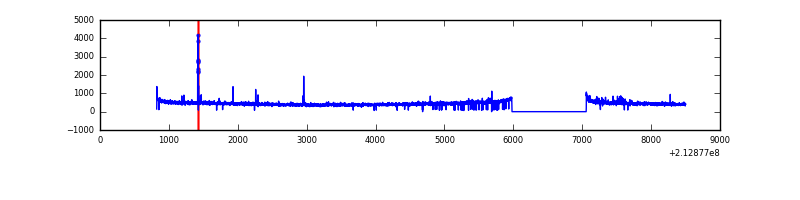 |
| B | 7678 | 6595 | 11 | 11 | 0.14% | 0.17% | 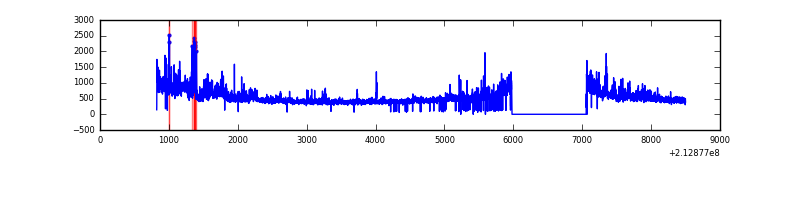 |
| C | 7678 | 6597 | 0 | 0 | 0.00% | 0.00% | 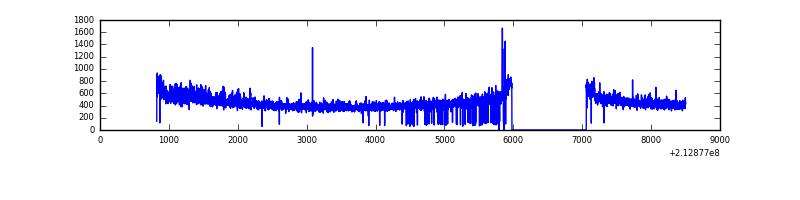 |
| D | 7678 | 6592 | 140 | 140 | 1.82% | 2.12% | 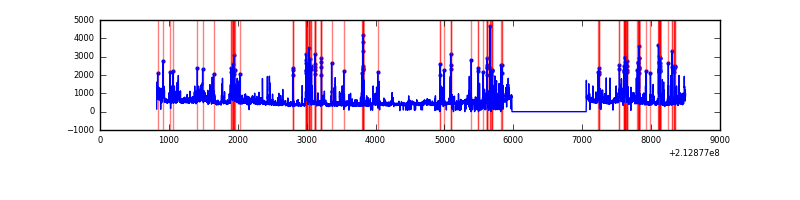 |
Top three noisy pixels from each quadrant. If the there are fewer than three noisy pixels in the level2.evt file, extra rows are filled as -1
| Pixel properties | Quadrant properties | ||||||
|---|---|---|---|---|---|---|---|
| Quadrant | DetID | PixID | Counts | Sigma | Mean | Median | Sigma |
| A | 0 | 50 | 42398 | 275.29 | 738 | 721 | 151.4 |
| A | 8 | 6 | 20737 | 132.21 | 738 | 721 | 151.4 |
| A | 13 | 6 | 13907 | 87.1 | 738 | 721 | 151.4 |
| B | 15 | 204 | 315908 | 2243.92 | 746 | 727 | 140.5 |
| B | 0 | 219 | 258986 | 1838.67 | 746 | 727 | 140.5 |
| B | 11 | 51 | 77033 | 543.26 | 746 | 727 | 140.5 |
| C | 14 | 67 | 62480 | 372.88 | 728 | 734 | 165.6 |
| C | 1 | 16 | 17302 | 100.05 | 728 | 734 | 165.6 |
| C | 1 | 241 | 11230 | 63.38 | 728 | 734 | 165.6 |
| D | 2 | 33 | 707648 | 4068.87 | 713 | 691 | 173.7 |
| D | 2 | 152 | 348481 | 2001.7 | 713 | 691 | 173.7 |
| D | 8 | 195 | 111905 | 640.09 | 713 | 691 | 173.7 |
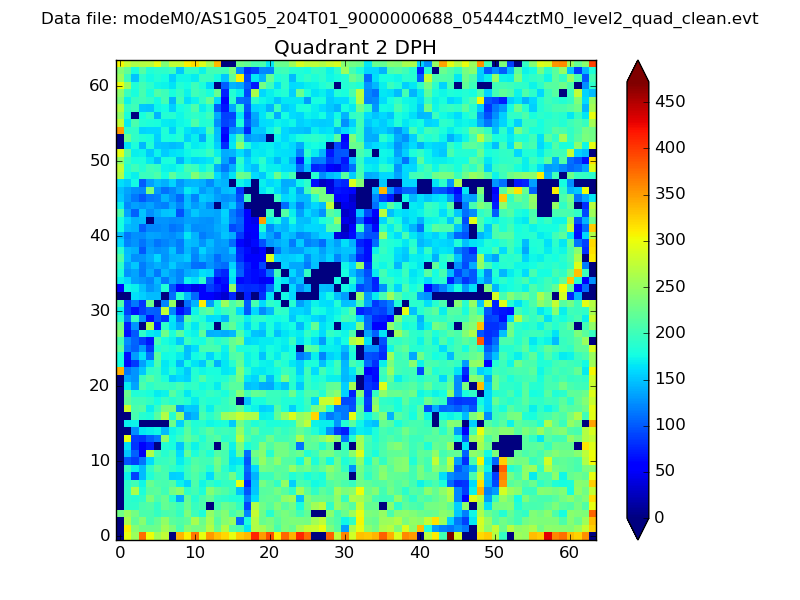
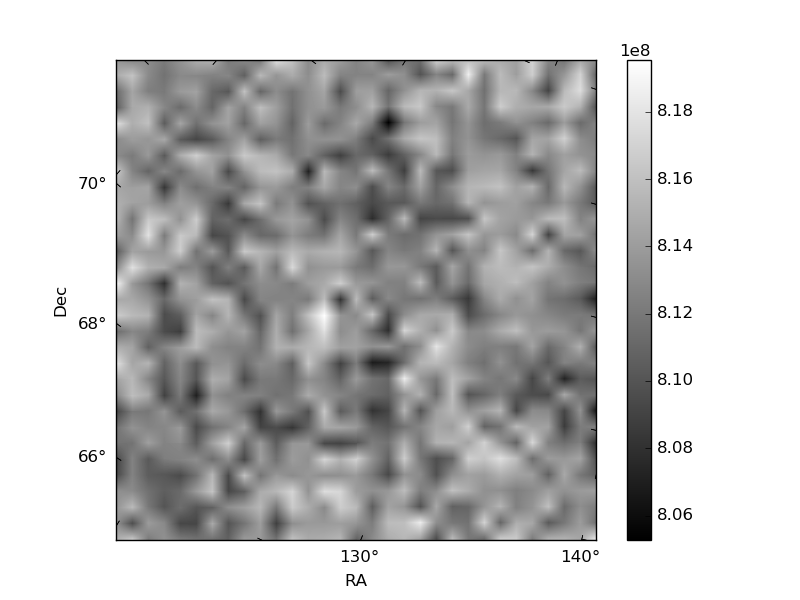
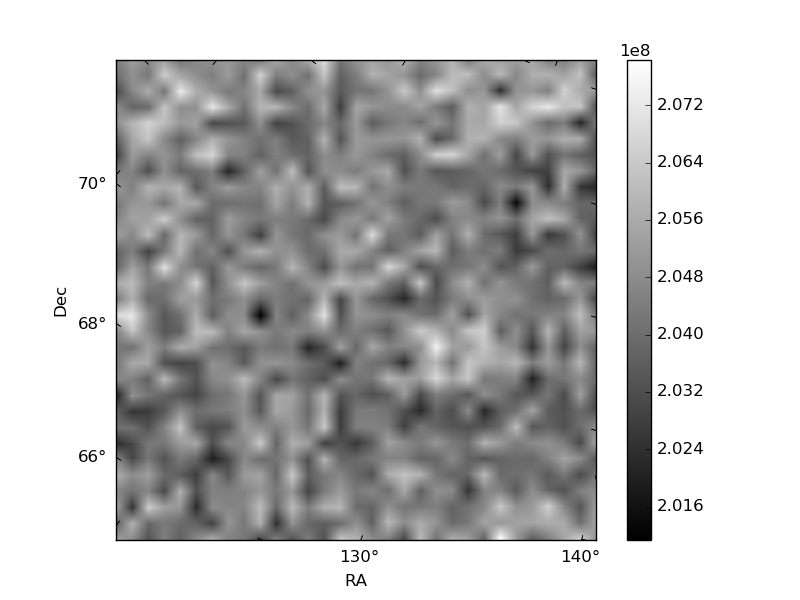
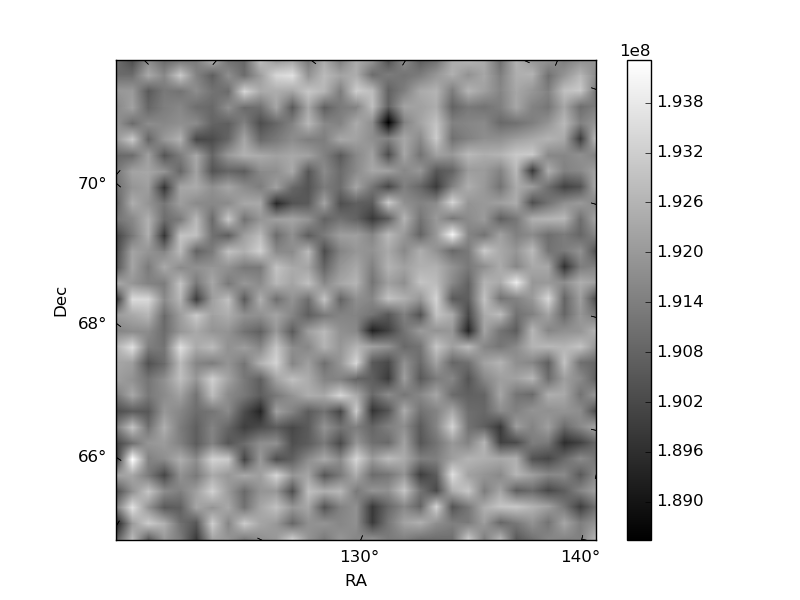
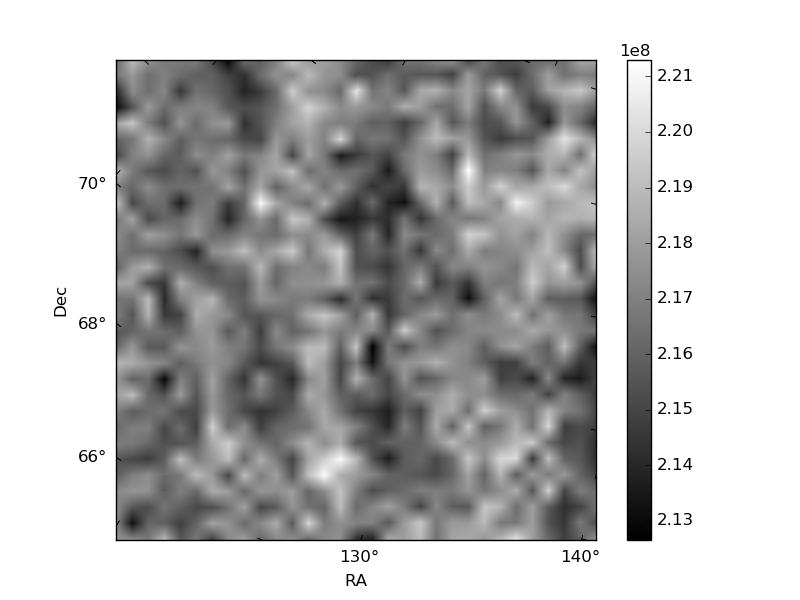
Histogram calculated using DETX and DETY for each event in the final _common_clean file
| Quadrant A | 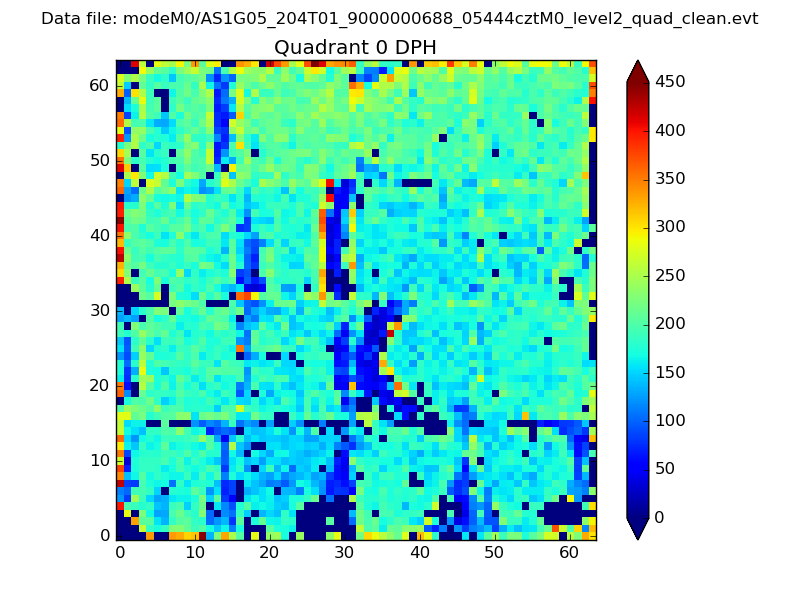 |
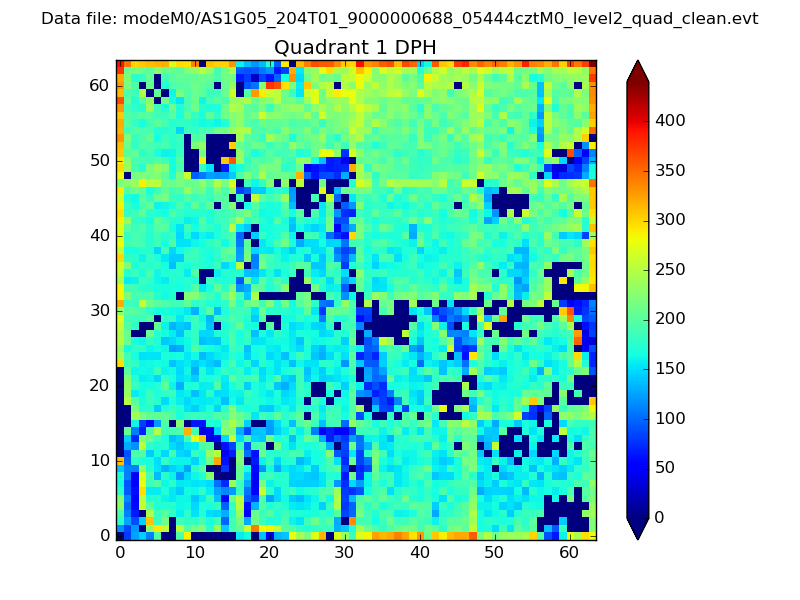 |
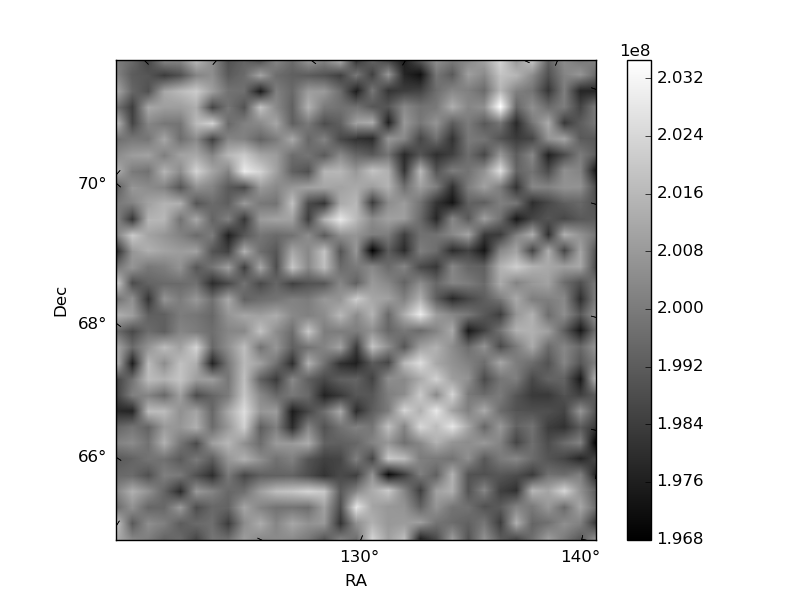
Quadrant B |
|---|---|---|---|
| Quadrant D | 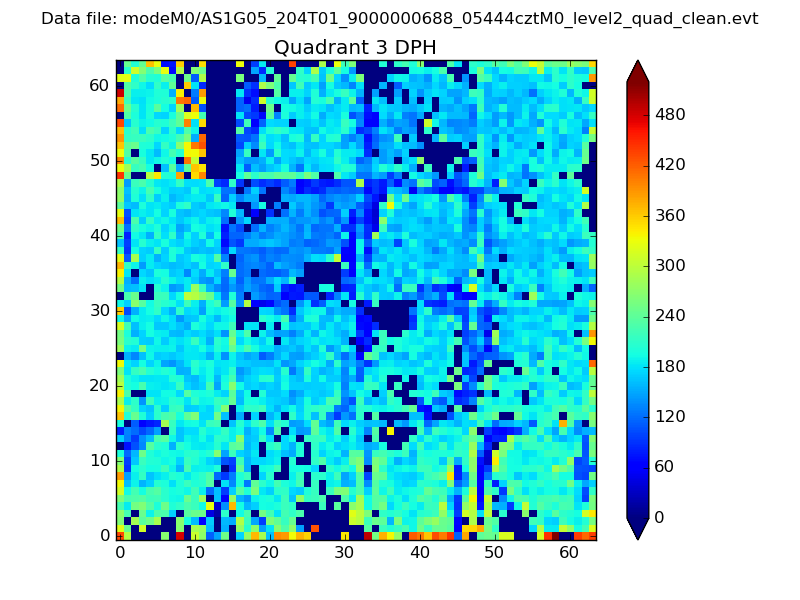 |
 |
Quadrant C |
| Plot type | Count rate plots | Images |
|---|---|---|
| Comparison with Poisson distribution Blue bars denote a histogram of data divided into 1 sec bins. Red curve is a Poisson curve with rate = median count rate of data. |
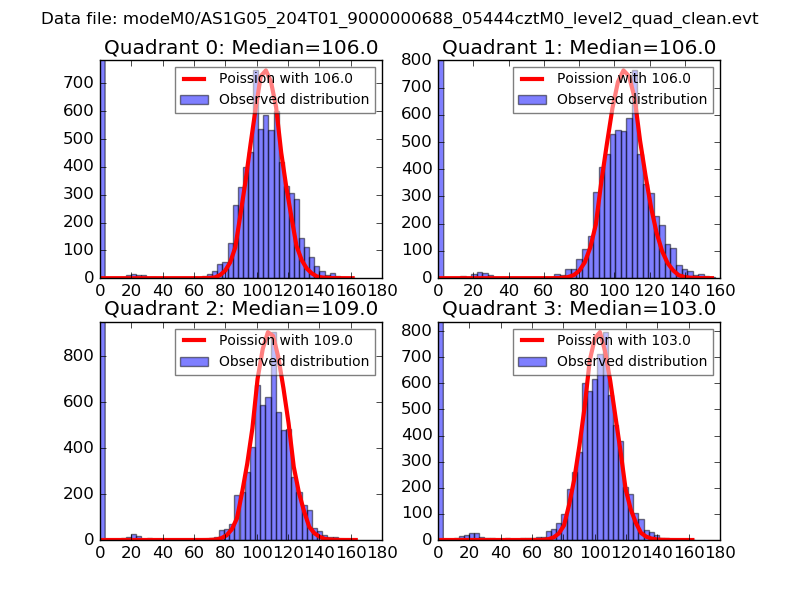 |
 |
| Quadrant-wise count rates Data is divided into 100 sec bins |
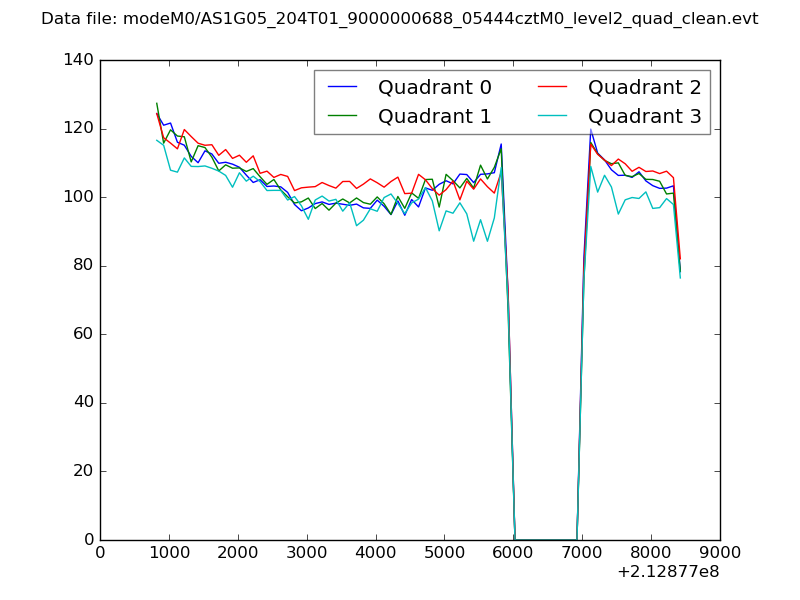 |
|
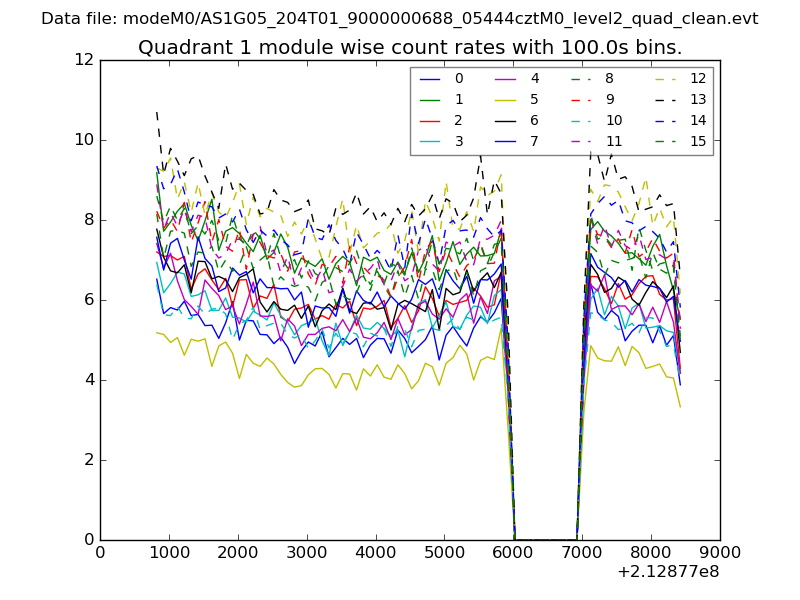
| Module-wise count rates for Quadrant A Data is divided into 100 sec bins |
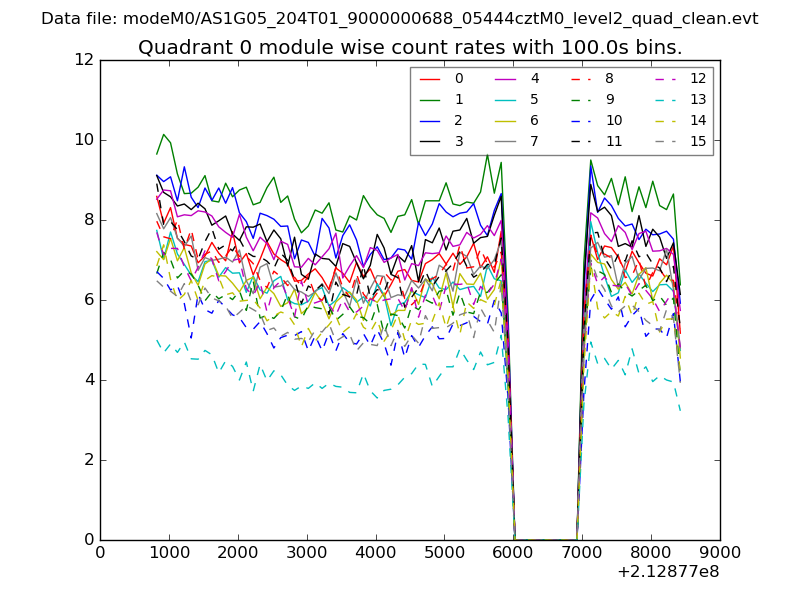 |
 |
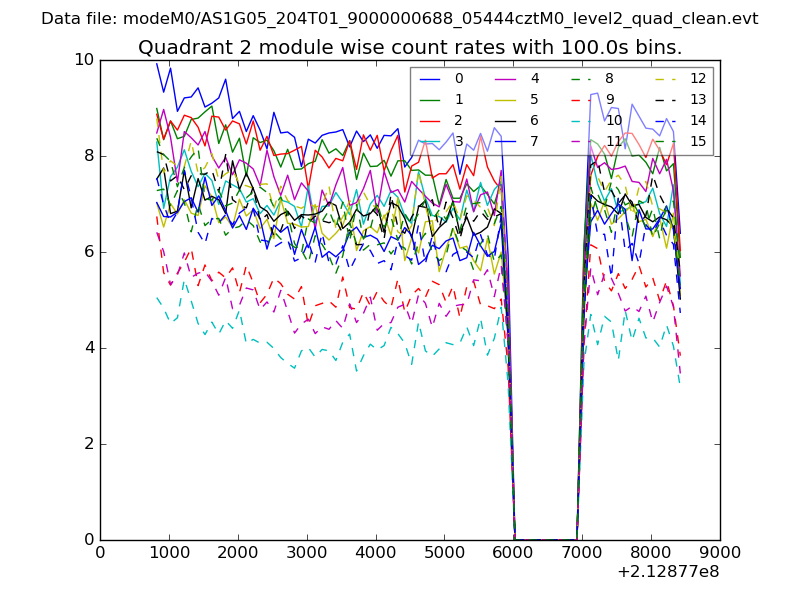
| Module-wise count rates for Quadrant B Data is divided into 100 sec bins |
 |
 |
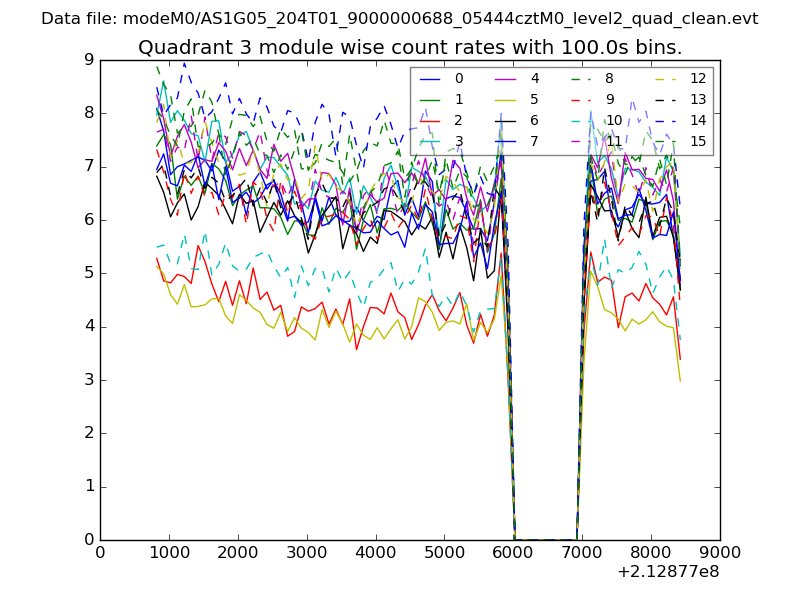
| Module-wise count rates for Quadrant C Data is divided into 100 sec bins |
 |
 |
| Module-wise count rates for Quadrant D Data is divided into 100 sec bins |
 |
 |
| Parameter | Plot |
|---|---|
| CZT HV Monitor | 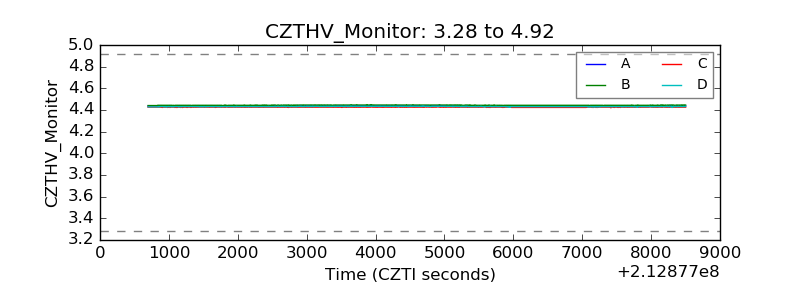 |
| D_VDD | 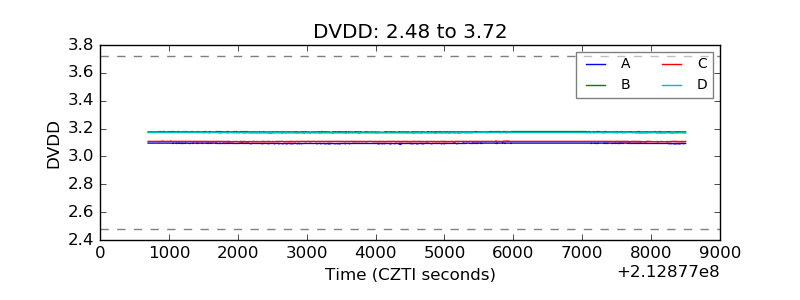 |
| Temperature 1 | 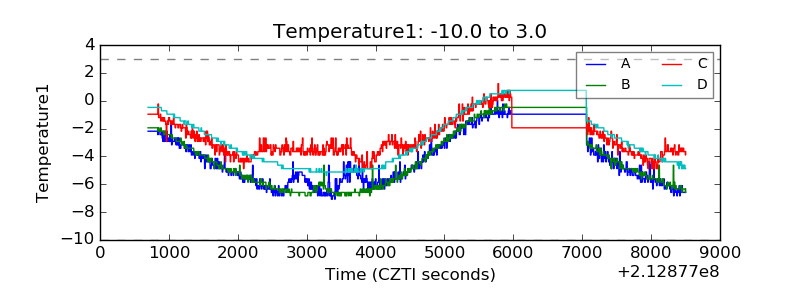 |
| Veto HV Monitor | 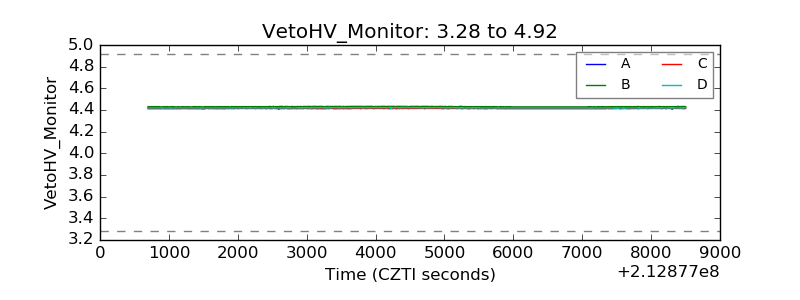 |
| Veto LLD | 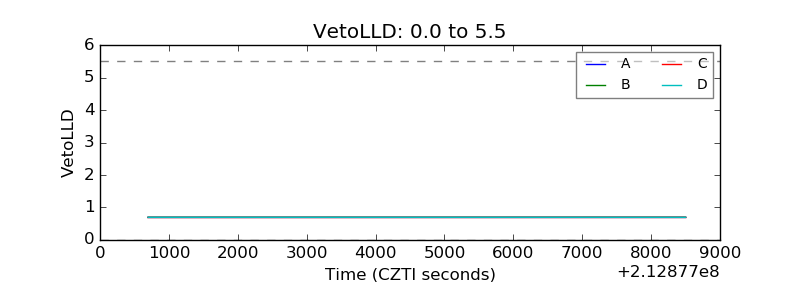 |
| Alpha Counter | 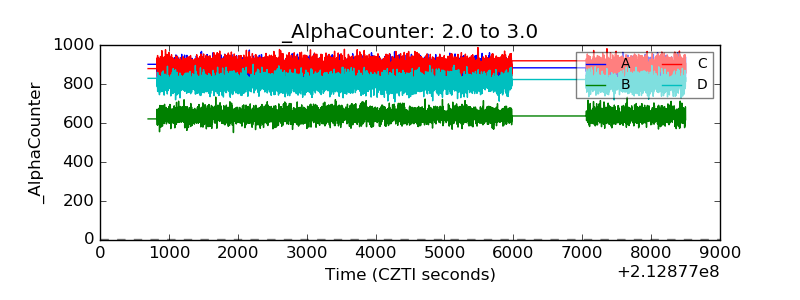 |
| _CPM_Rate | 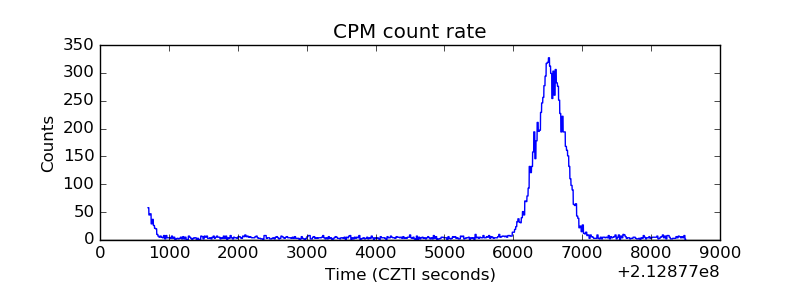 |
| CZT Counter | 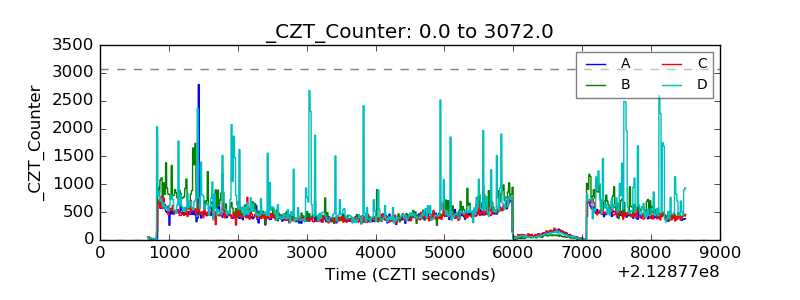 |
| +2.5 Volts monitor |  |
| +5 Volts monitor |  |
| _ROLL_ROT | 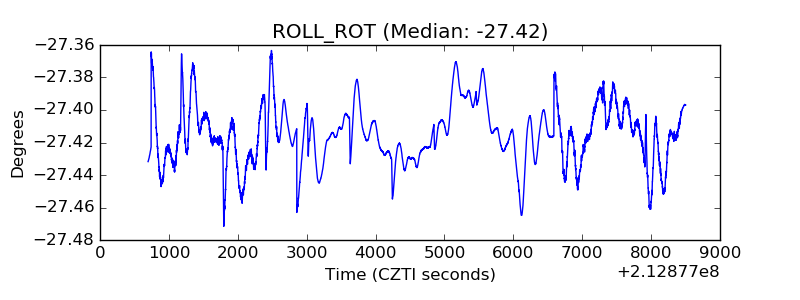 |
| _Roll_DEC | 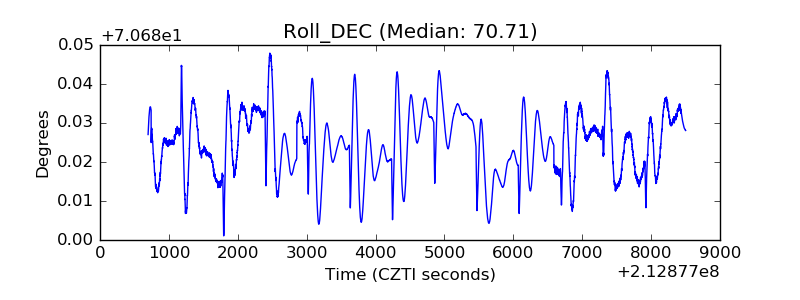 |
| _Roll_RA | 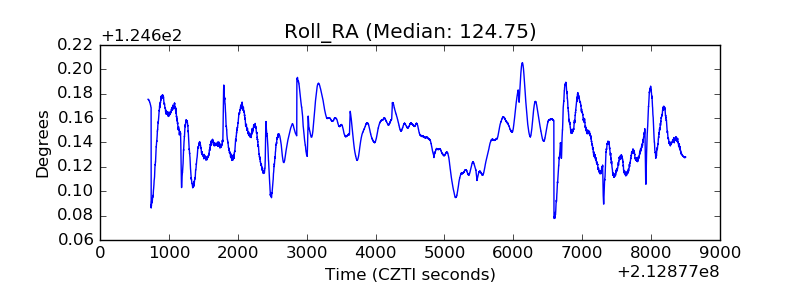 |
| Veto Counter | 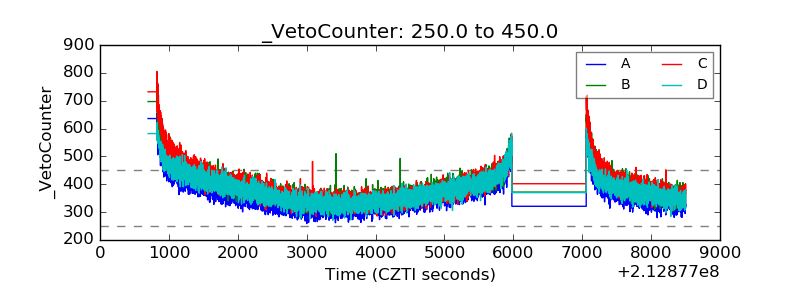 |