| Param | Original file | Final file |
|---|---|---|
| Filename | modeM0/AS1G05_204T01_9000000688_05446cztM0_level2.evt | modeM0/AS1G05_204T01_9000000688_05446cztM0_level2_quad_clean.evt |
| Size (bytes) | 590,837,760 | 121,809,600 |
| Size | 563.5 MB | 116.2 MB |
| Events in quadrant A | 3,468,100 | 797,813 |
| Events in quadrant B | 4,360,572 | 793,902 |
| Events in quadrant C | 3,415,593 | 809,215 |
| Events in quadrant D | 6,120,533 | 745,864 |
| Mode M0 | |||
|---|---|---|---|
| Quadrant | BADHDUFLAG | Total packets | Discarded packets |
| A | 0 | 16269 | 32 |
| B | 0 | 18848 | 50 |
| C | 0 | 16116 | 41 |
| D | 0 | 23849 | 145 |
| Mode SS | |||
|---|---|---|---|
| Quadrant | BADHDUFLAG | Total packets | Discarded packets |
| A | 0 | 160 | 0 |
| B | 0 | 160 | 0 |
| C | 0 | 160 | 0 |
| D | 0 | 160 | 0 |
| Mode M9 | |||
|---|---|---|---|
| Quadrant | BADHDUFLAG | Total packets | Discarded packets |
| A | 0 | 2 | 0 |
| B | 0 | 2 | 0 |
| C | 0 | 2 | 0 |
| D | 0 | 2 | 0 |
| Quadrant | Total seconds | Saturated seconds | Saturation percentage |
|---|---|---|---|
| A | 7804 | 49 | 0.627883% |
| B | 7798 | 207 | 2.654527% |
| C | 7799 | 34 | 0.435953% |
| D | 7789 | 541 | 6.945693% |
Noise dominated data is calculated using 1-second bins in cleaned event files. If a bin has >2000 counts, and if more than 50% of those come from <1% of pixels, then it is considered to be noise-dominated and hence unusable.
| Quadrant | # 1 sec bins | Bins with >0 counts | Bins with >2000 counts | High rate bins dominated by noise | Noise dominated (total time) | Noise dominated (detector-on time) | Marked lightcurve |
|---|---|---|---|---|---|---|---|
| A | 7954 | 7821 | 3 | 3 | 0.04% | 0.04% |  |
| B | 7954 | 7821 | 25 | 25 | 0.31% | 0.32% |  |
| C | 7954 | 7822 | 0 | 0 | 0.00% | 0.00% |  |
| D | 7954 | 7821 | 540 | 540 | 6.79% | 6.90% |  |
Top three noisy pixels from each quadrant. If the there are fewer than three noisy pixels in the level2.evt file, extra rows are filled as -1
| Pixel properties | Quadrant properties | ||||||
|---|---|---|---|---|---|---|---|
| Quadrant | DetID | PixID | Counts | Sigma | Mean | Median | Sigma |
| A | 0 | 50 | 46273 | 251.8 | 880 | 858 | 180.4 |
| A | 13 | 6 | 12903 | 66.78 | 880 | 858 | 180.4 |
| A | 10 | 229 | 12450 | 64.27 | 880 | 858 | 180.4 |
| B | 15 | 204 | 574066 | 3365.51 | 889 | 867 | 170.3 |
| B | 4 | 48 | 112661 | 656.39 | 889 | 867 | 170.3 |
| B | 11 | 51 | 88923 | 517.02 | 889 | 867 | 170.3 |
| C | 8 | 128 | 11565 | 53.63 | 865 | 867 | 199.5 |
| C | 12 | 4 | 7215 | 31.82 | 865 | 867 | 199.5 |
| C | 13 | 61 | 7050 | 31.0 | 865 | 867 | 199.5 |
| D | 2 | 33 | 2619966 | 12812.47 | 840 | 813 | 204.4 |
| D | 2 | 152 | 113179 | 549.68 | 840 | 813 | 204.4 |
| D | 4 | 95 | 80612 | 390.36 | 840 | 813 | 204.4 |
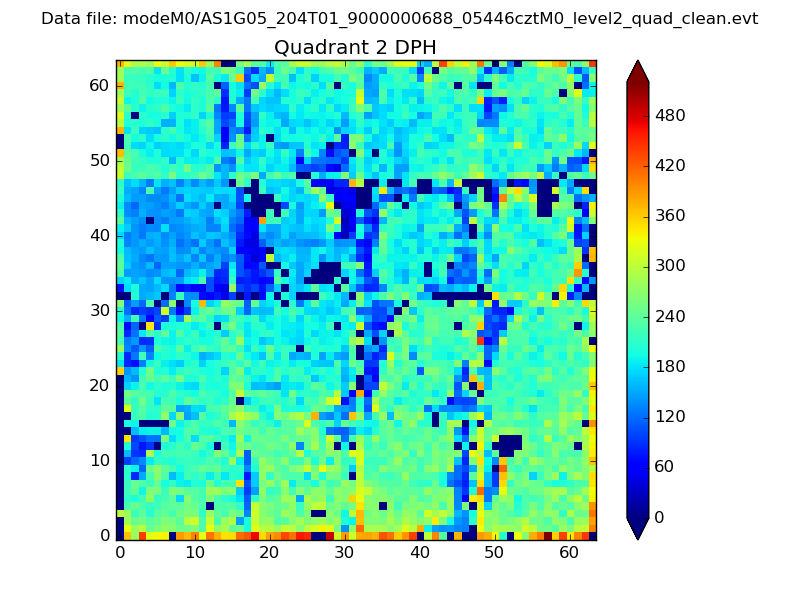
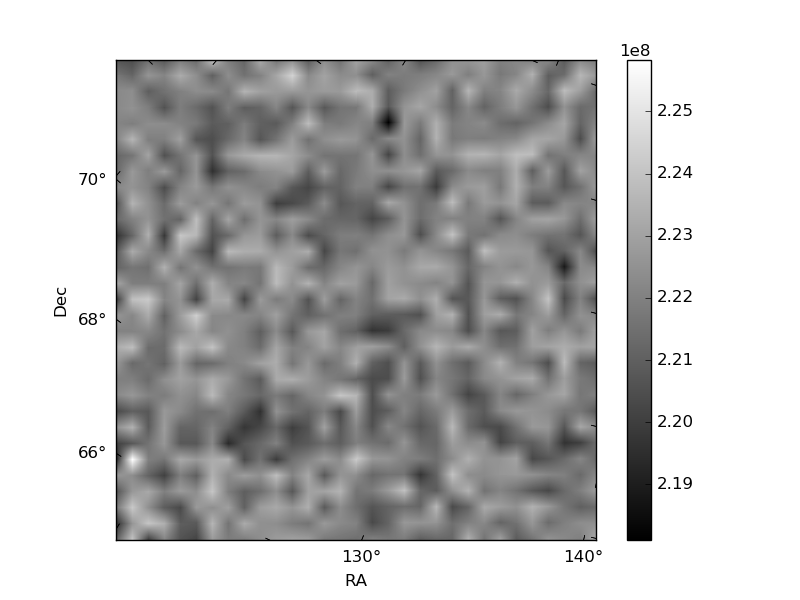
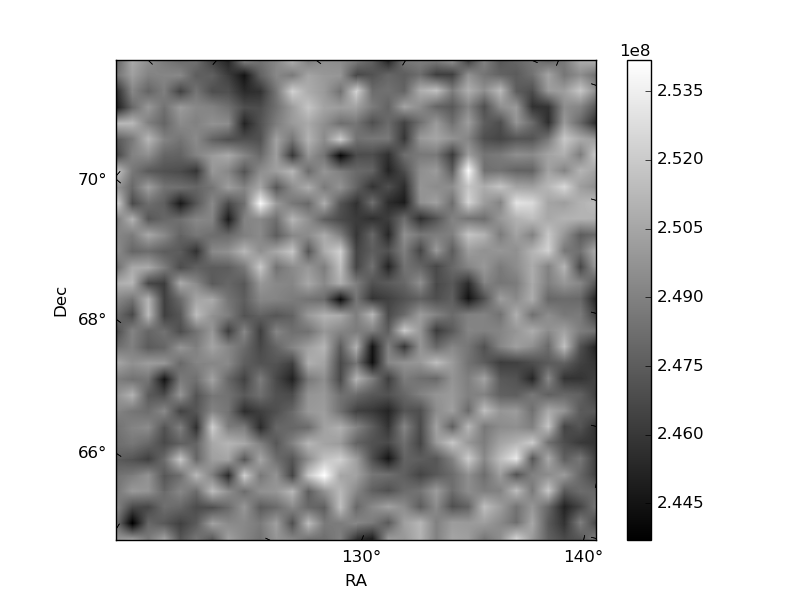
Histogram calculated using DETX and DETY for each event in the final _common_clean file
| Quadrant A | 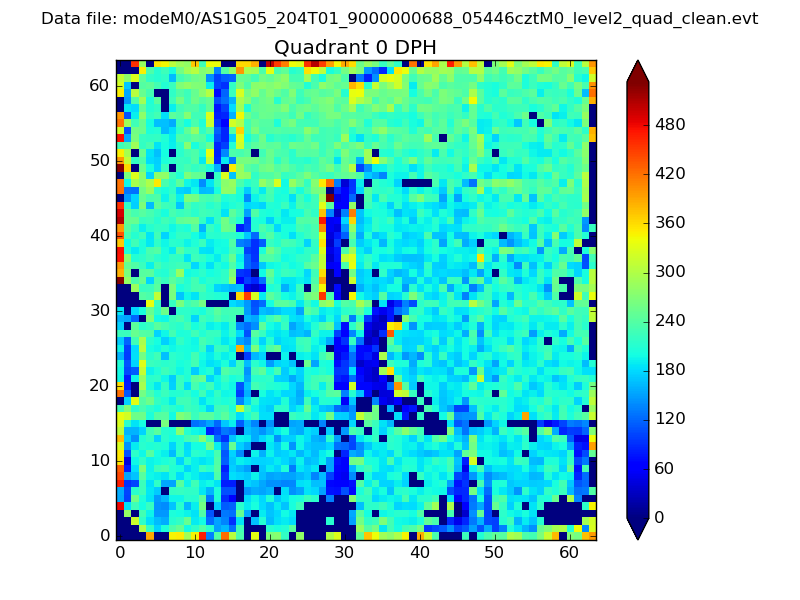 |
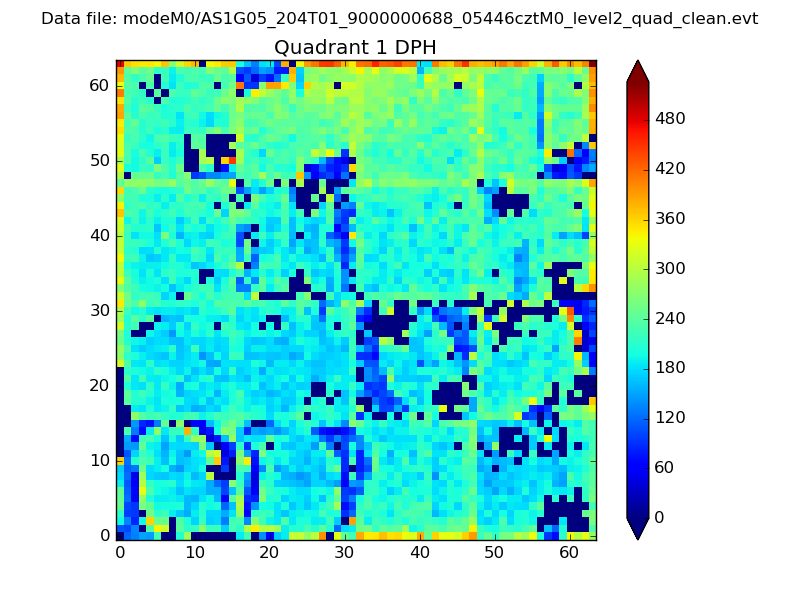 |
Quadrant B |
|---|---|---|---|
| Quadrant D | 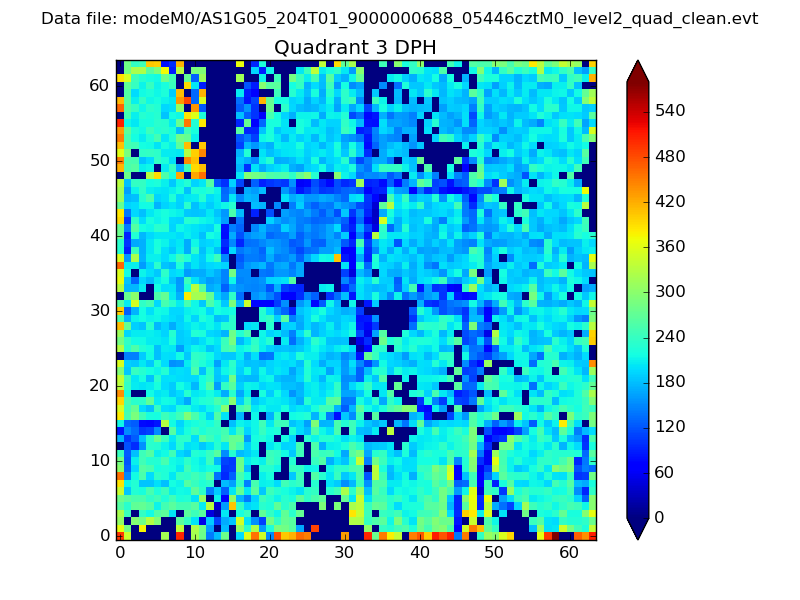 |
 |
Quadrant C |
| Plot type | Count rate plots | Images |
|---|---|---|
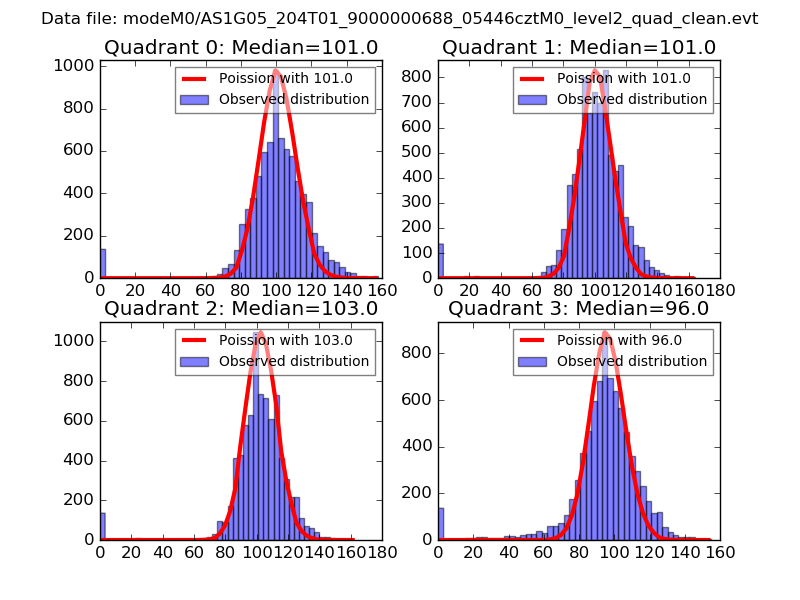
| Comparison with Poisson distribution Blue bars denote a histogram of data divided into 1 sec bins. Red curve is a Poisson curve with rate = median count rate of data. |
 |
 |
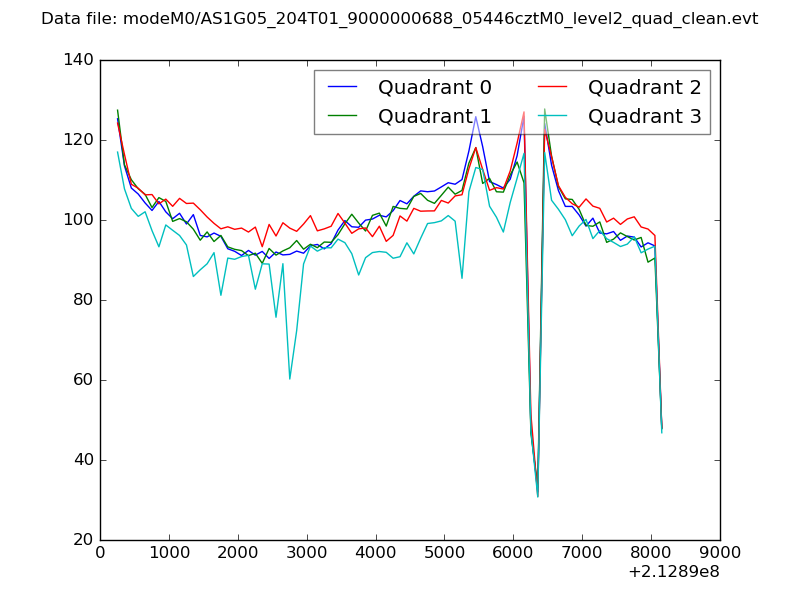
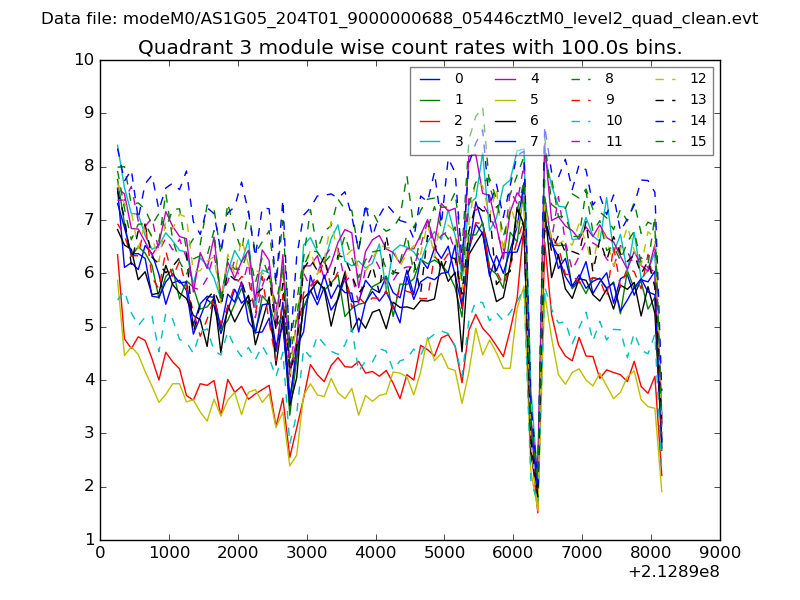
| Quadrant-wise count rates Data is divided into 100 sec bins |
 |
|
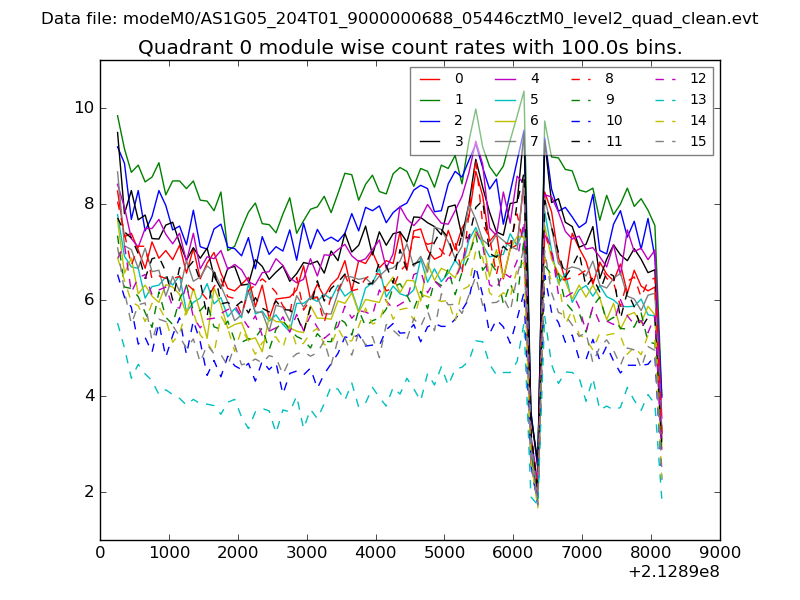
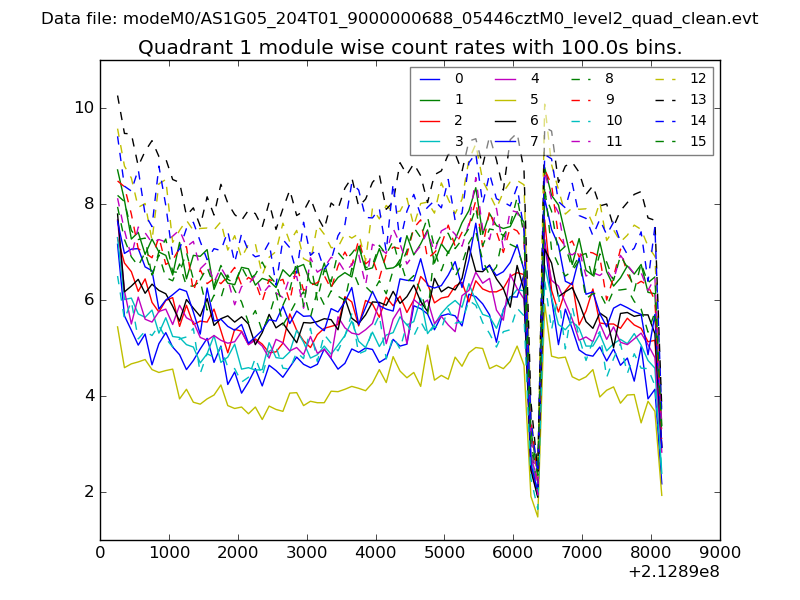
| Module-wise count rates for Quadrant A Data is divided into 100 sec bins |
 |
 |
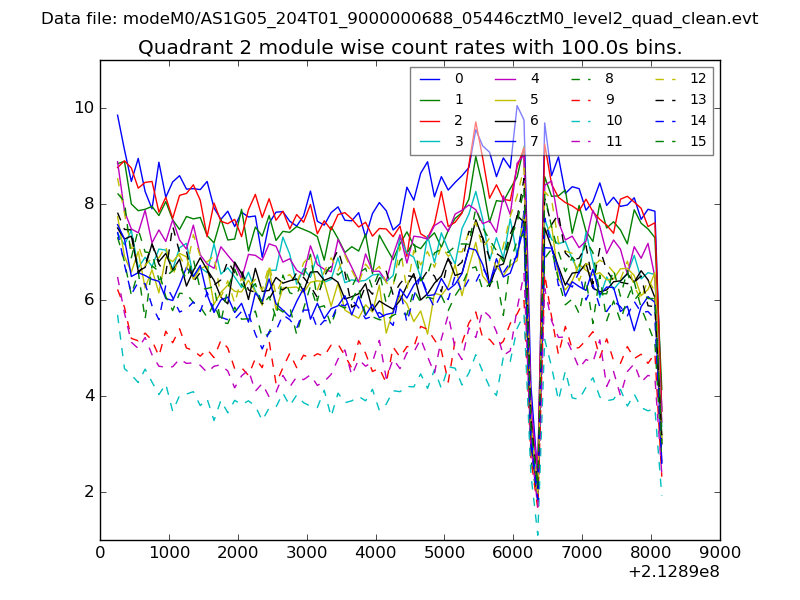
| Module-wise count rates for Quadrant B Data is divided into 100 sec bins |
 |
 |
| Module-wise count rates for Quadrant C Data is divided into 100 sec bins |
 |
 |
| Module-wise count rates for Quadrant D Data is divided into 100 sec bins |
 |
 |
| Parameter | Plot |
|---|---|
| CZT HV Monitor | 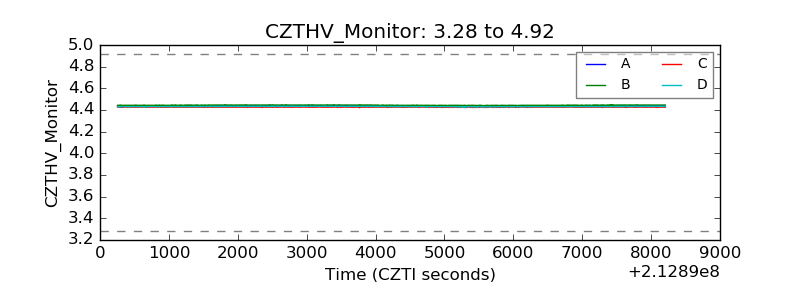 |
| D_VDD | 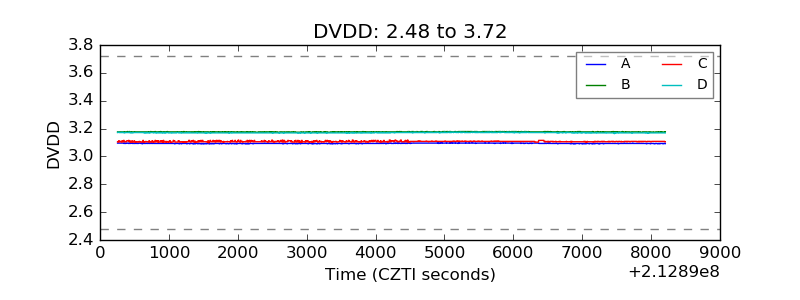 |
| Temperature 1 | 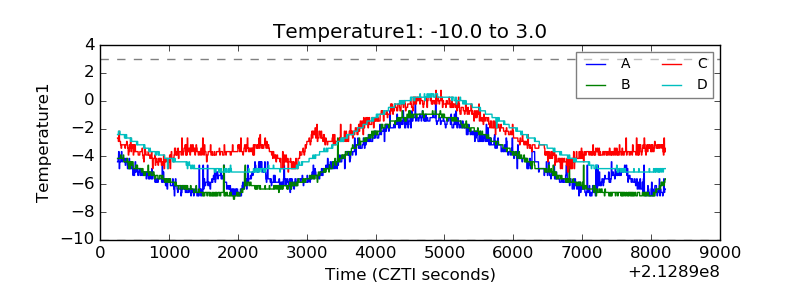 |
| Veto HV Monitor | 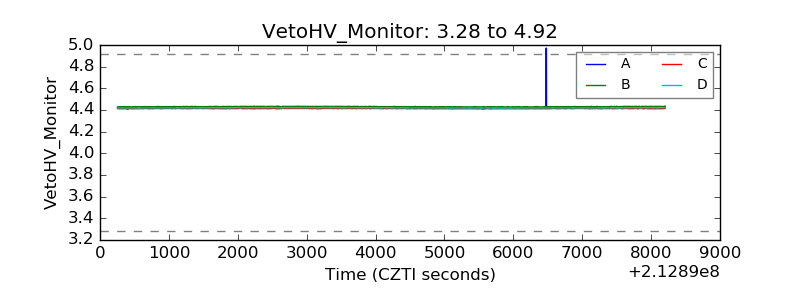 |
| Veto LLD | 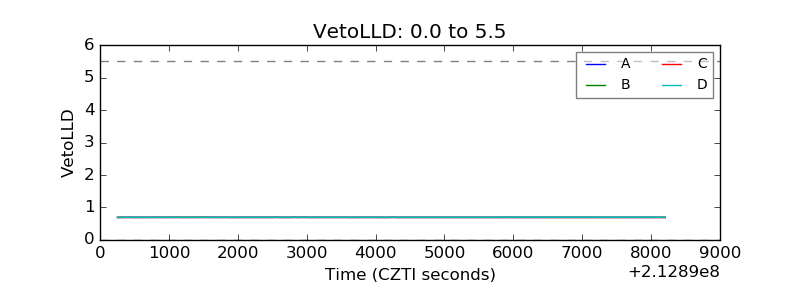 |
| Alpha Counter | 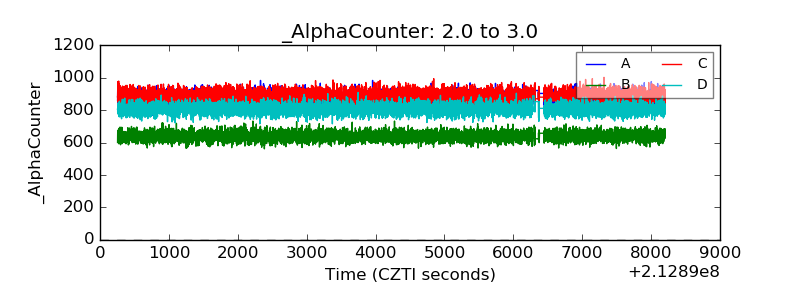 |
| _CPM_Rate | 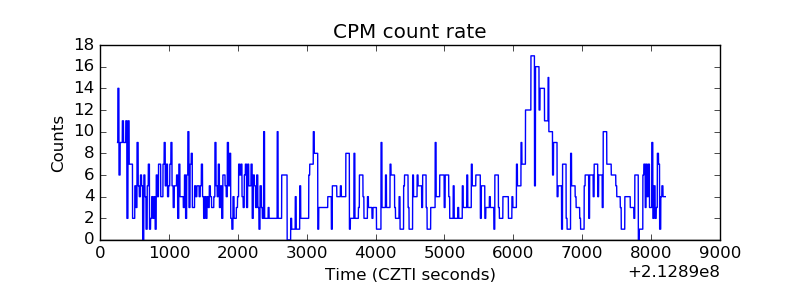 |
| CZT Counter | 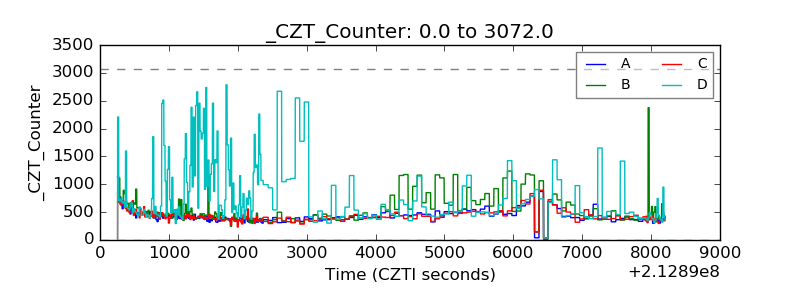 |
| +2.5 Volts monitor |  |
| +5 Volts monitor |  |
| _ROLL_ROT | 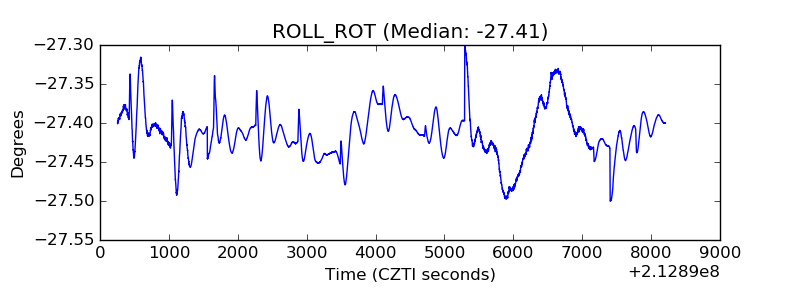 |
| _Roll_DEC | 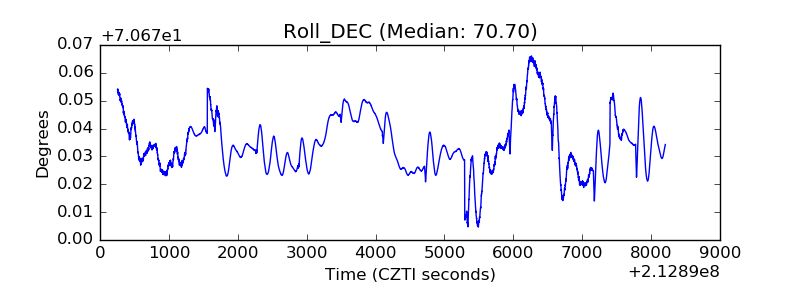 |
| _Roll_RA | 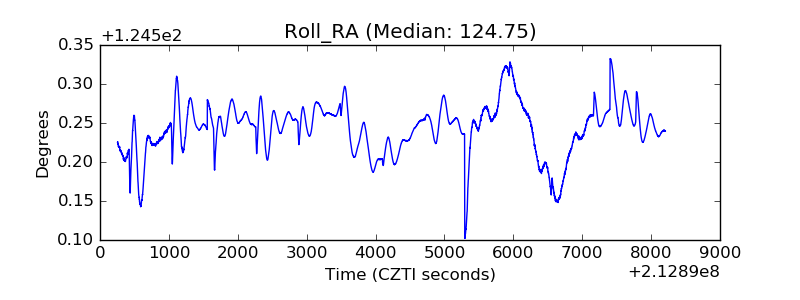 |
| Veto Counter | 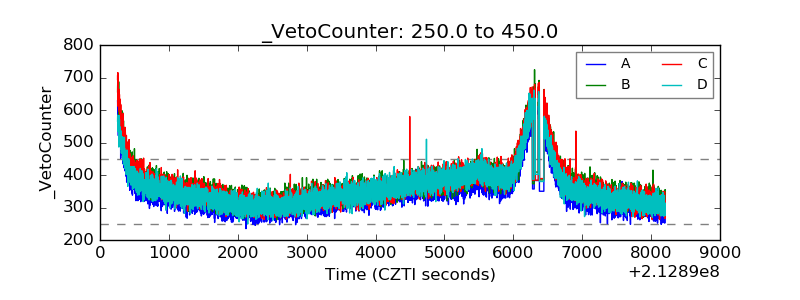 |