| Param | Original file | Final file |
|---|---|---|
| Filename | modeM0/AS1G05_204T01_9000000688_05448cztM0_level2.evt | modeM0/AS1G05_204T01_9000000688_05448cztM0_level2_quad_clean.evt |
| Size (bytes) | 78,598,080 | 20,070,720 |
| Size | 75.0 MB | 19.1 MB |
| Events in quadrant A | 506,633 | 123,864 |
| Events in quadrant B | 542,644 | 127,142 |
| Events in quadrant C | 510,551 | 132,508 |
| Events in quadrant D | 724,919 | 122,374 |
| Mode M0 | |||
|---|---|---|---|
| Quadrant | BADHDUFLAG | Total packets | Discarded packets |
| A | 0 | 3879 | 1220 |
| B | 0 | 3931 | 1191 |
| C | 0 | 3885 | 1168 |
| D | 0 | 4597 | 1391 |
| Mode SS | |||
|---|---|---|---|
| Quadrant | BADHDUFLAG | Total packets | Discarded packets |
| A | 0 | 38 | 10 |
| B | 0 | 38 | 8 |
| C | 0 | 38 | 6 |
| D | 0 | 38 | 8 |
| Quadrant | Total seconds | Saturated seconds | Saturation percentage |
|---|---|---|---|
| A | 1331 | 0 | 0.000000% |
| B | 1349 | 3 | 0.222387% |
| C | 1358 | 0 | 0.000000% |
| D | 1321 | 14 | 1.059803% |
Noise dominated data is calculated using 1-second bins in cleaned event files. If a bin has >2000 counts, and if more than 50% of those come from <1% of pixels, then it is considered to be noise-dominated and hence unusable.
| Quadrant | # 1 sec bins | Bins with >0 counts | Bins with >2000 counts | High rate bins dominated by noise | Noise dominated (total time) | Noise dominated (detector-on time) | Marked lightcurve |
|---|---|---|---|---|---|---|---|
| A | 1836 | 1559 | 0 | 0 | 0.00% | 0.00% | 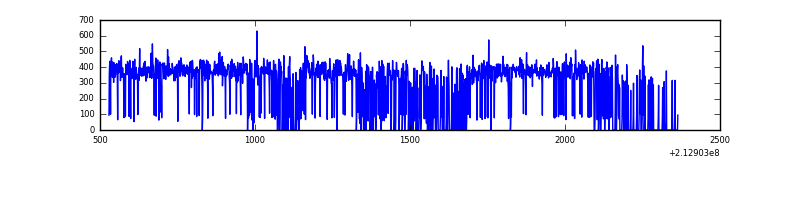 |
| B | 1946 | 1593 | 1 | 1 | 0.05% | 0.06% | 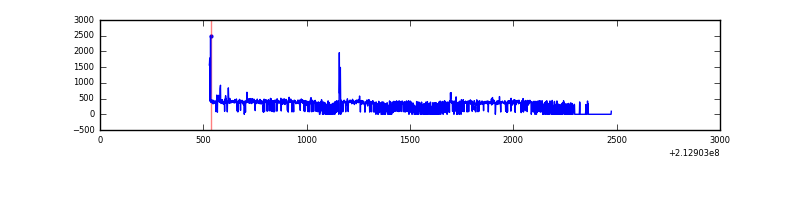 |
| C | 1927 | 1611 | 0 | 0 | 0.00% | 0.00% | 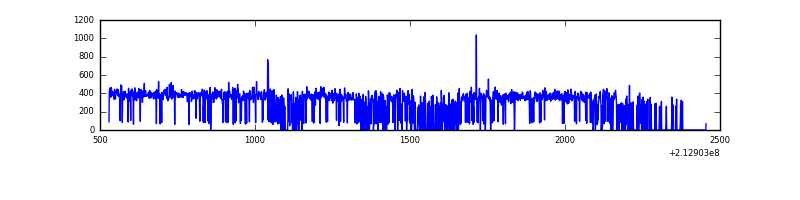 |
| D | 1933 | 1563 | 12 | 12 | 0.62% | 0.77% | 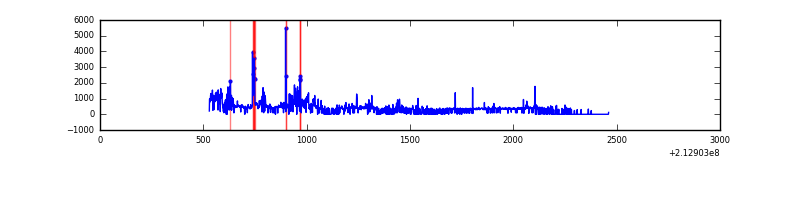 |
Top three noisy pixels from each quadrant. If the there are fewer than three noisy pixels in the level2.evt file, extra rows are filled as -1
| Pixel properties | Quadrant properties | ||||||
|---|---|---|---|---|---|---|---|
| Quadrant | DetID | PixID | Counts | Sigma | Mean | Median | Sigma |
| A | 13 | 6 | 2067 | 67.13 | 130 | 128 | 28.9 |
| A | 0 | 226 | 1237 | 38.4 | 130 | 128 | 28.9 |
| A | 12 | 194 | 1215 | 37.63 | 130 | 128 | 28.9 |
| B | 4 | 48 | 15146 | 538.92 | 134 | 131 | 27.9 |
| B | 0 | 219 | 3868 | 134.13 | 134 | 131 | 27.9 |
| B | 10 | 245 | 2904 | 99.53 | 134 | 131 | 27.9 |
| C | 8 | 128 | 3274 | 98.52 | 128 | 129 | 31.9 |
| C | 8 | 112 | 1567 | 45.05 | 128 | 129 | 31.9 |
| C | 12 | 4 | 1501 | 42.98 | 128 | 129 | 31.9 |
| D | 2 | 33 | 201349 | 6339.03 | 122 | 118 | 31.7 |
| D | 8 | 195 | 24463 | 766.9 | 122 | 118 | 31.7 |
| D | 4 | 95 | 18959 | 593.52 | 122 | 118 | 31.7 |
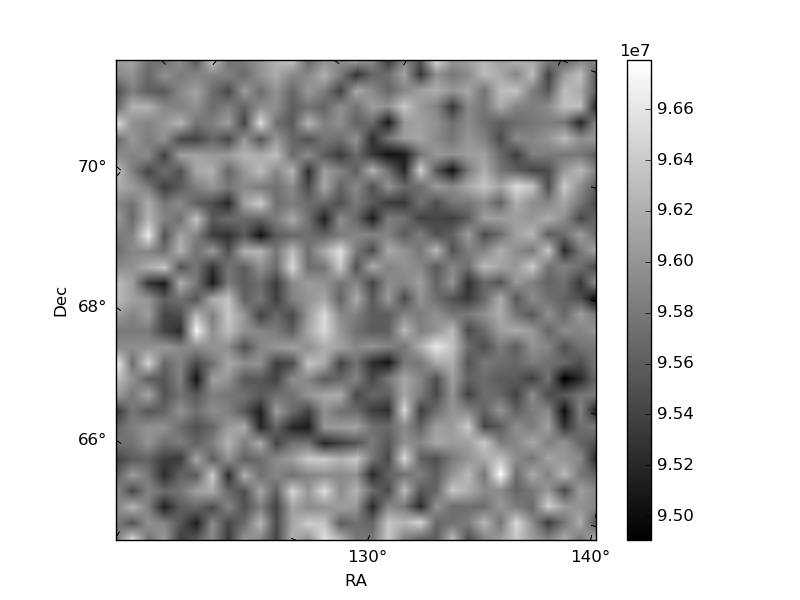
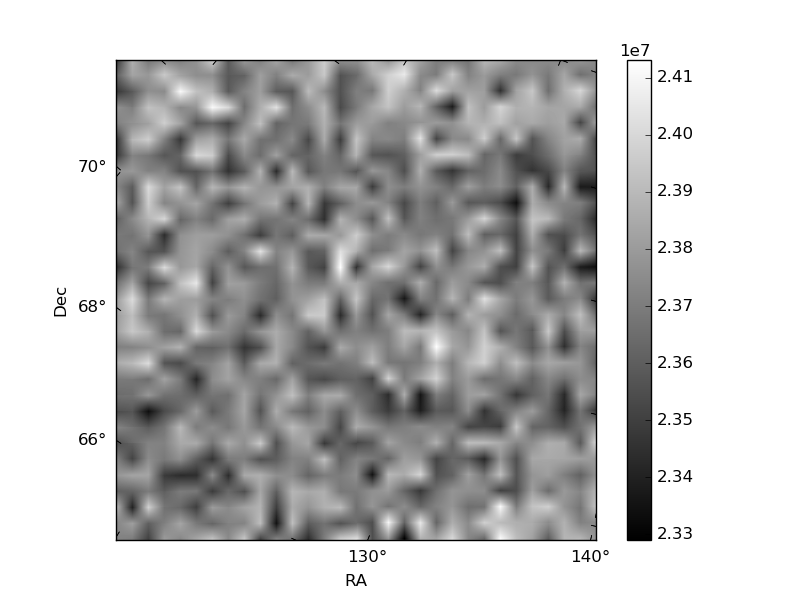
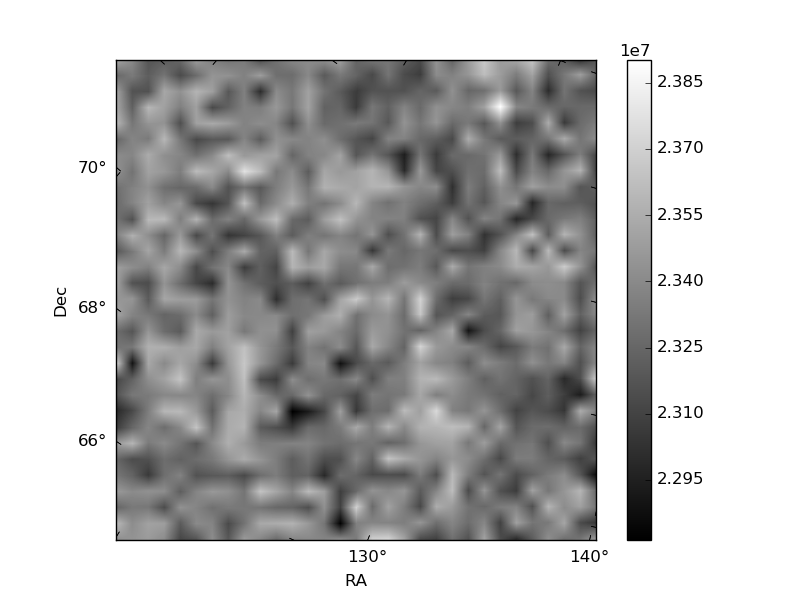
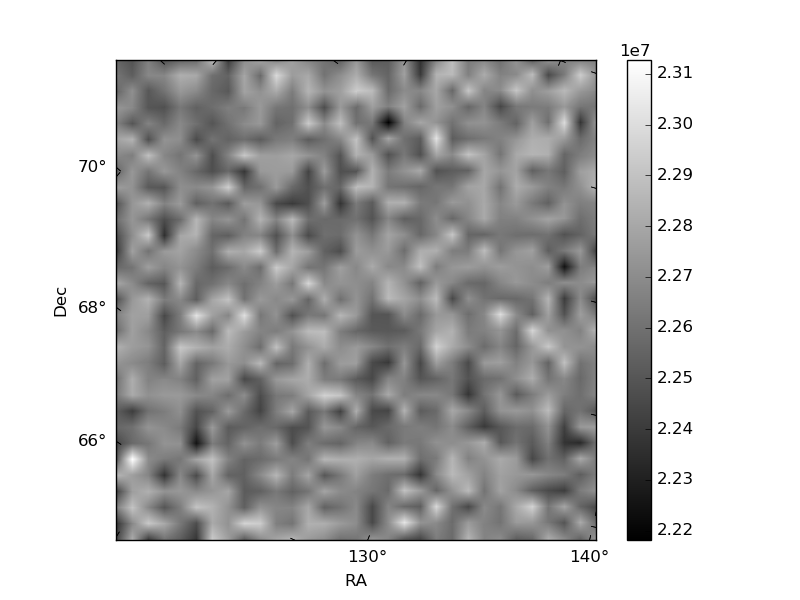
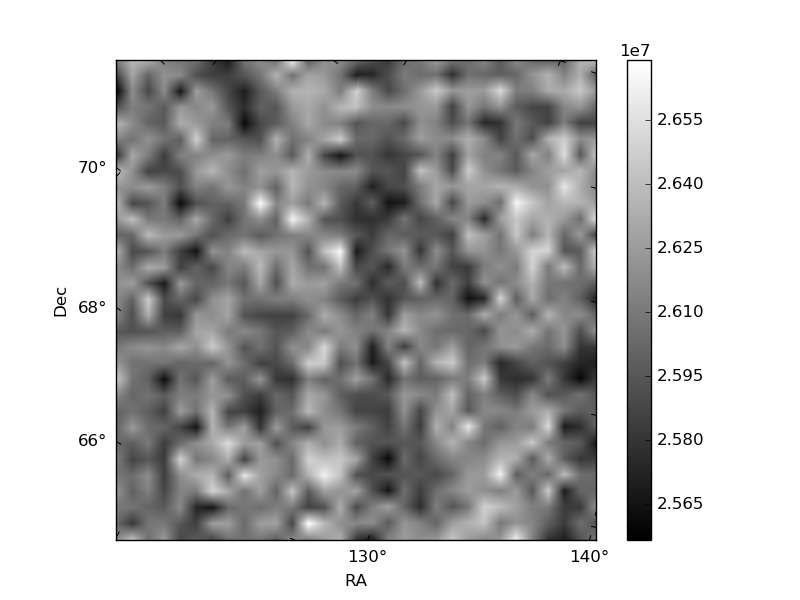
Histogram calculated using DETX and DETY for each event in the final _common_clean file
| Quadrant A | 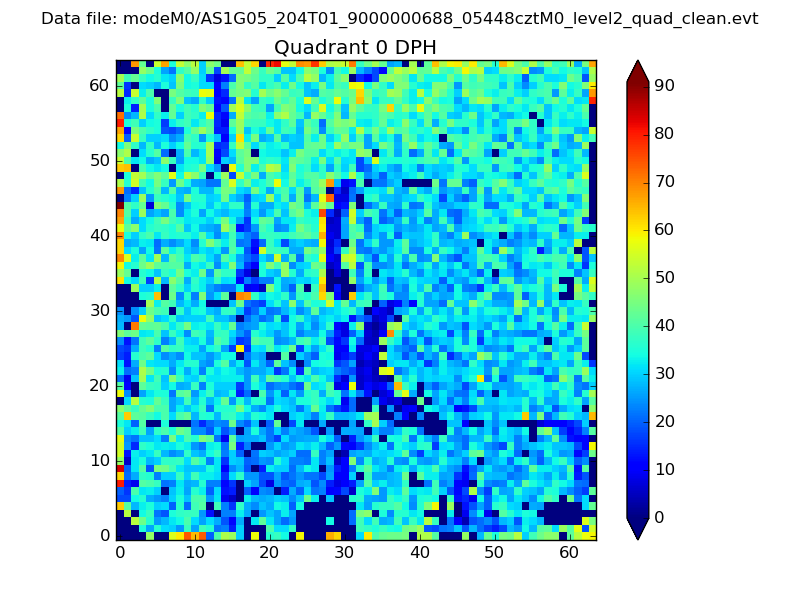 |
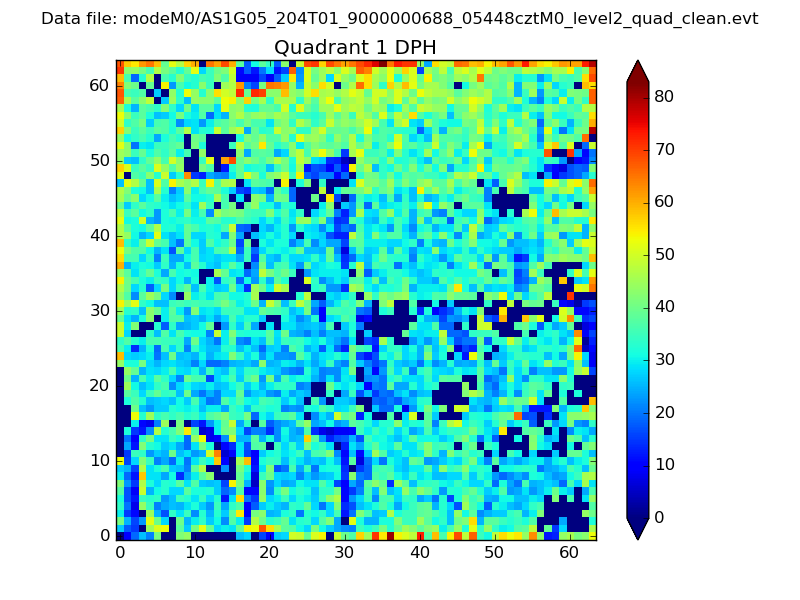 |
Quadrant B |
|---|---|---|---|
| Quadrant D | 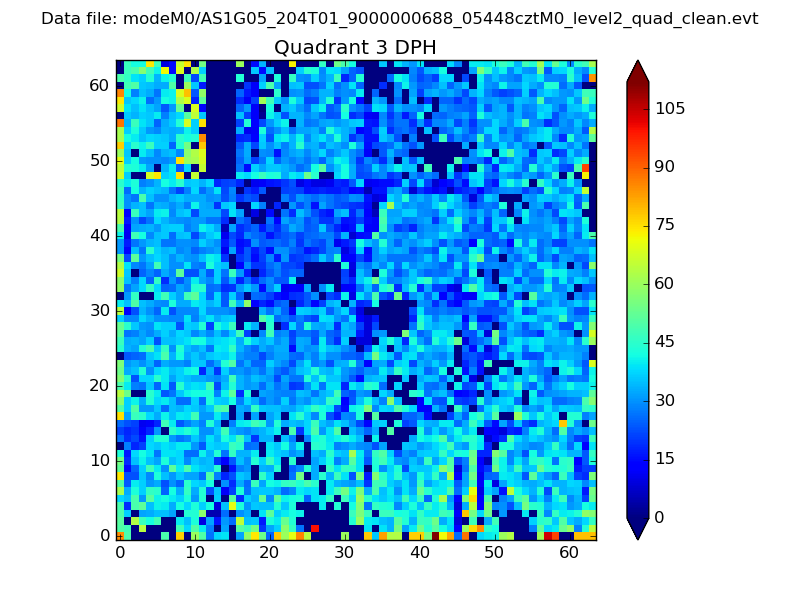 |
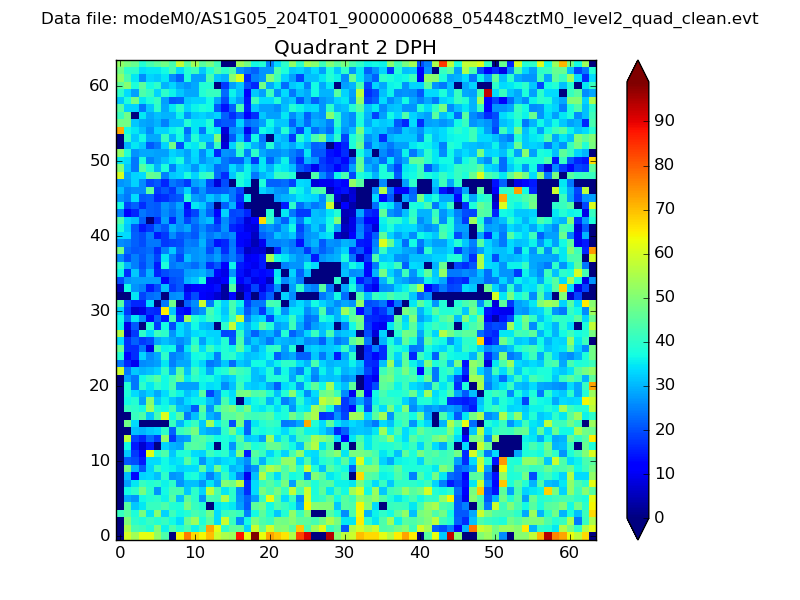 |
Quadrant C |
| Plot type | Count rate plots | Images |
|---|---|---|
| Comparison with Poisson distribution Blue bars denote a histogram of data divided into 1 sec bins. Red curve is a Poisson curve with rate = median count rate of data. |
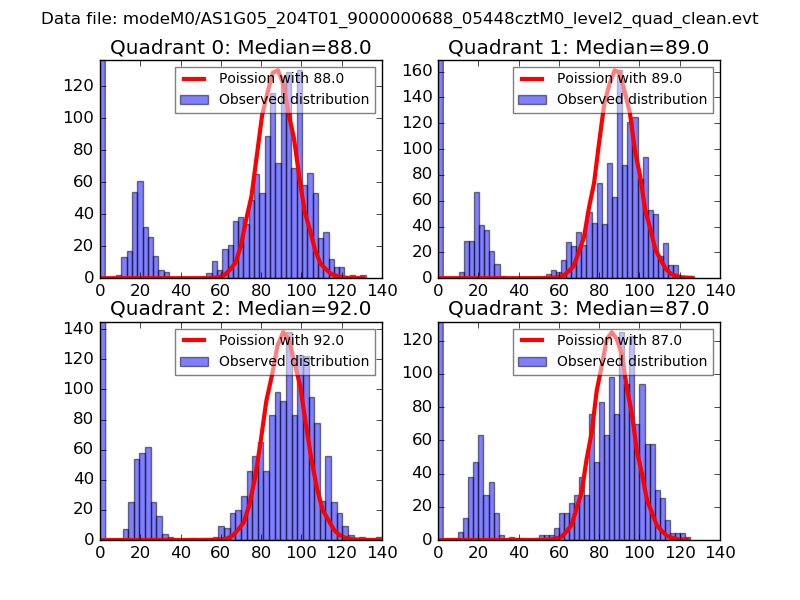 |
 |
| Quadrant-wise count rates Data is divided into 100 sec bins |
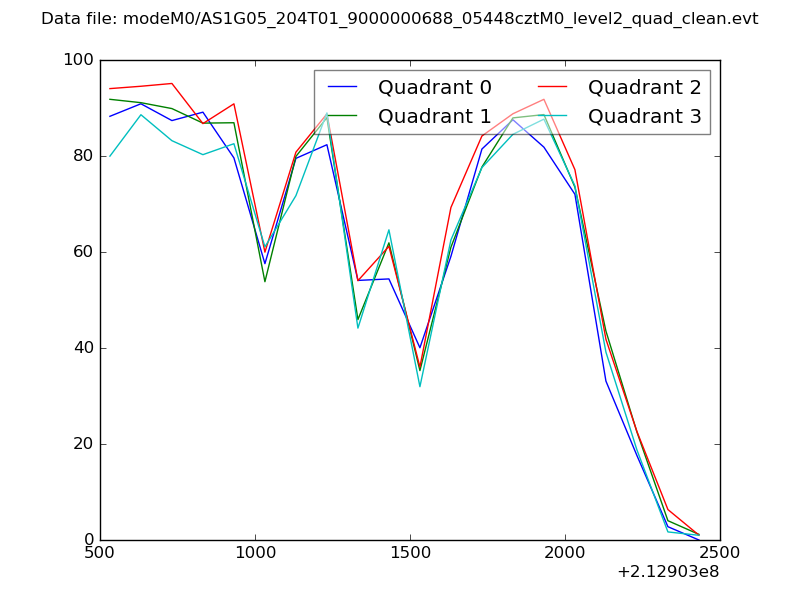 |
|
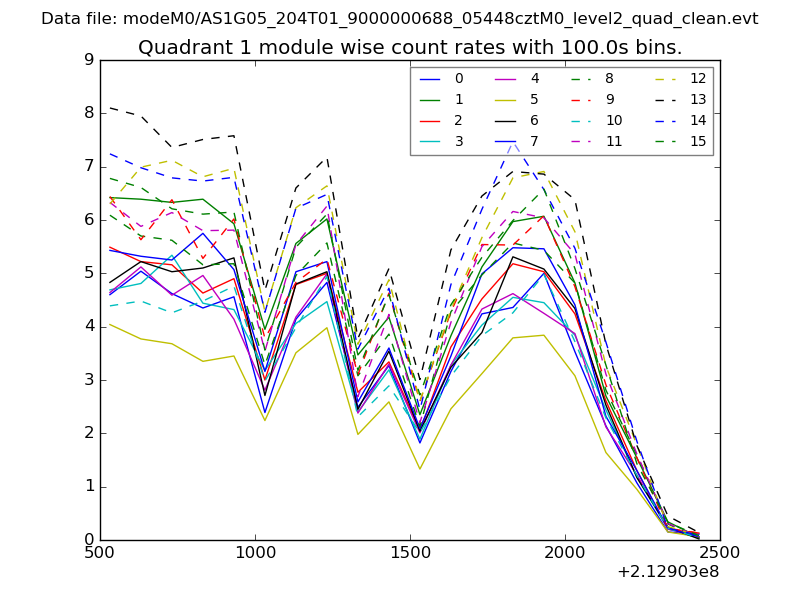
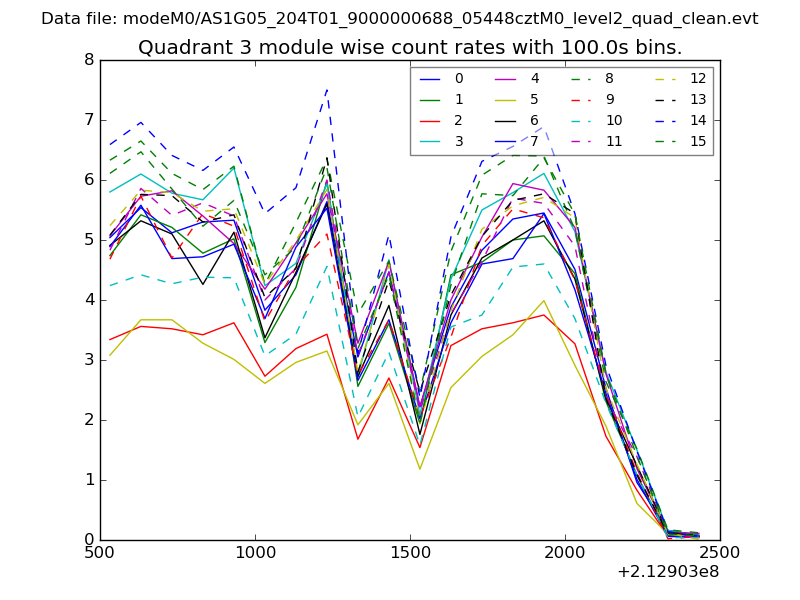
| Module-wise count rates for Quadrant A Data is divided into 100 sec bins |
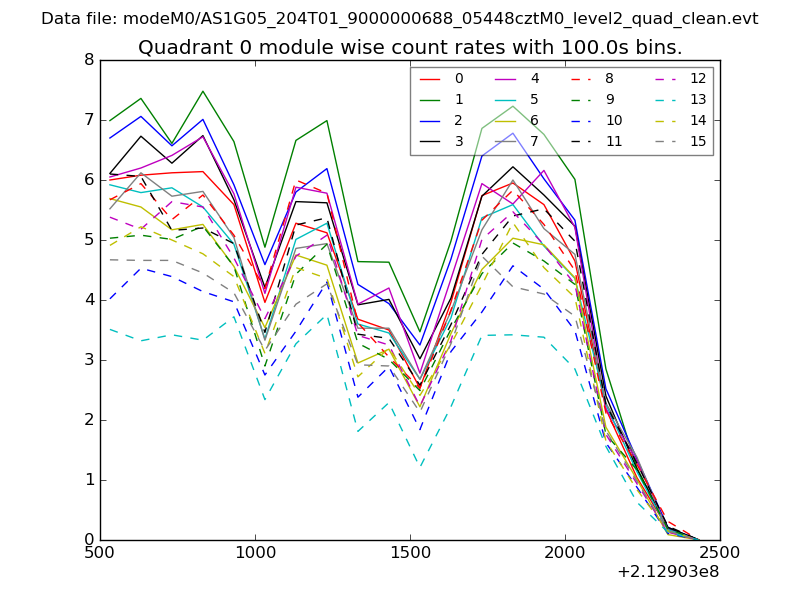 |
 |
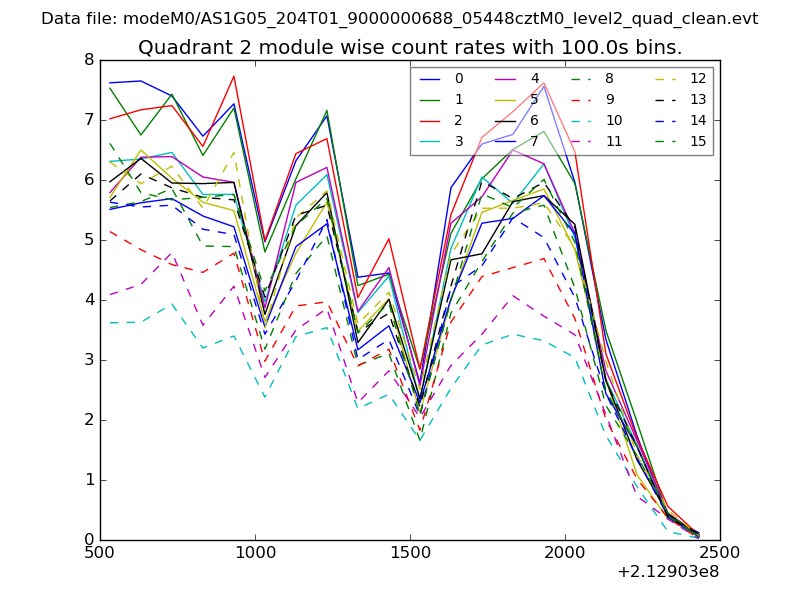
| Module-wise count rates for Quadrant B Data is divided into 100 sec bins |
 |
 |
| Module-wise count rates for Quadrant C Data is divided into 100 sec bins |
 |
 |
| Module-wise count rates for Quadrant D Data is divided into 100 sec bins |
 |
 |
| Parameter | Plot |
|---|---|
| CZT HV Monitor | 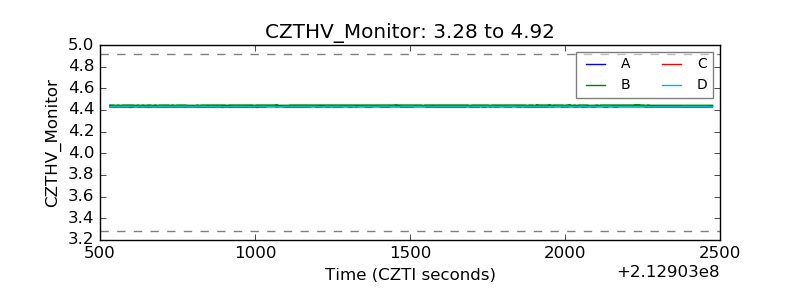 |
| D_VDD | 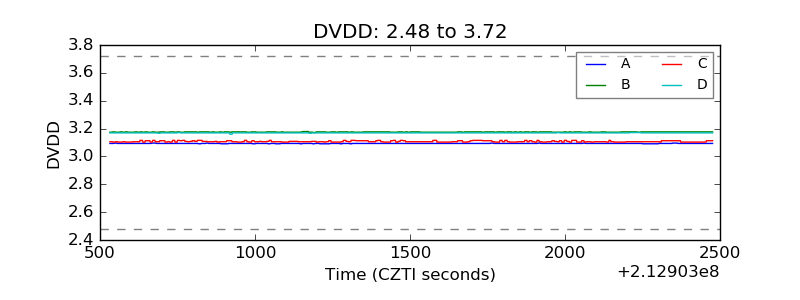 |
| Temperature 1 |  |
| Veto HV Monitor | 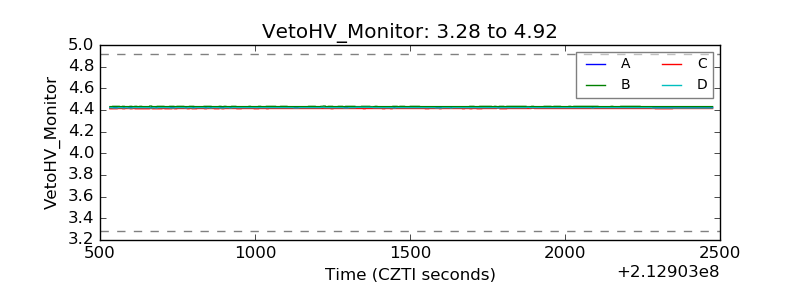 |
| Veto LLD | 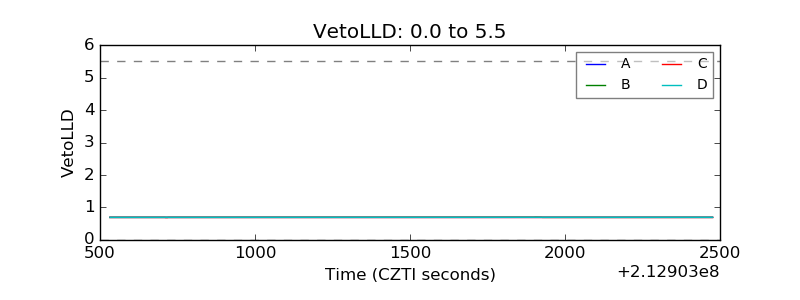 |
| Alpha Counter | 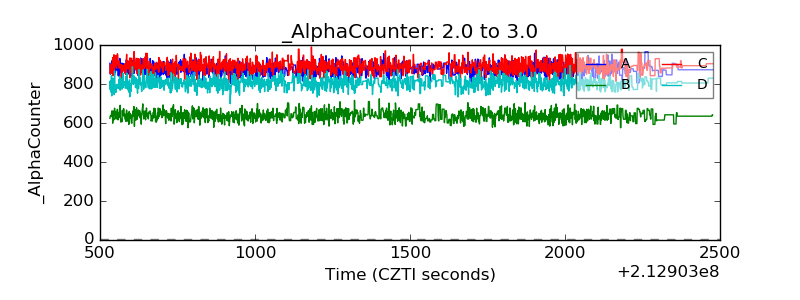 |
| _CPM_Rate | 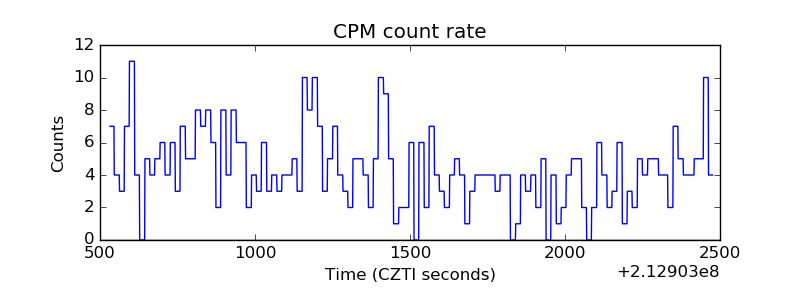 |
| CZT Counter | 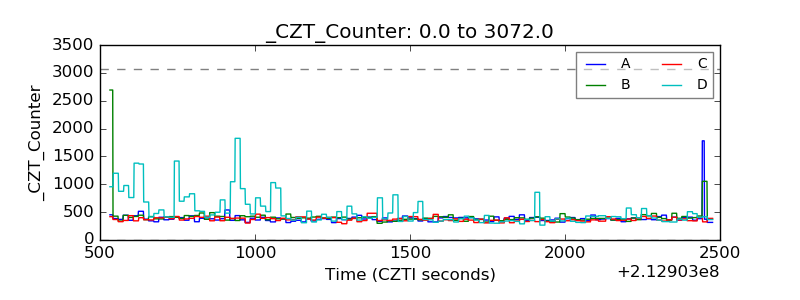 |
| +2.5 Volts monitor |  |
| +5 Volts monitor |  |
| _ROLL_ROT | 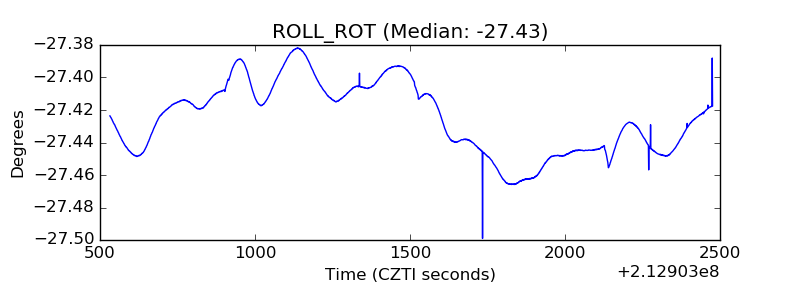 |
| _Roll_DEC | 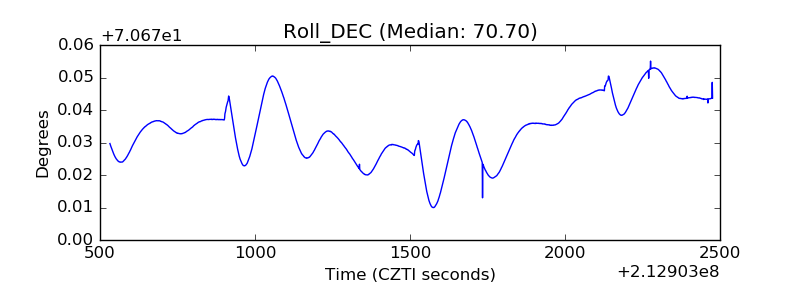 |
| _Roll_RA | 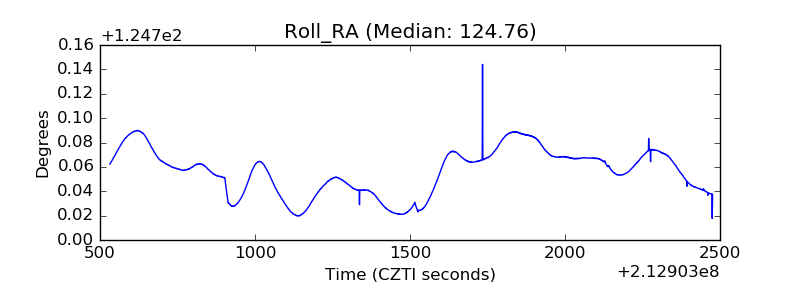 |
| Veto Counter | 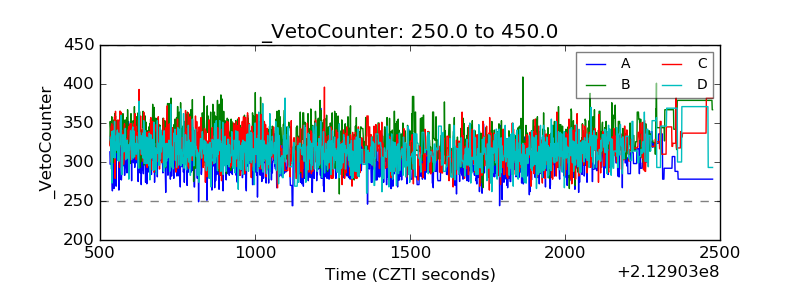 |