| Param | Original file | Final file |
|---|---|---|
| Filename | modeM0/AS1G05_204T01_9000000688_05451cztM0_level2.evt | modeM0/AS1G05_204T01_9000000688_05451cztM0_level2_quad_clean.evt |
| Size (bytes) | 569,315,520 | 115,683,840 |
| Size | 542.9 MB | 110.3 MB |
| Events in quadrant A | 3,530,263 | 766,688 |
| Events in quadrant B | 3,680,727 | 766,246 |
| Events in quadrant C | 3,473,560 | 766,457 |
| Events in quadrant D | 6,049,182 | 683,108 |
| Mode M0 | |||
|---|---|---|---|
| Quadrant | BADHDUFLAG | Total packets | Discarded packets |
| A | 0 | 16026 | 537 |
| B | 0 | 16359 | 568 |
| C | 0 | 16221 | 533 |
| D | 0 | 23782 | 614 |
| Mode SS | |||
|---|---|---|---|
| Quadrant | BADHDUFLAG | Total packets | Discarded packets |
| A | 0 | 158 | 6 |
| B | 0 | 158 | 2 |
| C | 0 | 158 | 8 |
| D | 0 | 158 | 4 |
| Mode M9 | |||
|---|---|---|---|
| Quadrant | BADHDUFLAG | Total packets | Discarded packets |
| A | 0 | 16 | 0 |
| B | 0 | 16 | 0 |
| C | 0 | 16 | 0 |
| D | 0 | 16 | 0 |
| Quadrant | Total seconds | Saturated seconds | Saturation percentage |
|---|---|---|---|
| A | 7484 | 113 | 1.509888% |
| B | 7469 | 92 | 1.231758% |
| C | 7485 | 58 | 0.774883% |
| D | 7479 | 841 | 11.244819% |
Noise dominated data is calculated using 1-second bins in cleaned event files. If a bin has >2000 counts, and if more than 50% of those come from <1% of pixels, then it is considered to be noise-dominated and hence unusable.
| Quadrant | # 1 sec bins | Bins with >0 counts | Bins with >2000 counts | High rate bins dominated by noise | Noise dominated (total time) | Noise dominated (detector-on time) | Marked lightcurve |
|---|---|---|---|---|---|---|---|
| A | 9257 | 7699 | 10 | 10 | 0.11% | 0.13% | 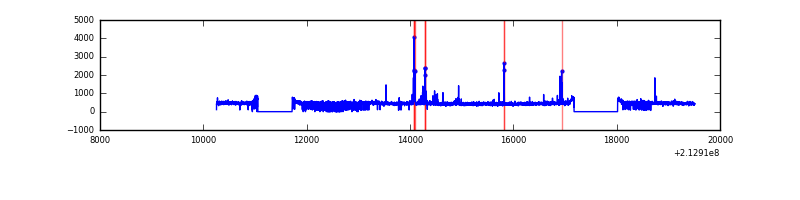 |
| B | 9257 | 7684 | 14 | 14 | 0.15% | 0.18% | 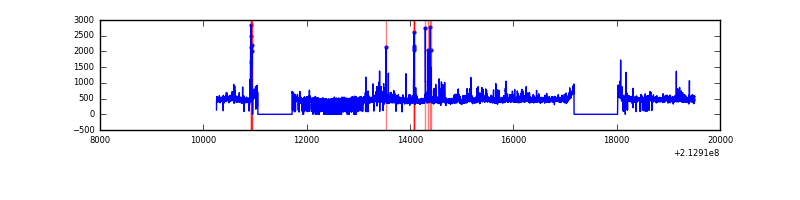 |
| C | 9257 | 7699 | 5 | 5 | 0.05% | 0.06% | 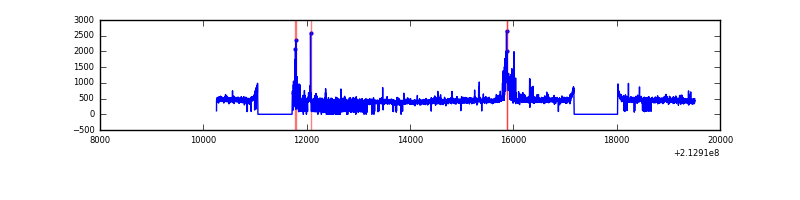 |
| D | 9257 | 7691 | 670 | 670 | 7.24% | 8.71% | 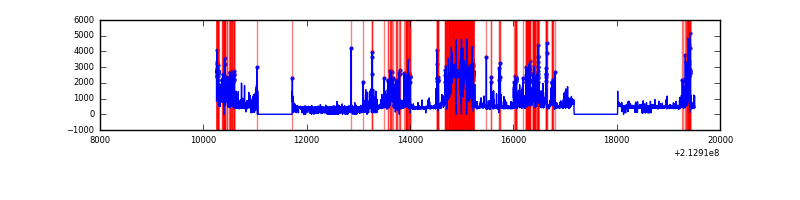 |
Top three noisy pixels from each quadrant. If the there are fewer than three noisy pixels in the level2.evt file, extra rows are filled as -1
| Pixel properties | Quadrant properties | ||||||
|---|---|---|---|---|---|---|---|
| Quadrant | DetID | PixID | Counts | Sigma | Mean | Median | Sigma |
| A | 0 | 247 | 103860 | 585.49 | 854 | 831 | 176.0 |
| A | 0 | 50 | 65267 | 366.17 | 854 | 831 | 176.0 |
| A | 15 | 174 | 41670 | 232.08 | 854 | 831 | 176.0 |
| B | 15 | 204 | 146374 | 877.82 | 860 | 837 | 165.8 |
| B | 4 | 48 | 108387 | 648.7 | 860 | 837 | 165.8 |
| B | 11 | 51 | 43435 | 256.93 | 860 | 837 | 165.8 |
| C | 9 | 247 | 211167 | 1097.01 | 827 | 830 | 191.7 |
| C | 9 | 221 | 11328 | 54.75 | 827 | 830 | 191.7 |
| C | 12 | 4 | 10952 | 52.79 | 827 | 830 | 191.7 |
| D | 2 | 33 | 2850728 | 14996.31 | 774 | 747 | 190.0 |
| D | 2 | 152 | 72094 | 375.42 | 774 | 747 | 190.0 |
| D | 12 | 233 | 41541 | 214.65 | 774 | 747 | 190.0 |
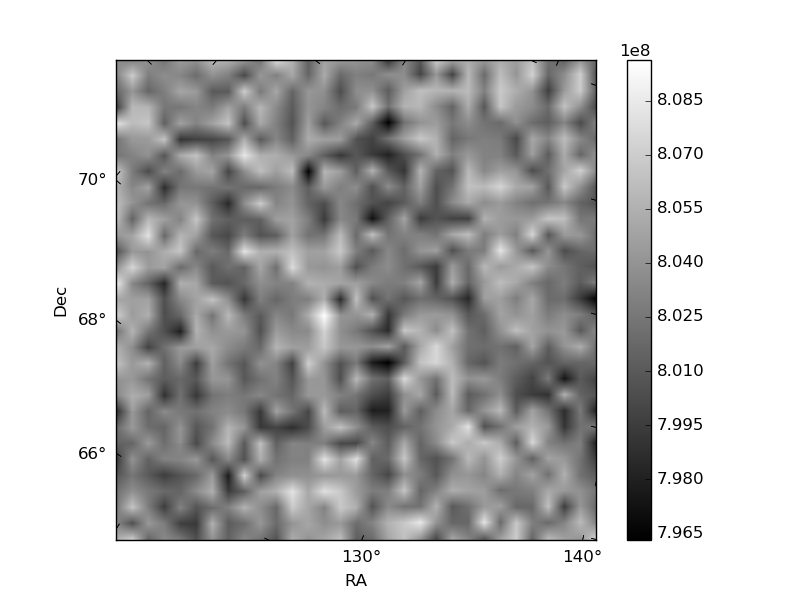
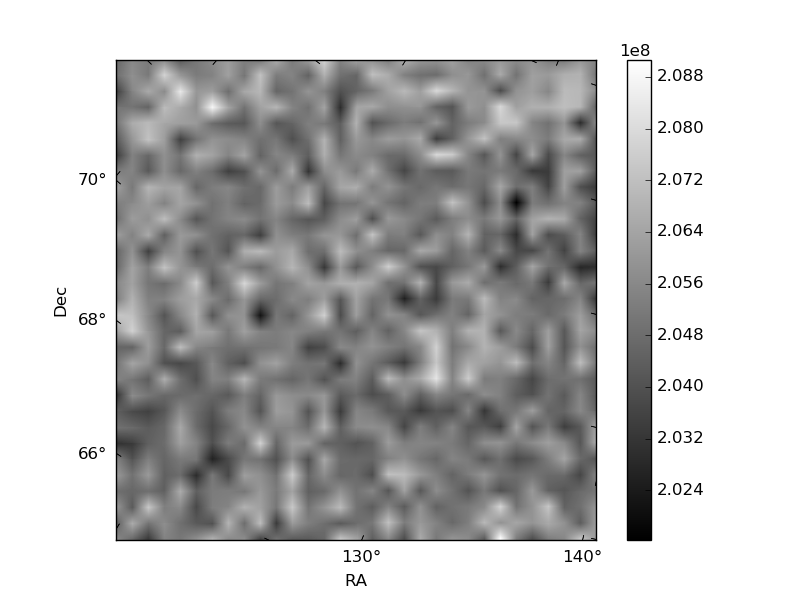
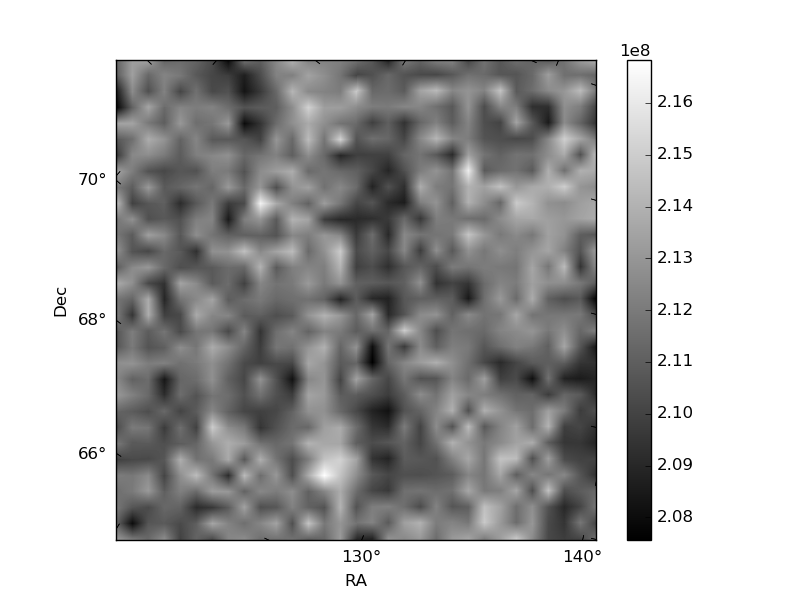
Histogram calculated using DETX and DETY for each event in the final _common_clean file
| Quadrant A | 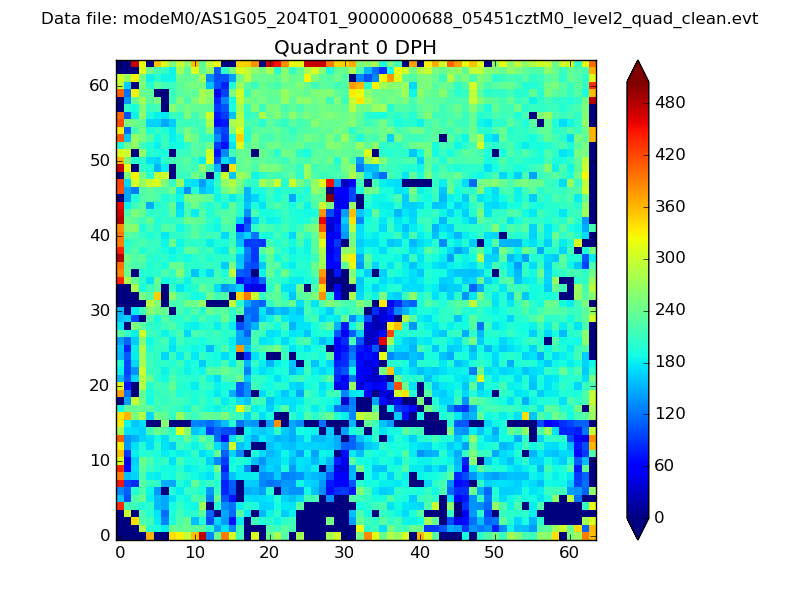 |
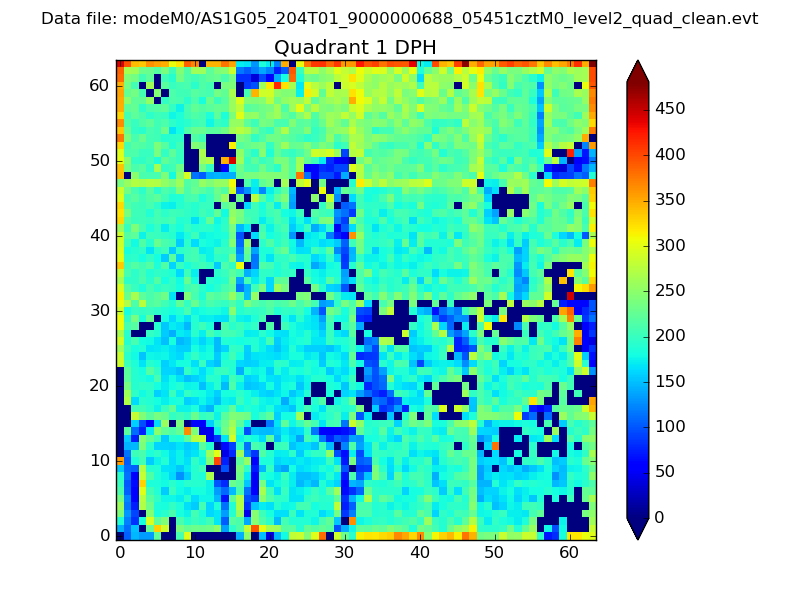 |
Quadrant B |
|---|---|---|---|
| Quadrant D | 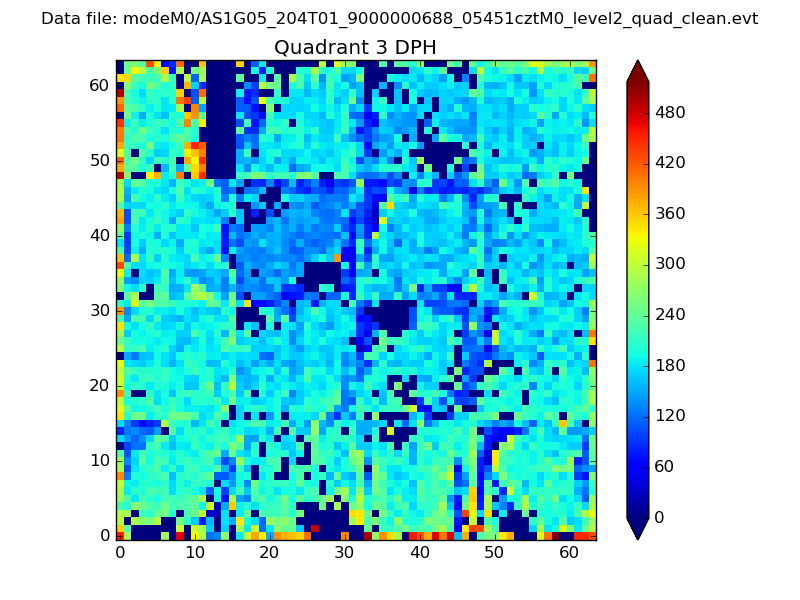 |
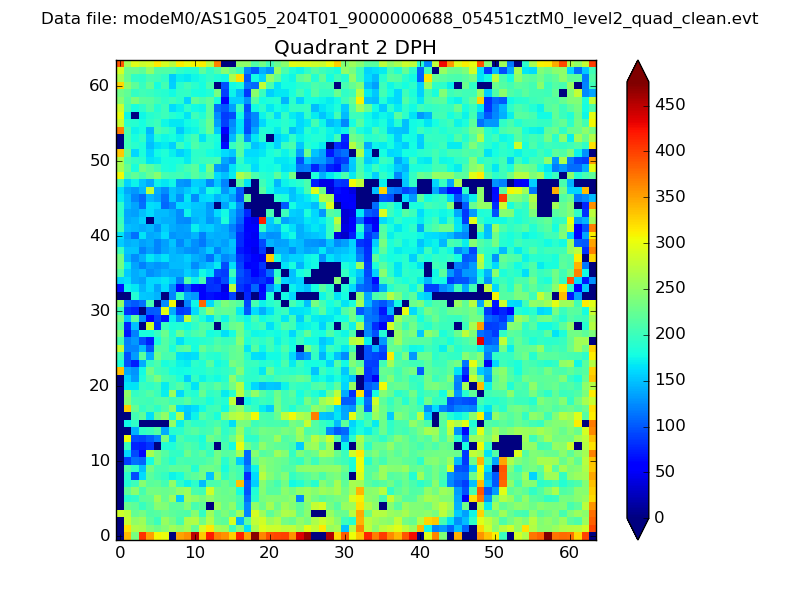 |
Quadrant C |
| Plot type | Count rate plots | Images |
|---|---|---|
| Comparison with Poisson distribution Blue bars denote a histogram of data divided into 1 sec bins. Red curve is a Poisson curve with rate = median count rate of data. |
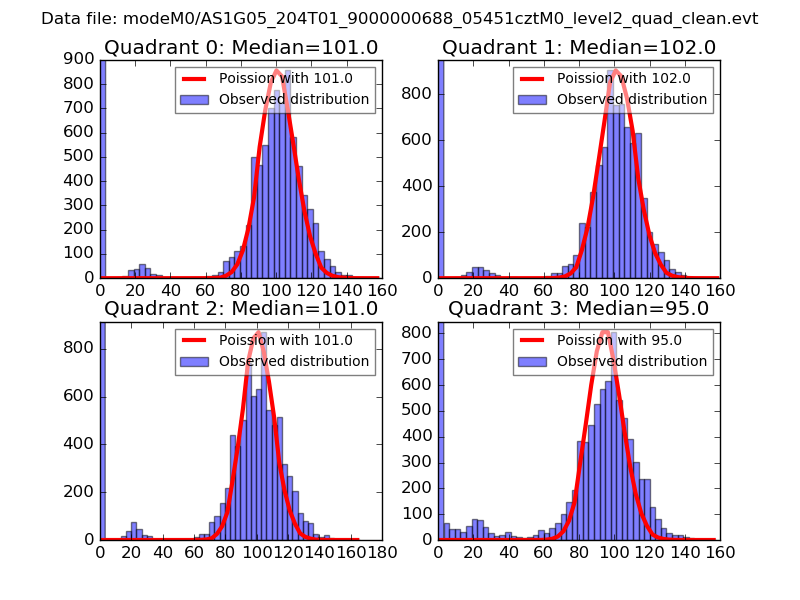 |
 |
| Quadrant-wise count rates Data is divided into 100 sec bins |
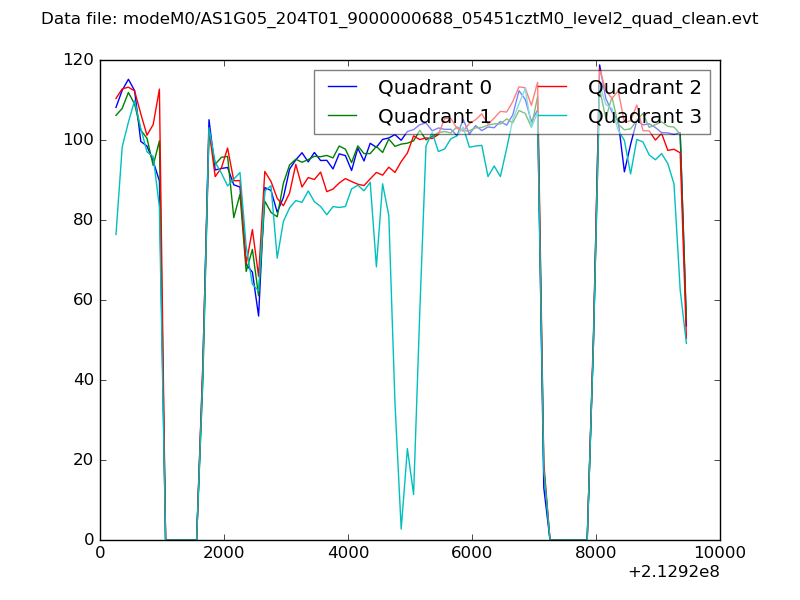 |
|
| Module-wise count rates for Quadrant A Data is divided into 100 sec bins |
 |
 |
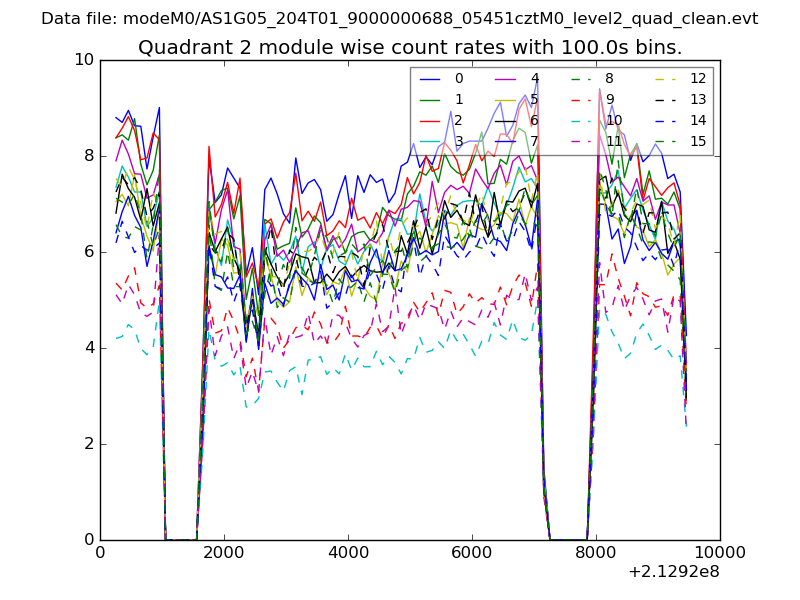
| Module-wise count rates for Quadrant B Data is divided into 100 sec bins |
 |
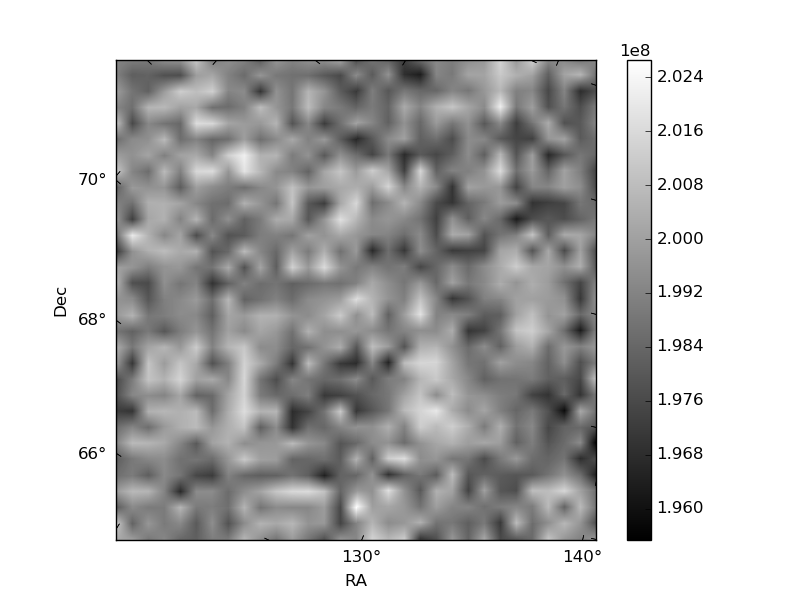 |
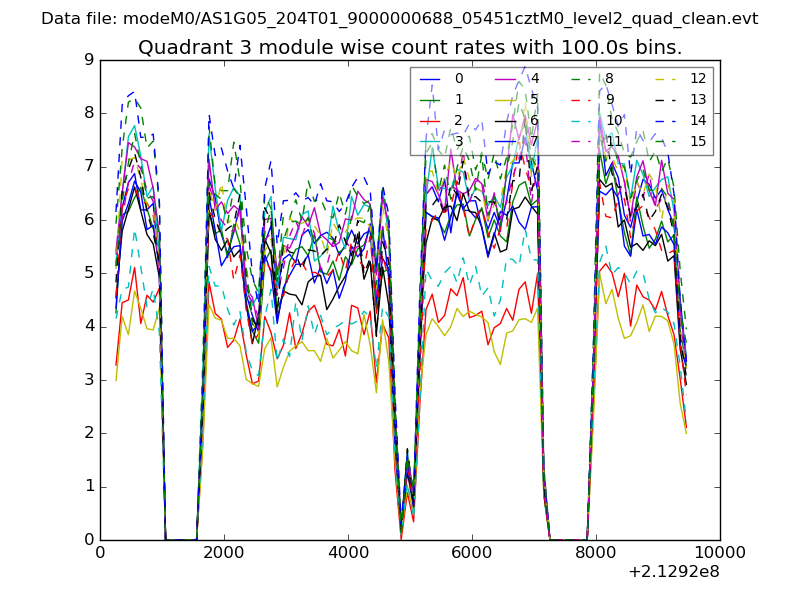
| Module-wise count rates for Quadrant C Data is divided into 100 sec bins |
 |
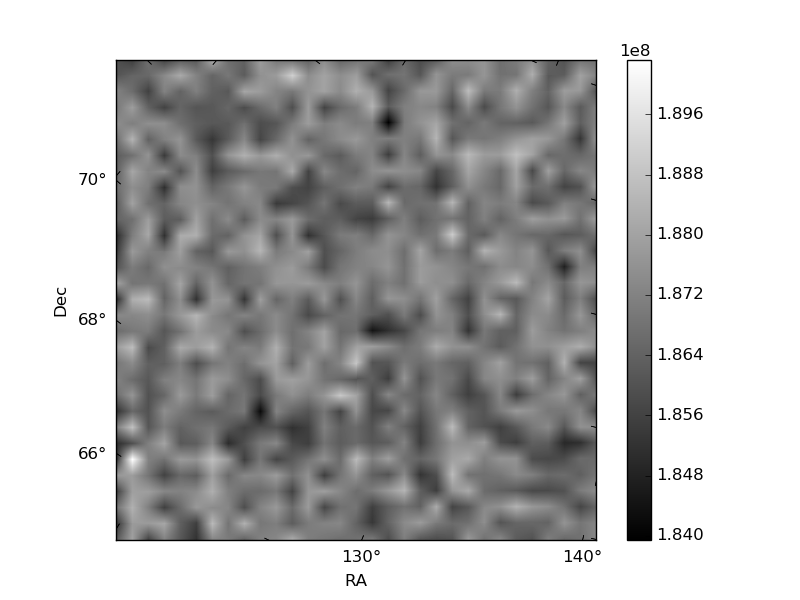 |
| Module-wise count rates for Quadrant D Data is divided into 100 sec bins |
 |
 |
| Parameter | Plot |
|---|---|
| CZT HV Monitor |  |
| D_VDD | 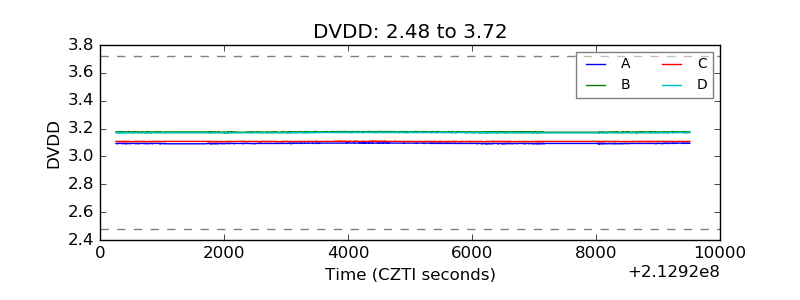 |
| Temperature 1 | 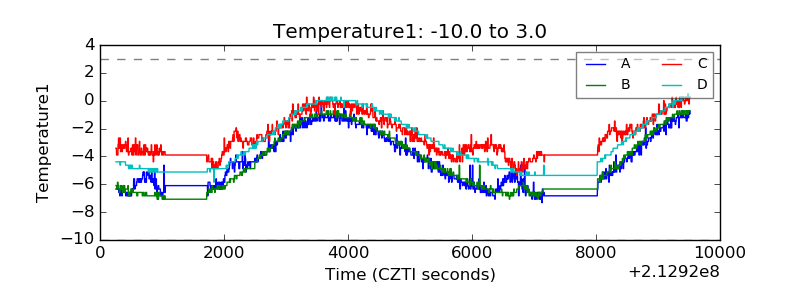 |
| Veto HV Monitor | 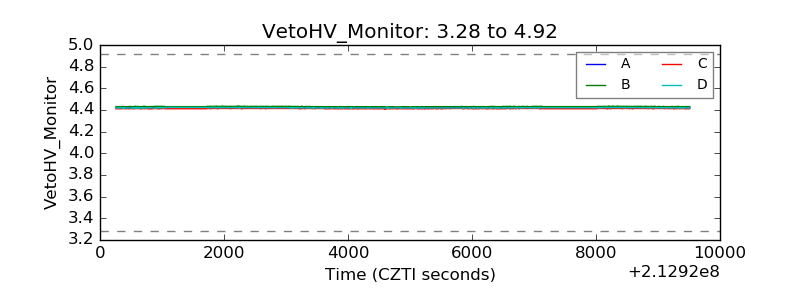 |
| Veto LLD | 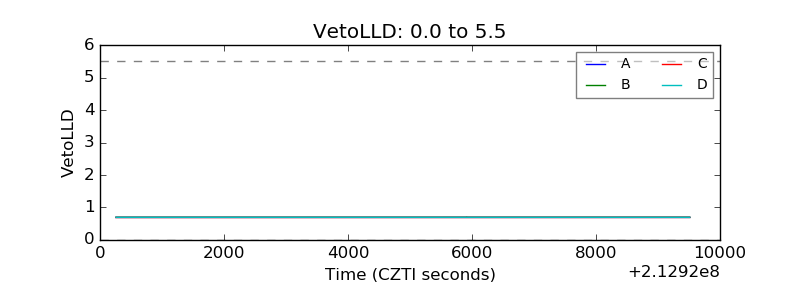 |
| Alpha Counter | 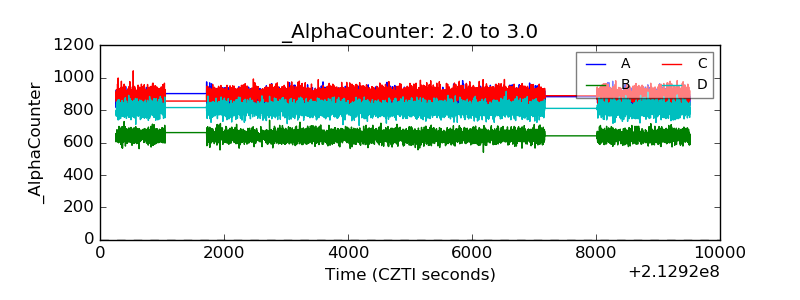 |
| _CPM_Rate | 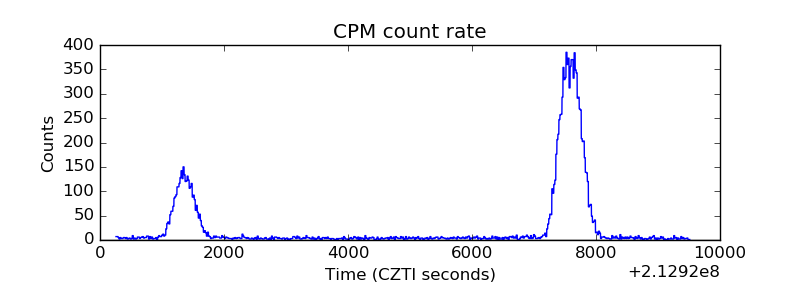 |
| CZT Counter | 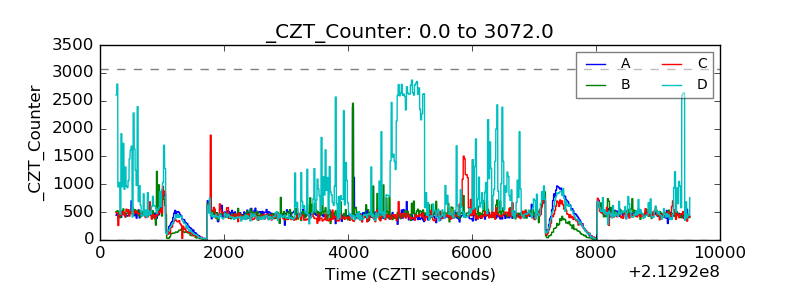 |
| +2.5 Volts monitor |  |
| +5 Volts monitor |  |
| _ROLL_ROT | 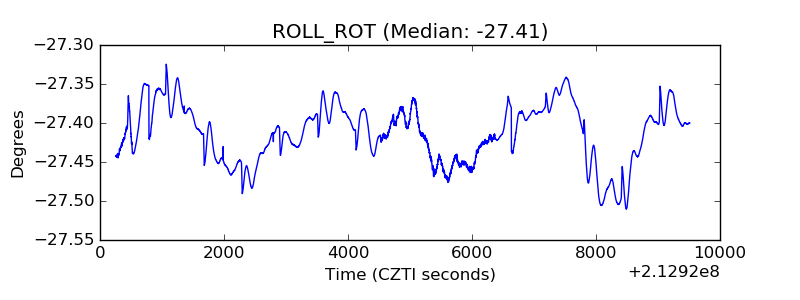 |
| _Roll_DEC | 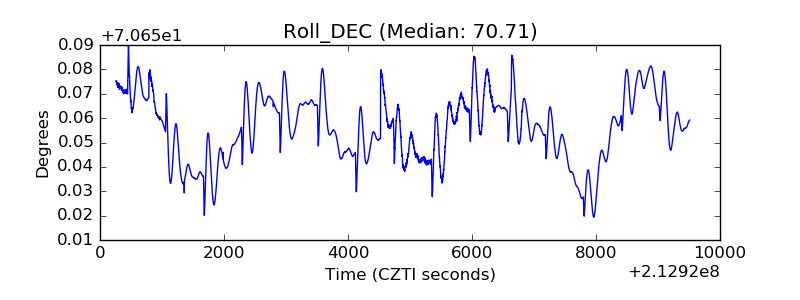 |
| _Roll_RA | 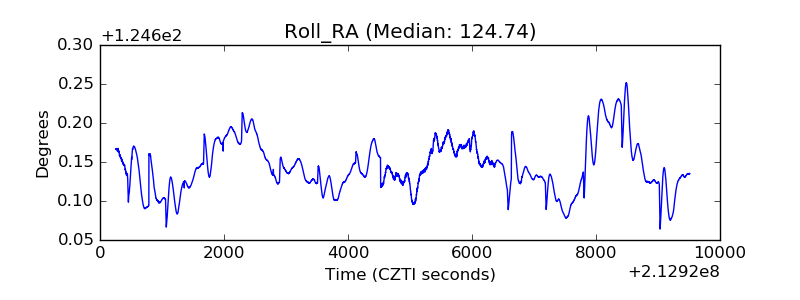 |
| Veto Counter | 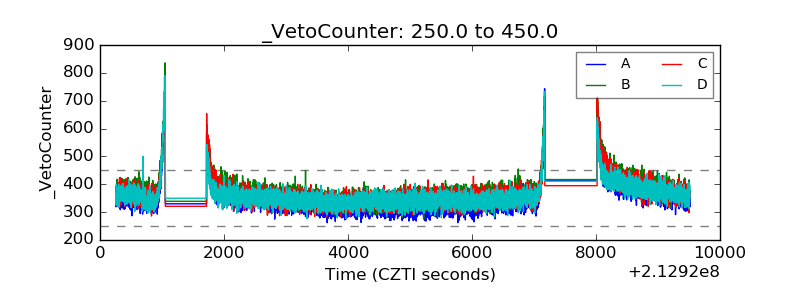 |