| Param | Original file | Final file |
|---|---|---|
| Filename | modeM0/AS1G05_204T01_9000000688_05455cztM0_level2.evt | modeM0/AS1G05_204T01_9000000688_05455cztM0_level2_quad_clean.evt |
| Size (bytes) | 443,119,680 | 99,149,760 |
| Size | 422.6 MB | 94.6 MB |
| Events in quadrant A | 2,697,544 | 661,614 |
| Events in quadrant B | 3,349,281 | 659,727 |
| Events in quadrant C | 2,788,014 | 661,866 |
| Events in quadrant D | 4,189,350 | 612,565 |
| Mode M0 | |||
|---|---|---|---|
| Quadrant | BADHDUFLAG | Total packets | Discarded packets |
| A | 0 | 12091 | 2 |
| B | 0 | 13865 | 1 |
| C | 0 | 12251 | 1 |
| D | 0 | 16405 | 1 |
| Mode SS | |||
|---|---|---|---|
| Quadrant | BADHDUFLAG | Total packets | Discarded packets |
| A | 0 | 118 | 0 |
| B | 0 | 118 | 0 |
| C | 0 | 118 | 0 |
| D | 0 | 118 | 0 |
| Mode M9 | |||
|---|---|---|---|
| Quadrant | BADHDUFLAG | Total packets | Discarded packets |
| A | 0 | 12 | 0 |
| B | 0 | 12 | 0 |
| C | 0 | 12 | 0 |
| D | 0 | 12 | 0 |
| Quadrant | Total seconds | Saturated seconds | Saturation percentage |
|---|---|---|---|
| A | 5825 | 60 | 1.030043% |
| B | 5825 | 71 | 1.218884% |
| C | 5825 | 46 | 0.789700% |
| D | 5825 | 438 | 7.519313% |
Noise dominated data is calculated using 1-second bins in cleaned event files. If a bin has >2000 counts, and if more than 50% of those come from <1% of pixels, then it is considered to be noise-dominated and hence unusable.
| Quadrant | # 1 sec bins | Bins with >0 counts | Bins with >2000 counts | High rate bins dominated by noise | Noise dominated (total time) | Noise dominated (detector-on time) | Marked lightcurve |
|---|---|---|---|---|---|---|---|
| A | 7080 | 5826 | 6 | 6 | 0.08% | 0.10% | 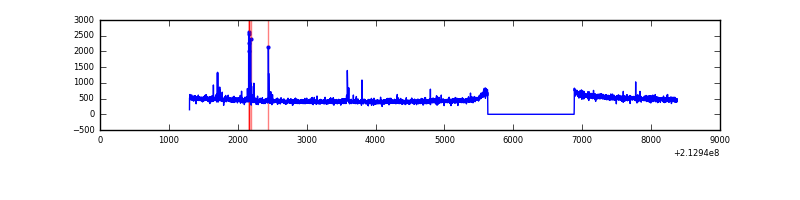 |
| B | 7080 | 5826 | 8 | 8 | 0.11% | 0.14% | 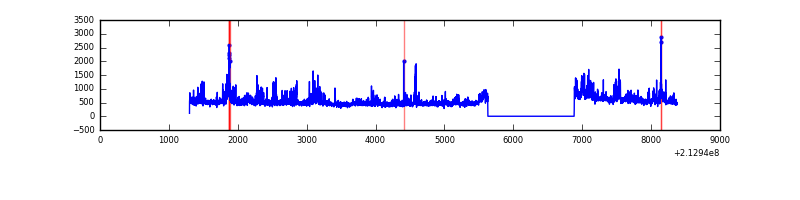 |
| C | 7080 | 5826 | 2 | 2 | 0.03% | 0.03% | 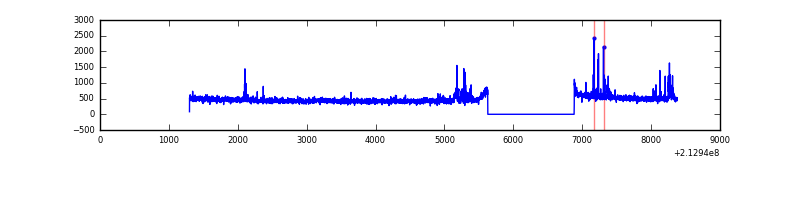 |
| D | 7080 | 5826 | 357 | 357 | 5.04% | 6.13% | 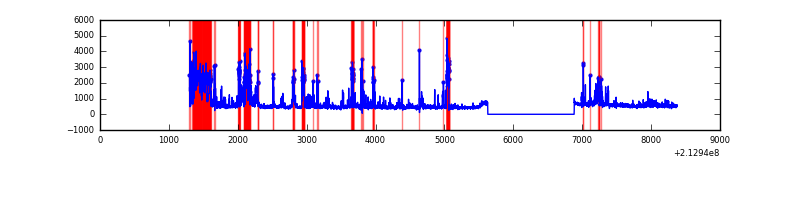 |
Top three noisy pixels from each quadrant. If the there are fewer than three noisy pixels in the level2.evt file, extra rows are filled as -1
| Pixel properties | Quadrant properties | ||||||
|---|---|---|---|---|---|---|---|
| Quadrant | DetID | PixID | Counts | Sigma | Mean | Median | Sigma |
| A | 0 | 50 | 37576 | 266.38 | 685 | 670 | 138.5 |
| A | 0 | 247 | 10766 | 72.87 | 685 | 670 | 138.5 |
| A | 0 | 226 | 7648 | 50.37 | 685 | 670 | 138.5 |
| B | 15 | 204 | 524291 | 4008.92 | 692 | 675 | 130.6 |
| B | 0 | 219 | 42360 | 319.15 | 692 | 675 | 130.6 |
| B | 4 | 48 | 38966 | 293.16 | 692 | 675 | 130.6 |
| C | 9 | 247 | 145138 | 943.05 | 674 | 677 | 153.2 |
| C | 14 | 67 | 5905 | 34.13 | 674 | 677 | 153.2 |
| C | 13 | 61 | 5517 | 31.59 | 674 | 677 | 153.2 |
| D | 2 | 33 | 1305398 | 8219.27 | 656 | 637 | 158.7 |
| D | 2 | 63 | 135350 | 848.62 | 656 | 637 | 158.7 |
| D | 8 | 195 | 100506 | 629.12 | 656 | 637 | 158.7 |
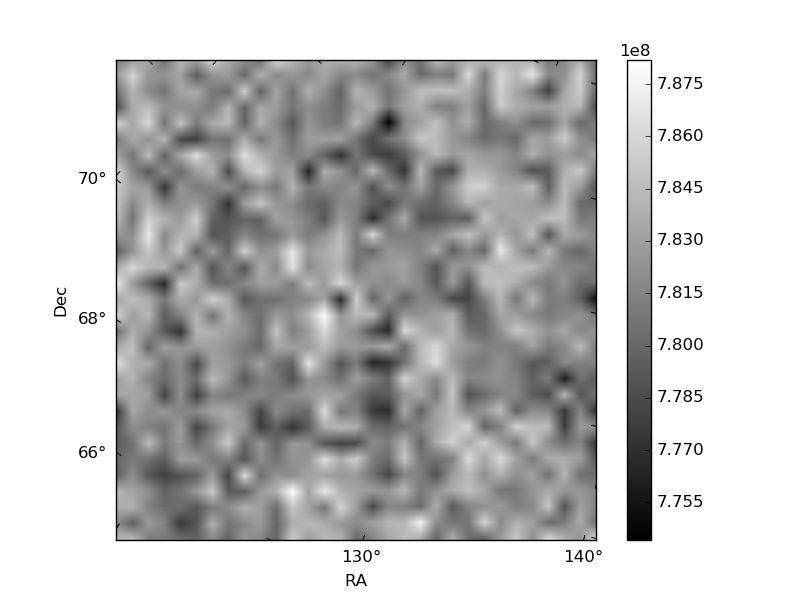
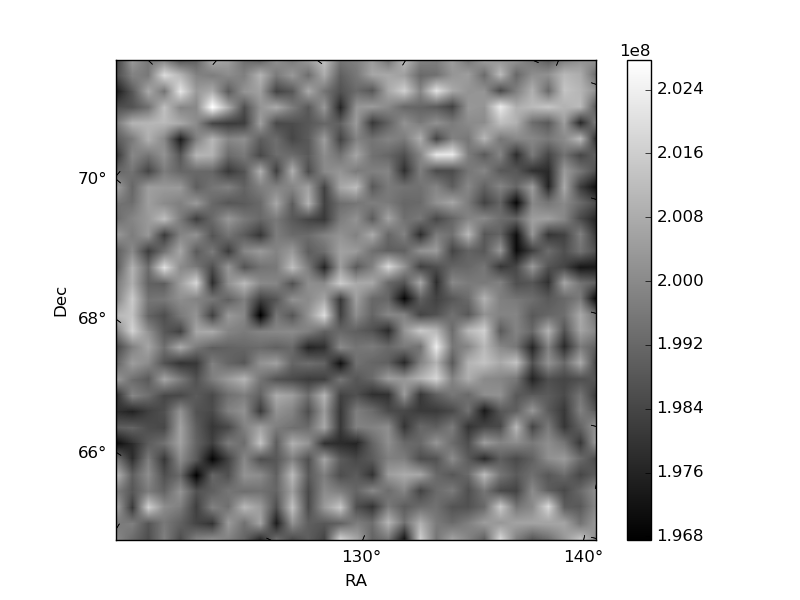
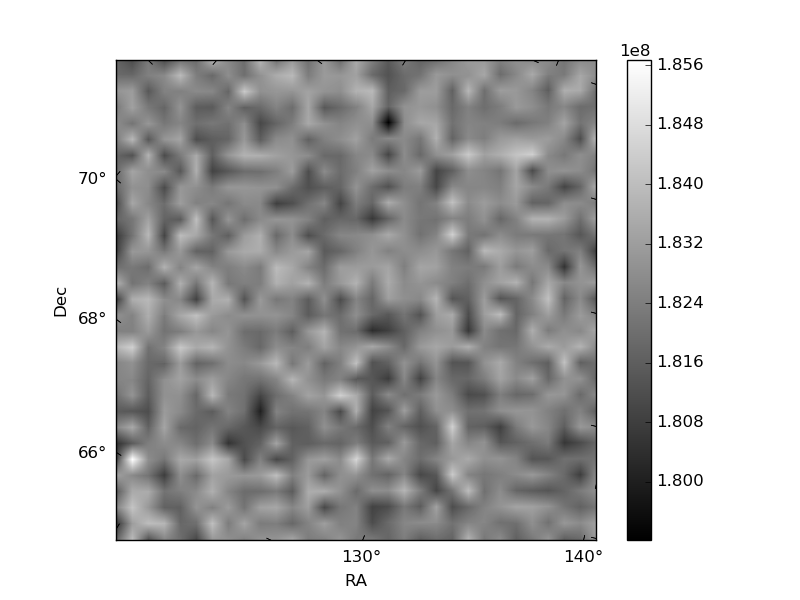
Histogram calculated using DETX and DETY for each event in the final _common_clean file
| Quadrant A | 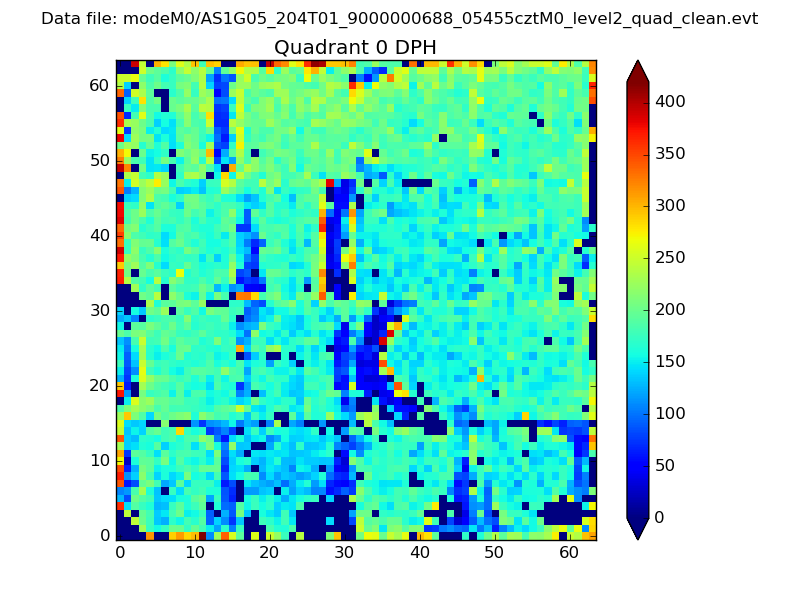 |
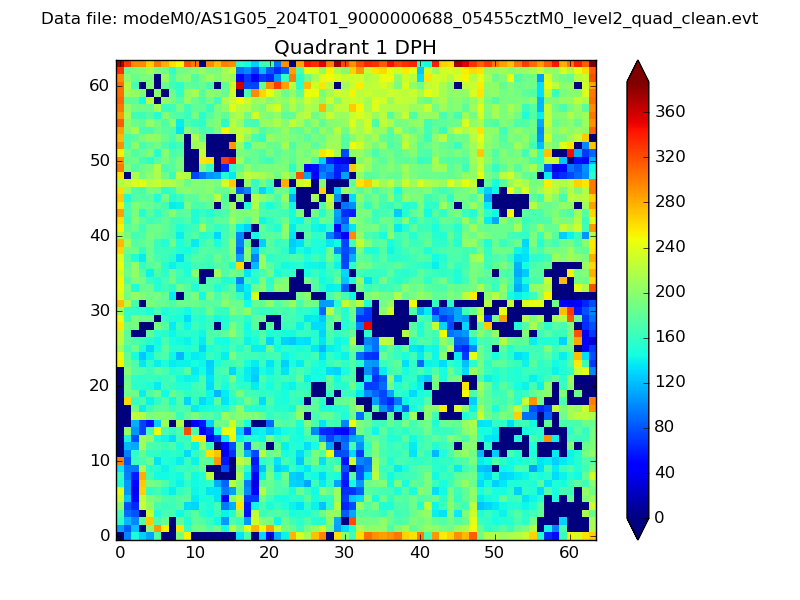 |
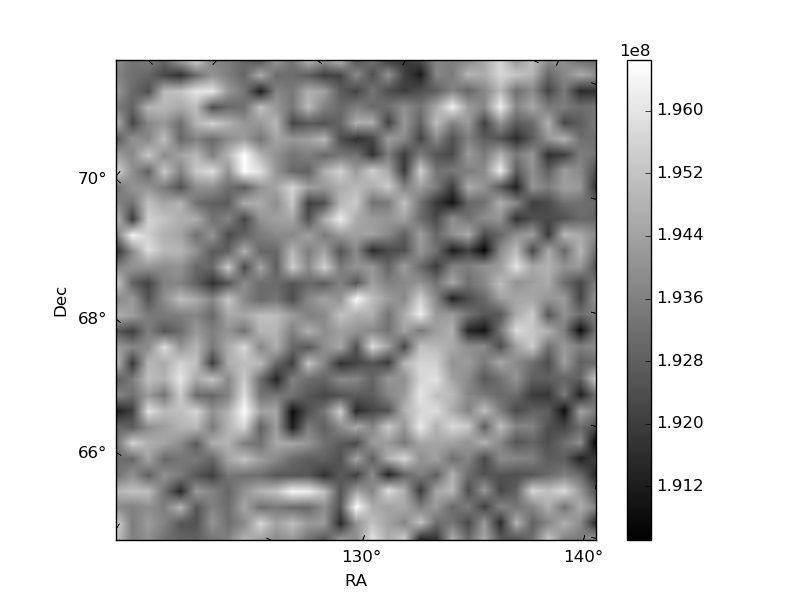
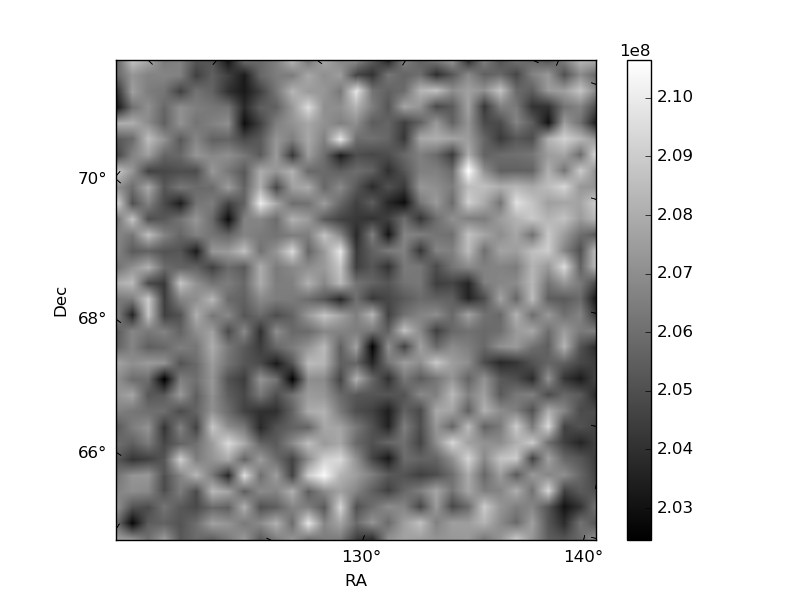
Quadrant B |
|---|---|---|---|
| Quadrant D | 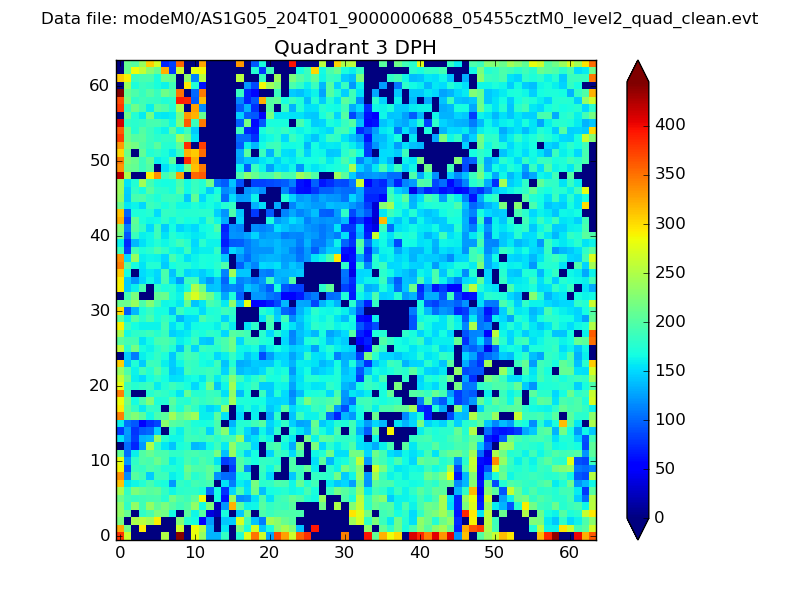 |
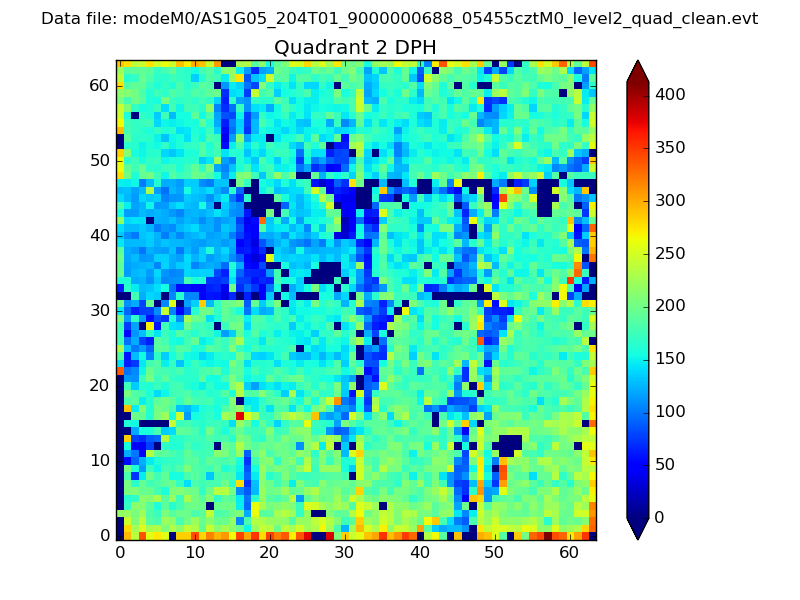 |
Quadrant C |
| Plot type | Count rate plots | Images |
|---|---|---|
| Comparison with Poisson distribution Blue bars denote a histogram of data divided into 1 sec bins. Red curve is a Poisson curve with rate = median count rate of data. |
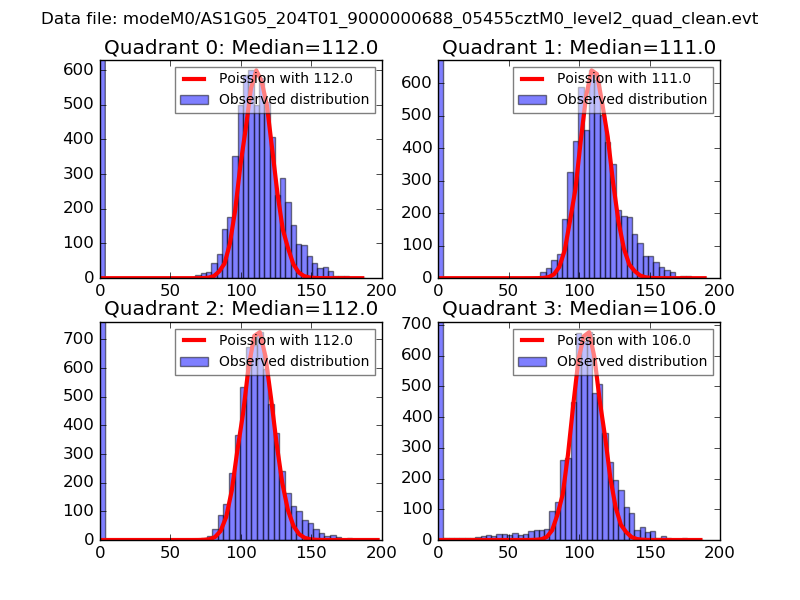 |
 |
| Quadrant-wise count rates Data is divided into 100 sec bins |
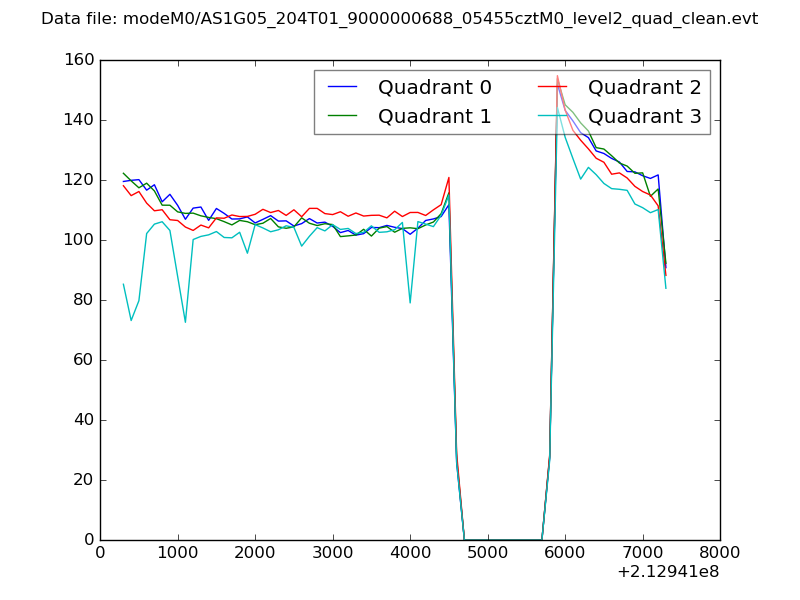 |
|
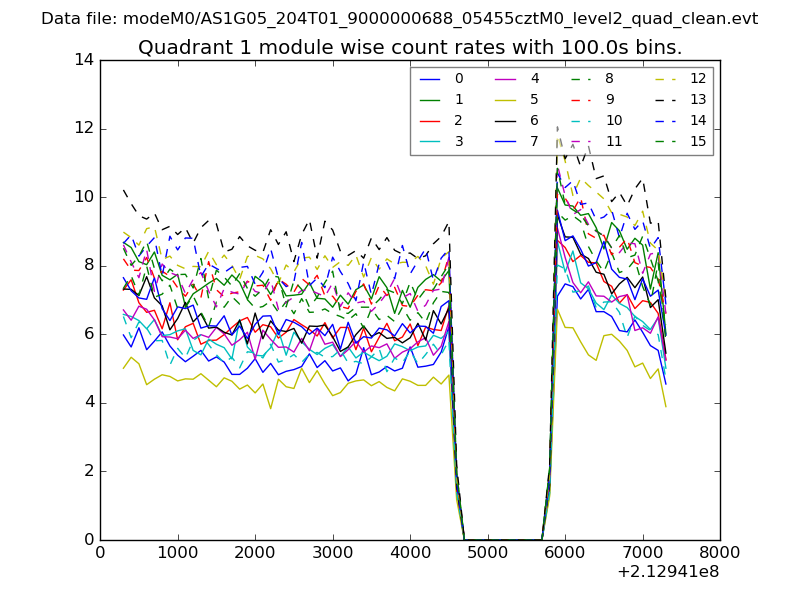
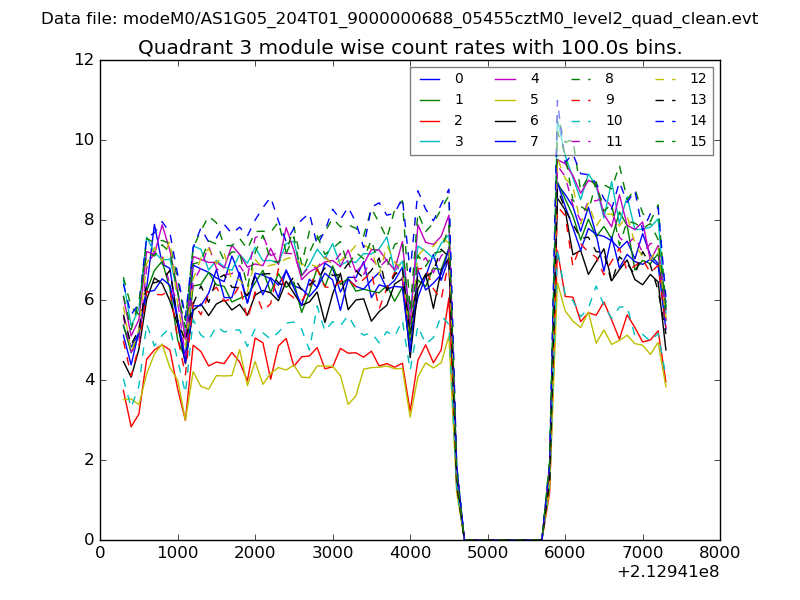
| Module-wise count rates for Quadrant A Data is divided into 100 sec bins |
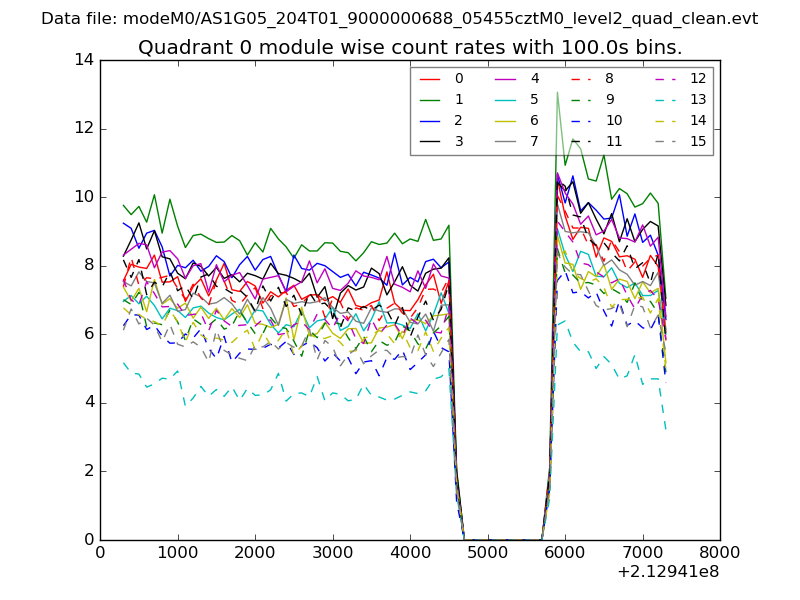 |
 |
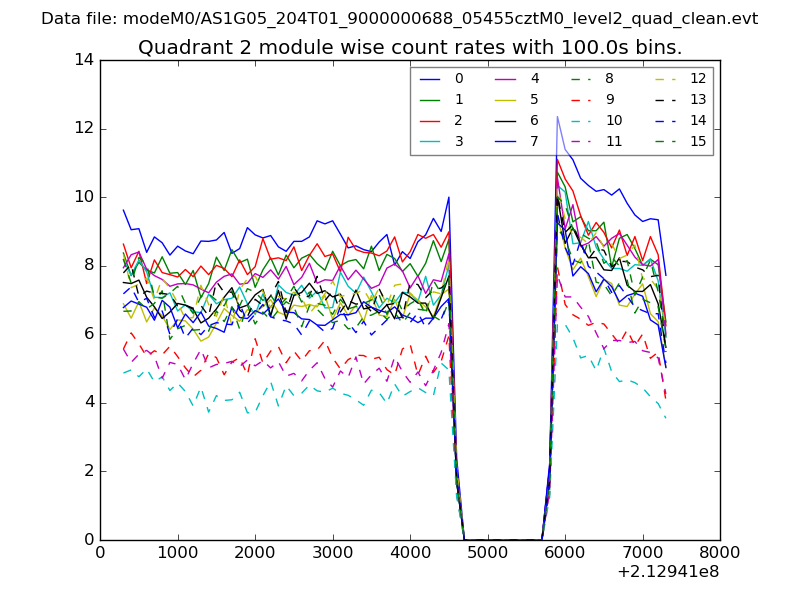
| Module-wise count rates for Quadrant B Data is divided into 100 sec bins |
 |
 |
| Module-wise count rates for Quadrant C Data is divided into 100 sec bins |
 |
 |
| Module-wise count rates for Quadrant D Data is divided into 100 sec bins |
 |
 |
| Parameter | Plot |
|---|---|
| CZT HV Monitor | 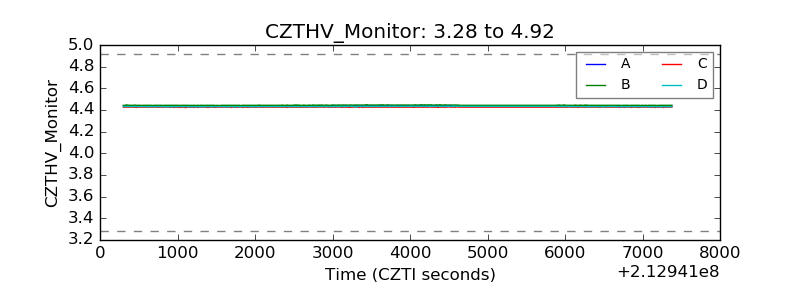 |
| D_VDD | 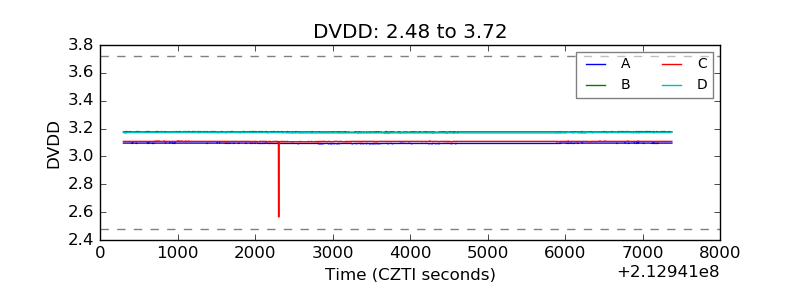 |
| Temperature 1 | 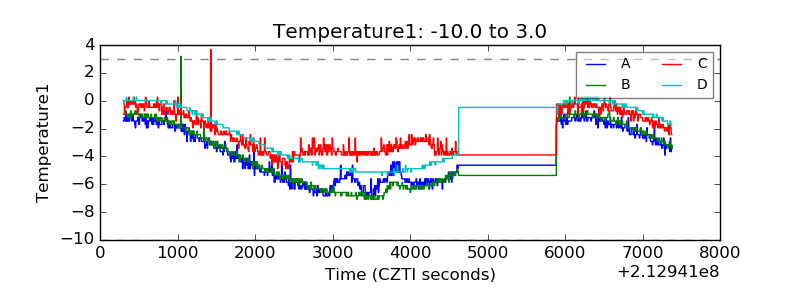 |
| Veto HV Monitor | 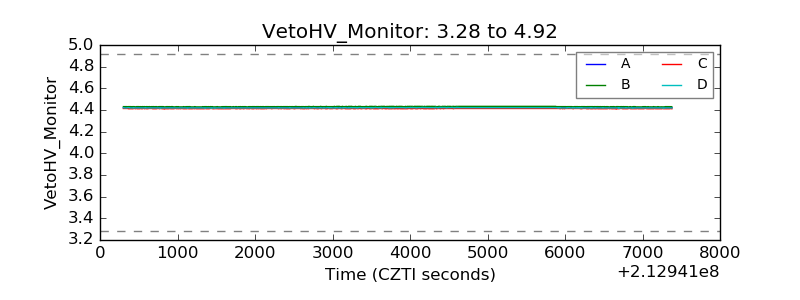 |
| Veto LLD | 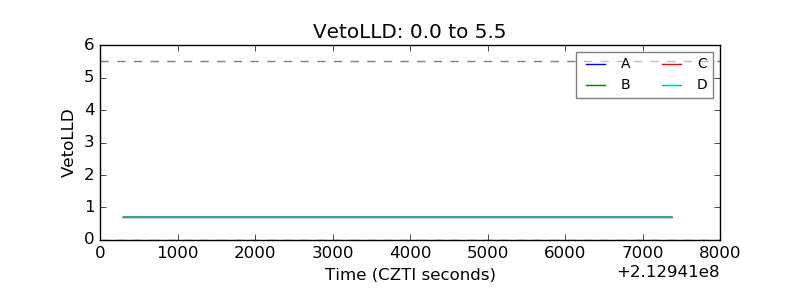 |
| Alpha Counter | 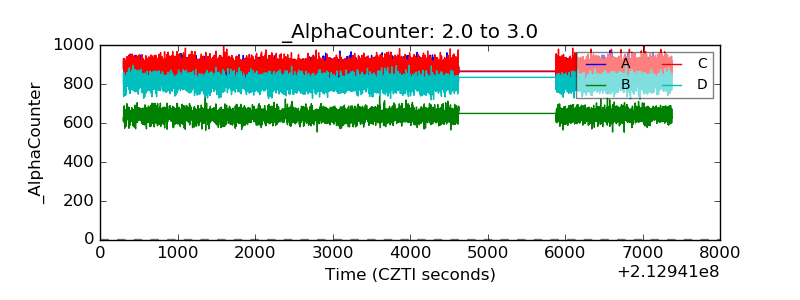 |
| _CPM_Rate |  |
| CZT Counter | 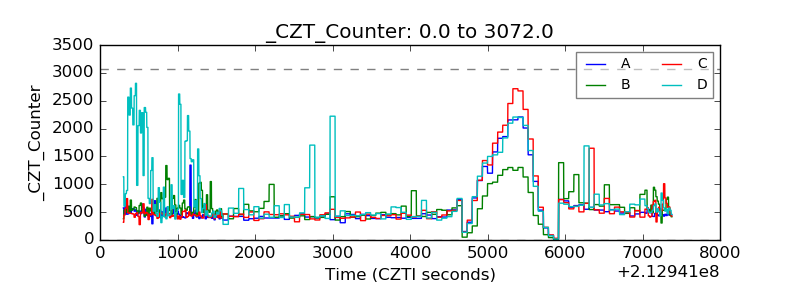 |
| +2.5 Volts monitor |  |
| +5 Volts monitor |  |
| _ROLL_ROT | 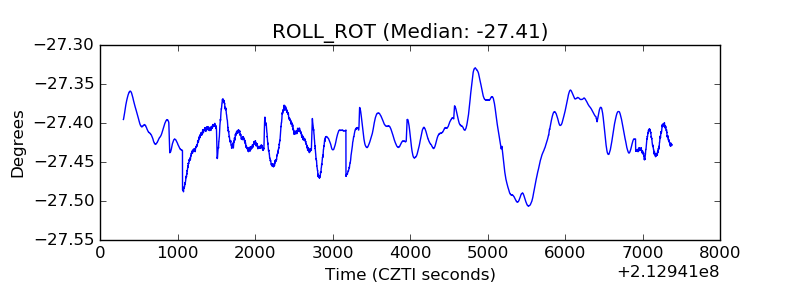 |
| _Roll_DEC |  |
| _Roll_RA | 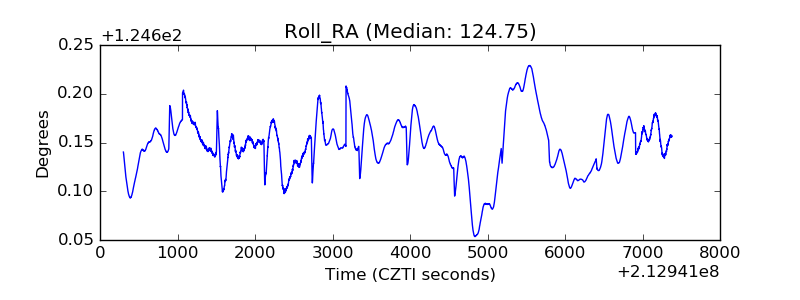 |
| Veto Counter | 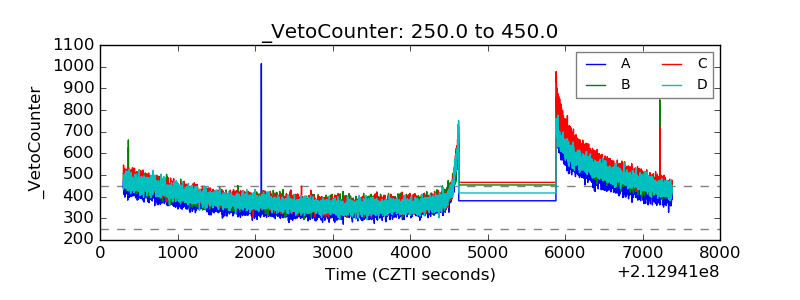 |